UK Housebuilding Sector - 2018: stick & reasons - Corbett Keeling
←
→
Page content transcription
If your browser does not render page correctly, please read the page content below
UK Housebuilding Sector

    2018: stick & reasons
‘Hit me with your rhythm stick’ ‘From the deserts of East Ham to the gardens of Cottenham’, the UK Housebuilding was whacked to the tune of 27% in 2018; and not one share price (from 18) rose It was also hit ‘slowly’ rather than ‘quick’, as the downward momentum gathered tempo, with Q4 (minus 16%) being the worst “Ow” as the late, great Ian Dury (1942-2000) sang in one of his most famous songs (and his sole number one) For his was a capricious business, just like housebuilding; for example, from 252 trading days in 2018, 52% were ‘up’ and 48% were ‘down’ The maximum rise and fall in a single day, too, was plus 5.0% and minus 6.3%
“Reasons to be cheerful - 1 2 3” “A bit of grin and bear it, a bit of come and share it. You’re welcome we can spare it’ Three of Mr Dury’s reasons-to-be-cheerful; and he was “one of few true originals of the English music scene” And UK Housebuilding can enjoy its own jocund, musical treble even with the dissonance of an off key No-Deal- Brexit-Big-Bopper: 1: December (+1%) was the only month in Q4 to see a rise in value, the Christmas period added 2.2% while the first four trading days of 2019 put on a further 3.2%; 2: earnings growth will be flat in 2019 but increase 5% next year; and 3: a prospective yield of 7% plus The Sector has had its worst year
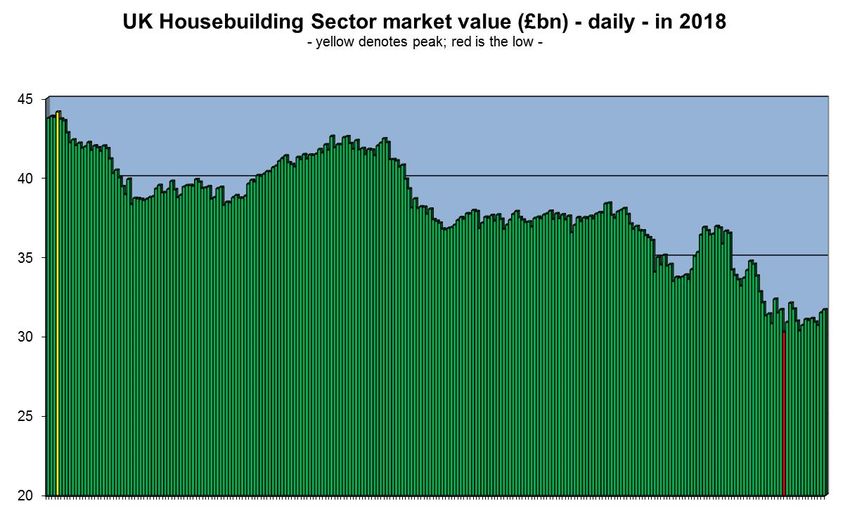
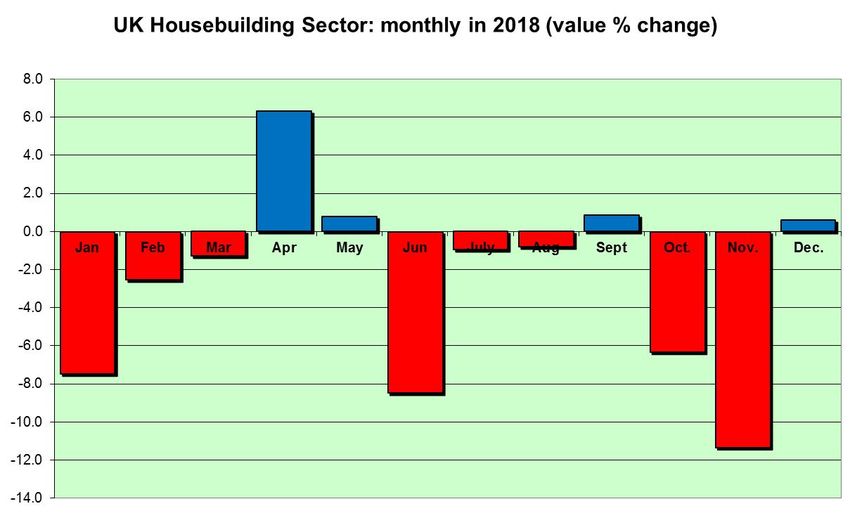
2018 In the calendar year, the stock market value of the UK Housebuilding Sector declined by 27% or £11.8 billion (which compares with a treble clef of plus 43% in 2017) Note, too, that the Sector’s best chart placing of the year came on 5 January and the lowest on 17 December 2018 also closed 29% off its all-time peak tone level from 24 October 2017 In 52 weeks, too, there was a rhythmical rise and fall of 24 up/28 down There were also only four individual months when the Sector rose in value (and only one of these turned up the volume): April (+6%); May (+1%); September (+1%); and December (+1%)
2018 cont/. All four Quarters were negative too, especially Q4 with minus 15.9% against Q3 (that said Q2 was down just 0.8%) The best and worst week, too, were strangely close i.e. Week 44 with +9.7%; and Week 48 with minus 9.9%; loud music The best and worst days were also audibly near: 5 December with plus 5.0%; and 15 November with minus 6.3% Looking back to the Sector’s trough (7 July 2008) the rise has been more than 1,000% (£28.5 billion) even after 2018’s refrain; and the Sector is still 25% above where it was in the immediate aftermath of the Brexit referendum wall of sound Similarly, the Sector has achieved higher notes in 24 or the last 36 quarters - and seven of the last 10 years
UK Housebuilding Sector: Q1 2010 - Q4 2018
                   - weighted % change in share prices quarter by quarter -

30

20

10

 0

-10

-20

-30
   2010   2011   2012     2013      2014      2015       2016      2017       2018
    Q1     Q1     Q1       Q1        Q1        Q1         Q1        Q1         Q1
UK Housebuilding Sector: annually 2006 - 2018
- % change in share prices -
100
80
60
40
20
0
-20
-40
-60
-80
2006 2007 2008 2009 2010 2011 2012 2013 2014 2015 2016 2017 2018Share prices in 2018 Housebuilders’ share prices fell by an average 23% last year actual or 27% weighted by market capitalisation; in 2017, these numbers were +37% and +43% respectively Abbey, the UK and Irish player, sounded the most positive note, even though this was minus 3.4% with support from the rhythm section of Springfield (minus 4.1%) and Watkin Jones (minus 5.0%) Least pleasing were the two other Irish band members (performing in London and Dublin) - Cairn Homes and Glenveagh, which fell 45 and 40% respectively Crest was also off key at minus 40%, with seven others percussively down by between 25 and 32%
Share prices in 2018 (% change)
0.0
-5.0
-10.0
-15.0
-20.0
-25.0
-30.0
-35.0
-40.0
-45.0
-50.0
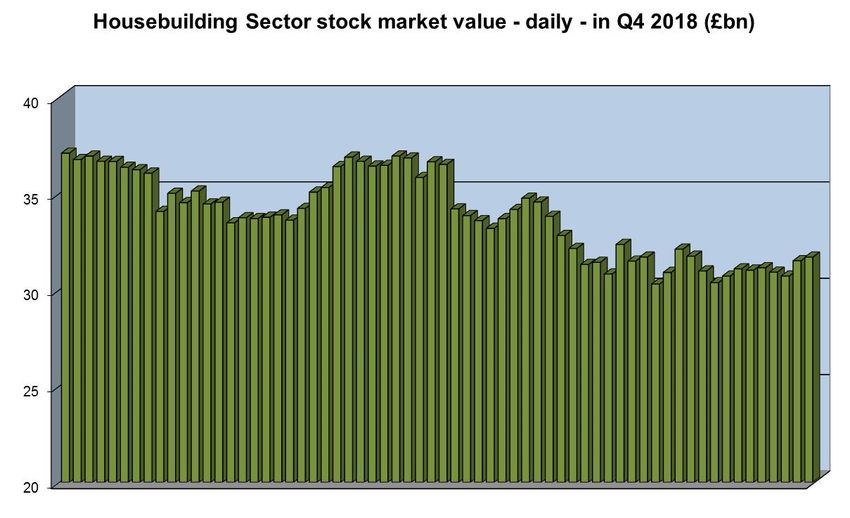
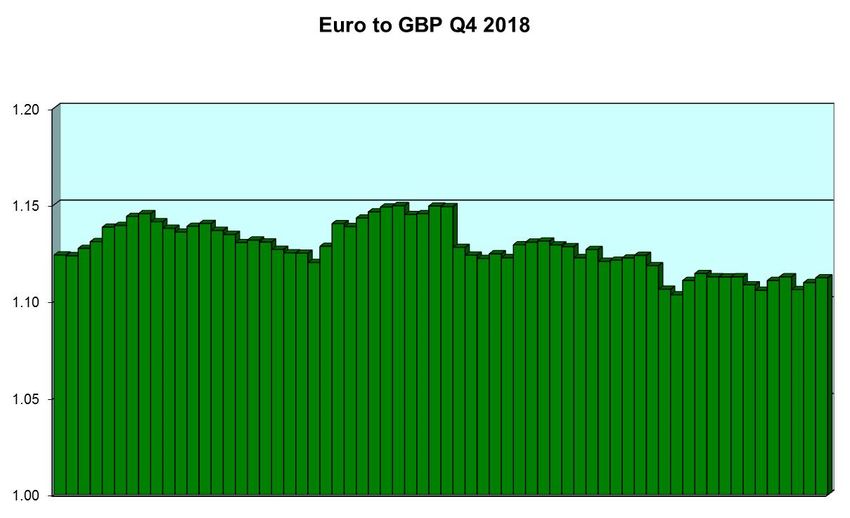
CRN GLV CRST TW TEF PSN BWY BDEV BVS RDW BKG GLE CSP INL MCS WJG SPR ABBYQ4 In the fourth quarter of 2018, the stock market value of the UK Housebuilding Sector dropped 15.9% quarter on quarter, making it the worst quarter-tone of the year In Q4 2017, the Sector conducted a 7.3% rise in value November was a particularly difficult month, too, with an 11.3% drop; the worst from the 12-bar of 2018 We have also plotted the Housebuilders rise and fall in value against the value of the Euro versus the British Pound Both are barometers of future economic climes and there is a jarring harmony between the two - other than in Week 40 - and a drift from top left to bottom right
Spot the difference: Housebuilders vs Euro
Q4 - individual share prices Actual share prices (as opposed to Pound notes) in Q4 lost 14.4% actual and 15.4% weighted by market capitalisation In Q4 2017 these scores were a tuneful plus 5.9% and plus 7.1% respectively From 18 Sector companies, only two was lyrically positive in Q4 i.e. Watkin Jones (+6.5%) and McCarthy & Stone (+3.4%) On the same timing, Abbey, Berkeley and Crest were off in single digit percentages At the other extreme, Telford’s share price dropped 32%, with Cairn and Glenveagh both on the down beat of minus 27%
Share prices in Q4 versus Q3 2018 (% change)

10

 5

 0

 -5

-10

-15

-20

-25

-30

-35
      TEF   CRN GLV   TW   BVS   PSN BDEV BWY RDW SPR   GLE   INL   CSP ABBY CRST BKG MCS WJG
Relative performance in Q4 In 2018, the Housebuilders were the worst relative performer in the equity orchestra On a weighted basis, Sector share prices fell 27% Next worst was Construction (and Building Materials) on minus 24% with REISs and REITs (the key real estate indices) reduced by 19 and 16% respectively At the same time, the three core measures of the UK equity market - the FTSE 100, 250 and All Share - all dipped by between 12 and 16% in 2018 In Q4, the Housebuilders (minus 15%) were narrowly second worse to Construction with the FTSE 250 a close support band
Relative % change in value in Q4 and the full year 2018
            - all percentage changes are negative; housebuilders' performance is weighted -

                                                                                         FTE 100

                                                                                FTSE All Share

                                                                                        FTSE 250

                                                                                                         In Q4
                                                                                              REIT
                                                                                                         2018

                                                                                              REIS

                                                                                     Construction

                                                                                Housebuilding

-30   -25                 -20               -15               -10               -5                   0
Peak value / FTSE 100/ Structure At 31 December 2018, Housebuilders’ share prices were on average 1,400% above the lows of 2008; and 10% up on more recent 52 week lows (weighted these numbers play 1,900 and 9% respectively) But, the Housebuilders were also some 32% below their 2007 recording peaks (i.e. 35% weighted); and 28% and 29% off 52 week highs on an actual and weighted basis Four housebuilders also continued in the FTSE 100 as at 31 December 2018: Taylor Wimpey (number 91); Berkeley (90); Barratt (87); and Persimmon (65) Together, these four players account for 62% of Sector label value
Movement against 52 week lows and highs (% change)

100

90

80

70

60

50                                                                                    Off high
                                                                                      Up from low
40

30

20

10

 0
      ABBY WJG SPR BKG GLE CSP RDW BDEV BVS   INL BWY TW   PSN MCS TEF GLV CRN CRST
Sector structure by stock market value (£31.7 billion at 31/12/18)
18 companies [legend is in £bn]
100%
80% < 0.5 bn
0.5 - 0.9
1.0 - 1.9
60%
3.0 - 3.9
4.0 - 4.9
40% 5.0 - 5.9
6.0 - 6.9
20%
0%
BY VALUE BY NUMBERPrice-to-Book/TSR The Housebuilders’ latest average Price-to-Book valuation was 1.46 on 31 December 2018 and 1.60 weighted A year ago, these ratios were louder at 1.94 and 2.31 Two (Cairn and Countryside) out of 18 companies are at 2.0 or better with Watkin Jones at an extraordinary F-sharp 3.9 Total Shareholder Return (TSR) for the Sector in 2018 was minus 19.3% and minus 21.9% weighted This compares with positive notes of 42% and 51% respectively in 2017 In the latest 12 months, no individual TSR was positive although Springfield was best artist with a minor negative 1.2%; albeit Cairn Homes sounded worst at minus 42%
Price-to-book-value at year end/latest interim* & priced at 31/12/18
                                              - weighted average is 1.60; actual average is 1.46 -

4.50

4.00

3.50

3.00

2.50
                                                                                                                        P2B
2.00                                                                                                                    Wt av.

1.50

1.00

0.50

0.00
        L

                             V*

                                                                                         G*
                                                      N*
                                                S*

                                                                                                            P
                                                                        R

                                                                                                E
                 *

                                                                                                      N*
                                          S
                      F*

                                     *

                                                                             EV
                                                            Y

                                                                                                                    *
                                                                                    *
                                                                  W
             BY

                                  ST

                                                                                                                JG
                                                                                  TW
       IN

                                                                                              GL
                                         MC

                                                                                                           CS
                                                                      SP
                                                           BW
                     TE

                                                                RD
                           GL

                                              BV

                                                     CR

                                                                                                     PS
                                                                                        BK
                                                                            BD
                                CR
            AB

                                                                                                                W
Total Shareholder Return (TSR) in 2018 (%)
- source Bloomberg; CSP is estimated; average is minus 19.3% -
0
-5
-10
-15
-20
-25
-30
-35
-40
-45
CRN GLV CRST TEF TW BWY PSN BDEV RDW BVS BKG GLE INL MCS CSP WJG ABBY SPRPrice Earning Ratio (PER) The Housebuilding Sector’s prospective PERs are 8.0x in 2018/19 followed by 7.6x in 2019/20 based on consensus forecasts Average earnings growth is forecast as modest (i.e. +1%) in 2018/19 but at +5% in 2019/20 Note, too, Berkeley’s prospective sharp drop in its current fiscal year (i.e. 25%) in pretax profit - guided by the Group - also impacts 2018/19 in particular For the record, trailing-12-month PERs for the FTSE 100, All Share Index and FTSE 250 range from 11.2 to 14.9x; which compares with the Sector’s 8.6x on the same basis Note, too, Cairn and Glenveagh are excluded due to losses or minimal earnings at this point; but this will change very soon
PERs: 2018/19F (av. 8.0x) and 2019/20F (7.6x)
                   - sourced from Digital Look & Reuters; priced at 31 December 2018 -

 TEF
RDW
BWY
CRST
 INL
 TW
CSP
BDEV                                                                                                 2020
PSN                                                                                                  2019
ABBY
SPR
 BVS
 GLE
BKG
WJG
MCS

   0.000   2.000     4.000       6.000        8.000       10.000       12.000      14.000   16.000
Dividend Yield In 2018/19 and 2019/20 seasons, the UK Housebuilding Sector yields, on average, are forecast at 7.1% and 7.5% - with dividend cover at 2.1x in both instances Note, too, that a number of companies has committed to enhanced dividend payments which means there are three or four companies with double digit prospective yields For the record, the UK equity market yields between 3.4 and 4.7% historic with average cover of 1.9x Here the FTSE 100, 250 and All Share represent the UK equity market; and all calculations are made at the London Stock Exchange (LSE) close on 31 December 2018
Yield: 2018/19F (av. 7.1%) and 2019/20F (7.5%)
- sourced from Digital Look & Reuters; priced at 31 December 2018 -
TW
BVS
PSN
BDEV
CRST
ABBY
RDW
TEF 2020
BWY 2019
GLE
INL
BKG
SPR
CSP
WJG
MCS
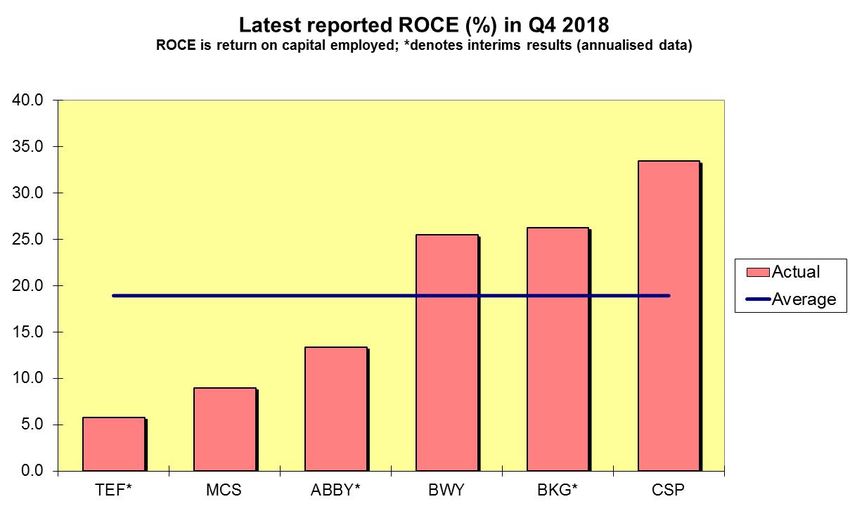
0.000 2.000 4.000 6.000 8.000 10.000 12.000 14.000Results in Q4 In Q4 there three sets of final results, three interims and more than 15 trading related announcements from 18 Sector companies Average individual pretax profits for the Q4 reportees rose 1% whilst average individual EBIT margins declined from 19.8 to 17.3% - on revenue 11% larger at £6.74 billion EPS were flat on average while dividends were raised 12% (ex-the Abbey special) with average individual cover easing from 2.6 to 2.3x (again ex-Abbey) Orders dipped by an average 2%; from a sample of three Average individual ROCE reduced from 20.5 to 18.9% with Capital Turn also little changed at 1.03x (versus 0.95x)
Q4 profit & loss
Date      Company          Event       Period Pretax profit (£m)     PBT               EBIT margins         Orders            DPS       DPS cover (x)
                                       ending Old        New         % chge            Old (%)    New (%) % chge              % chge    Old        New
 07-Dec   Abbey (Euro)*    Half Year     31-Oct       23          24                 2       25.9      21.6    -                  1,038      11.1      1.0
 07-Dec   Abbey (GBP)*     Half Year     31-Oct       21          21
 16-Oct   Bellway          Full Year      31-Jul     561         641                14        22.3        22.1           8          17            3.0   3.0
 07-Dec   Berkeley*        Half Year     31-Oct      511         401               -22        29.7        24.3      -                7            3.0   2.3
 21-Nov   Countryside      Full Year     30-Sep      155         201                30        16.1        17.2          -11         29            3.2   3.1
 13-Nov   McCarthy & St.   Full Year    31-Aug        94          62               -34        14.6        10.1           -4          0            2.6   1.7
 27-Nov   Telford*         Half Year     30-Sep        9          10                16        10.2         8.6      -                6            1.2   1.3

TOTAL (£m)                                              1350        1336
Individual average change (%) / cover (x)                                            1                                   -2         12            2.6   2.3
Sector average change (%) / cover (x)                                               -1                                              12            3.0   2.6
Individual average margin (%)                                                                 19.8        17.3
Sector average margin (%)                                                                     22.3        20.3
                                                                           8.07788582
Notes:
(i) Pretax profit numbers are are net of exceptionals and subject to adjustments where required
(ii) EBIT is Earnings Before Interest and Tax; DPS is dividend per share
(iii) Abbey is Irish-domiciled but only GBP included in totals; 100 cents special DPS announced in H1 - DPS increase/cover excluded from totals
(iv) Bellway metrics are ex-£5.9m Grenfell exceptional
(v) Berkeley's revenue and profit from sale of ground rent is excluded: 2018: nil (H1 2017 £28.4m); special DPS of £10.34 paid to date
(vi) Telford's revenue (and profit) are gross of its share JVs in H1 2017-18: £10.9m (£1.5m); and H1 2016-17: £12.7 (£1.6m)
Q4 balance sheets
Date Company Event Period Net Assets (£m) Net (Debt)/Cash (£m) Gearing Gearing ROCE^ ROCE^ Capital
ending Old New Old New Old % New % Old % New % Turn (x)
07-Dec Abbey (Euro)* Half Year 31-Oct 315 356 90 95 -28 -27 14.8 13.4 0.6
07-Dec Abbey (GBP)* Half Year 31-Oct 277 316 79 84
16-Oct Bellway Full Year 31-Jul 2,191 2,557 16 99 -1 -4 25.7 25.5 1.2
07-Dec Berkeley* Half Year 31-Oct 2,352 2,671 633 860 -27 -32 35.4 26.3 1.2
21-Nov Countryside Full Year 30-Sep 631 624 77 45 -12 -7 26.1 33.5 1.9
13-Nov McCarthy & St. Full Year 31-Aug 676 696 33 6 -5 -1 14.1 9.0 0.9
27-Nov Telford* Half Year 30-Sep 206 235 -61 -123 29 52 6.7 5.8 0.3
TOTAL (GBP) 6,333 7,099 777 970
Individual average change (%) 13
Sector average change (%) 12
Individual average ROCE (%) adjusted 20.5 18.9 1.0
Sector average ROCE (%) adjusted 25.9 23.4 0.9
Individual average gearing (%) -7 -3
Sector average gearing (%) -12 -14
Notes:
^ ROCE is return on capital employed; and adjusted where required for half year etc.Outlook There were almost daily communications from the Sector in Q4, including six sets of results; and here we have focused on the season’s forward looking statements Bellway (15 October - Finals): it started the current financial year i.e. on 1 August with an order book of 4,841 units and a value of £1.301 billion, which represented respective gains of 1.9% and +0.4% year-on-year. However, at 30 September, the unit order book was at 5,380 which is up 6.9% annualised and £1.47 billion which is up 7.9%. This means that in the first nine weeks of fiscal 2019-20, it has increased its order book by 89% in terms of units and 158% in value. Extraordinary (and we checked with the Company). “The level of uncertainty with which we have to cope, continues to rise. By this time next year the UK will likely be outside of the EU and facing a higher risk premium…..”
Sector revenue (£m) and EBIT margin (%) - reported in Q4 2018
                                  - average individual margin -

6,900
                                                                  20.0

6,700
                                                                  18.0
6,500

6,300                                                             16.0

6,100
                                                                  14.0

5,900
                                                                  12.0
5,700

5,500                                                             10.0
              Previous                                  Latest

                         Rev. (lhs)      Margin (rhs)
Outlook 2 Crest (17 October - Trading Update) announced a Trading Update a month or so ahead of schedule; and it was not good news. Due to a difficult market in London and the South (at higher prices points), profit before tax for the year will fall from £207 million to £170 to 190 million. CFO Robert Allen has departed too. Barratt (18 October - AGM): its cash order book at 14 October was up 12.4% at £3.15 billion and 5.1% by volume to 12,903 units. Okay, the value of private orders was actually down 5.3% at £1.7 billion whilst affordable was up 45% at just over £1 billion; and not forgetting JVs where the cash gain was also over 40% at £424 million The data on average selling prices tell a similar story: in the private sector minus 7.5% at £312,000; affordable +31% at £155,000; and JVs +60% at £504,000
Individual EBIT profit margins (%) reported in Q4 2018
                            * denotes interim results

BKG*

 BWY

ABBY*
                                                                          Latest
 CSP
                                                                          Previous

 MCS

 TEF*

    0.0    5.0       10.0        15.0            20.0   25.0       30.0
Outlook 3 Watkin Jones (31 October - Trading Update): with apologies to the late, great Carwyn James: “some sniff the wind of earnings visibility - they created it” i.e. the Group (also Welsh in origins) has already forward sold five of the six student accommodation schemes (and 2,646 beds) scheduled for delivery in fiscal 2019 (Watkin Jones is a September year- end). And, then in fiscal 2020 four (1,844 beds) from seven schemes are forward sold. What’s more the balancing schemes in each year (i.e. four) are also “secured” Persimmon (7 November - Trading Statement): private sales in the period since the reporting of its H1 results on 21 August 2018 increased 3% from a Group outlet network some 5% larger. “We are now fully sold up for the current year and have circa £987 million of forward sales reserved beyond 2018, an increase of 9% on the same point last year”; and prices “remain firm”.
Earnings growth (%) reported in Q4 2018

 CSP

 TEF*

 BWY

ABBY*

BKG*

 MCS

    -40.0   -30.0      -20.0      -10.0     0.0       10.0    20.0   30.0
Outlook 4 Redrow (7 November - AGM): the value of net private reservations in the 18 weeks to 3 November was in line with last year at £588 million (2018: £586 million). And “our total order book remains very healthy at £1.2 billion, an 11% increase on this time last year” Taylor Wimpey (13 November - Trading Statement): the physical order book was 11.8% ahead at 9,783 homes and in Pound Notes +8.3% at around £2.4 billion. However, “we expect next year’s volume to be broadly flat” McCarthy & Stone (14 November - Finals): new CEO John Tonkiss underlined what had been a challenging year for the Group to 31 August. He also reported a forward order book as at 9 November 4% or so behind the prior year at circa £267 million reflecting four sales releases since 1 September (in the fiscal year 2017, there were 17 sales releases)
Dividend per share reported in Q4: % increase
             - *denotes interim results; MCS is at zero; Abbey with special DPS excluded -

30.0

25.0

20.0

15.0

10.0

 5.0

 0.0
       MCS                  TEF*                   BKG*                    BWY               CSP
Outlook 5 Countryside (21 November - Finals) is celebrating the 60th anniversary of its founding by the late, great (and nice guy) Alan Cherry CBE. He died in 2010 aged 76. For good measure, too, its forward order book is up an astonishing 40% to £900 million. However, it burgeoning partnership business is where the action is - and its private unit forward order book is actually off 11.3% at £215 million Telford (28 November - Interims): in early October, the nimble and diminutive London developer reiterated its original target of exceeding £50 million pretax profit for fiscal 2019 (2018: £46.3 million). However, it is now plumping for “in excess of £40 million”. Looking further out, though, it has a development pipeline of £1.65 billion of future revenue comprising just over 5,000 units
Cover in Q4: av. = 2.3x after a 12% net increase
                               - Abbey is excluded -

CSP

BWY

BKG*

MCS

TEF*

   0.0   0.5          1.0        1.5            2.0    2.5        3.0   3.5
Outlook 6 Berkeley (7 December - Interims): the Group raised pretax profit guidance for the current year (to 30 April 2019) by 5% i.e. from minus 30 to minus 25%. It also said that the short- term outlook is “clearly uncertain” but it remains confident further out, especially about London i.e. it has already committed to generating £3.375 billion of pretax profit in the fiscal years 2017 through 2021 inclusive. Abbey (7 December - Interims): “whilst our UK forward sales position gives confidence that a reasonable result for the year will be achieved the continuing uncertain external conditions are cause for concern. The Group will continue to progress all its activities but intends to be cautious about new investments in the months ahead”. That said it did pay a 100 cent special dividend
Outlook 7: first of 2019 Gleeson (7 January - Trading Update): “the low-cost housebuilder and strategic land specialist” said it sold 691 in H1 (to end December) which is an increase of 16.5% “We continue to see strong demand for our low-cost homes, supporting both increased build activity on existing sites and the opening of new sites” “Our target market remains strong and our customers have maintained their confidence. We do not see any signs of customer caution” The Board expects the Group’s H1 results to be significantly ahead of those of the previous first half year and for the full year to 30 June 2019 “at least in line with expectations” Mr Dury would say they were “lighting up the chalice”
Latest reported Capital Turn (x) in Q4 2018
         Capital Turn = revenue divided by capital employed; *denotes interim results (annualised data)

2.5

2.0

1.5
                                                                                                          Actual
                                                                                                          Average
1.0

0.5

0.0
      TEF*          ABBY*             MCS              BWY              BKG*             CSP
Economics corner 1 GDP in the UK grew by 0.4% in the three months to October 2018 driven mainly by the services sector, although the production and construction sectors (+2.2%) were also positive contributors - including housebuilding. Consensus forecasts for 2019 and 2010 are in a band from 1 to 2% CPI was 2.3% in November 2018, down from 2.4% in October 2018; and 3.1% in November last year Unemployment was still an extraordinary 4.1% in the October quarter and down from 4.3% a year ago. Note, too, that regular pay in nominal terms rose 3.3% in the October quarter of 2018 on an annualised basis and it has not been higher since September to November 2008 Retail Sales in November rose 1.4% against October and by 3.3% year-on-year by volume bolstered by non-food
Economics corner 2
UK Finance: the number of mortgages approved by British
high street banks flattened in November, with the first year-
on-year rise since September 2017 i.e. 39,403 mortgages for
house purchase were approved in November on a seasonally
adjusted basis, down 0.6% from October but up 0.2% from
November 2017.
Bank of England: in November mortgage approvals fell
4.5% to 63,728 against October. On an annualised basis
though, November 2018’s tally was just 1.7% shy of
November 2017
Experian* says that Private Housing Output is forecast to
rise 3% this year and by 4% in 2020; at the same time, the
much-smaller Public Sector is set for +3% and +6% this
year and next
*where Building Value is an advisorHouse price corner Nationwide: house prices rose 0.5% in 2018 and the its conditional forecast for this year is a low single digits Rightmove says that UK house prices in 2019 are likely to be flat with London and environs dipping and the North rising Halifax: 2019 forecast of +2 to 4% (and options open) Reuters Housing Market Poll (which includes Building Value) expects median house prices inflation of 1.8% this year and 2.0% un 2020 Others in 2019: Hometrack (+3%); RICS (no change); Capital Economic (+1%); and mortgage broker Coreco (+1 to 2%)
Reason 1 “The juice of carrot, the smile of a parrot, a little drop of claret” are three more things to be cheerful about according to Mr Dury The eponymous single (remember those?) reached number three (oddly enough) in 1979 which was a busy year for the boy; and a peak. In 1982, he disbanded the wonderfully monikered ‘The Blockheads’ and a fitful solo career ensued Housebuilding’s peak year was 2017 with a 43% annualised rise in stock market value and a peak of £44.3 billion on 24 October 2017 Remember, too, it had bottomed out on 7 July 2008 at £3.1 billion amid the cacophony of the Global Financial Crisis (GFC); and in its unmelodic denouement, the listed UK Housebuilders reinvented themselves
Reason 2 Germane to this reinvention was £5.3 billion of provisions taken in 2008-10 i.e. 41% of pre-crisis NAV; and £1.7 billion of new cash raised shareholders Empiricism prevailed and the industry is wiser, ungeared and better managed (i.e. it eschews dodgy recording contracts) By example check the six companies which reported results in Q4, only one (Telford) has any net debt at all - and Berkeley is sitting on £860 million of net cash (up from £633 million) which tells its own story At the same time munificent dividends are being paid, with a number of double digit yields available Using Berkeley, again, it has given guidance on a 25% fall in pretax profit in the 12 months to 30 April 2019; and yet its share price fell only 17% last year in a Sector off 27%
Reason 3 A lot of red ink was spilled in 2018, but December turned (+1%) as did the nine trading days of the Christmas holidays (+2.2%) and the opening four of 2019 (+3.2%) Including Berkeley, too, the consensus on Sector earnings growth is flat this year with +5% in 2020; in a yield hungry World, too, check out 7% plus available from dividends There is life after a little death; and we hope that the plain old Brexit Big Bopper struts his stuff (if not, it will be platinum record buying opportunity) But, yes, 2019’s path will undulate Note, too, that the number of first time buyers with mortgages soared in 2018 to 367,038 - which is double 2008’s tally and just 6% off their 2006 all-time peak; and further growth is expected
Reason 4 (okay, there’s an extra one) And, on Boxing Day it was reported, by Rightmove, that 40 million homes were viewed on line Similarly on 7 January, Gleeson said profits were soaring and “we do not see any signs of customer caution” Ian Dury once said: “all I want for my birthday is another birthday”; the industry will have one too
“What I wanted to do was to paint sunlight on the side of a house”
                        - Edward Hopper -
Legend Name Ticker Value (£m) Price (p) 52 w eek low (p) 52 w eek high (p) Abbey ABBY 300 1400.00 1400.00 1620.00 Barratt Developments BDEV 4694 462.80 430.00 640.30 Bellway BWY 3095 2515.00 2407.00 3700.00 Berkeley Group BKG 4488 3479.00 3170.00 4338.00 Bovis BVS 1162 861.80 818.60 1259.89 Cairn Homes CRN 844 107.00 103.00 200.00 Countryside CSP 1370 304.40 265.60 387.00 Crest Nicholson CRST 843 328.20 275.00 565.00 Gleeson GLE 352 644.00 600.00 830.00 Glenveagh GLV 619 0.71 0.65 126.00 Inland Homes INL 107 52.00 47.30 73.60 McCarthy & Stone MCS 745 138.70 96.05 161.00 Persimmon PSN 6129 1930.00 1825.50 2913.00 Redrow RDW 1817 491.40 455.80 666.00 Springfield Properties SPR 100 104.00 104.00 139.00 Taylor Wimpey TW 4464 136.25 127.80 200.95 Telford Homes TEF 216 285.00 267.00 474.50 Wakin Jones Group WJG 525 205.50 173.00 232.00 Itallics denotes Euros (i) CPI = Consumer Price Index; RONA = Return on Net Assets (ii) REIS / REIT = Real Estate Investment & Services / R E Investment Trusts; (iii) Share prices are at 31/12/2018 and sourced from Bloomberg and Yahoo Financial UK; (iv) Adjustments have been made to share prices, where appropriate; (v) Selected stock s are excluded from charts and Sector averages; and (vi) Other adjustments have been made to reported numbers and metrics.
Disclaimer
   Copyright 2019 Building Value Ltd (BVL). The information herein was
obtained from various sources; we do not guarantee its accuracy or completeness.
  Neither the information nor any opinion expressed constitutes an offer, or an
   invitation to make an offer, to buy or sell any securities or related products.
Similarly, neither BVL nor any of its directors, agents or employees makes (or
 is authorised to make) any representation or warranty (express or implied) or
  shall have any responsibility or liability in respect of any of the information
contained herein. You must make your own independent assessment and rely on
                  your own judgment in reaching any conclusion.
the independent strategic advisor to the building,
construction, real estate & support services sectors
Contact: Tony Williams
Telephone: +44 (0) 7810 883 145
awilliams@buildingvalueltd.com
www.buildingvalueltd.comYou can also read