Pipelines 2018 - Transnet
←
→
Page content transcription
If your browser does not render page correctly, please read the page content below
A
        A

U       D

            Pipelines 2018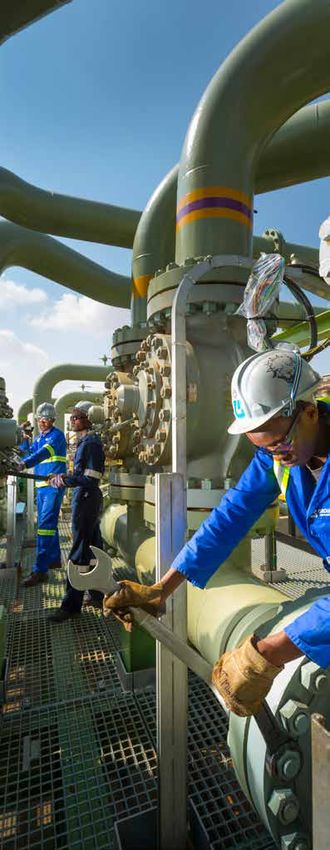
TRANSNET Pipelines          2

Highlights
• Revenue of R4,1 billion, excluding clawback and levy
• A 1,43% increase in petroleum allowable revenue
• EBITDA margin of 71%
• Operationalisation of the Coastal Terminal (TM1) tightlining
  solution that enabled multi-product operation of the 24” Multi
  Product Pipeline (MPP)
• Operationalisation of the Inland Terminal (TM2) which provides
  for an inland accumulation facility of 180 million litres
• Achieved a disabling injury frequency rate DIFR of 0,09
  (target: 0,68)
• Maintenance of service delivery levels to customers

Business overview
Transnet Pipelines (Pipelines) is the largest multi-product operator
in southern Africa, transporting hydrocarbons and methane-rich
gas through a network of 3 800 km of pipeline infrastructure.
Pipelines offers fully integrated supply chain solutions from
source to destination while ensuring the best safety practices and
optimum service reliability, and exceeding customer expectations
through the division’s proficient human capital.

To this effect, Pipelines currently transports:
• More than 65% of all refined products to the inland market;
• More than 70% of all jet fuel required at OR Tambo International
  Airport;
• 100% of the crude requirements for the Natref Refinery;
• 100% of the methane-rich gas requirements to KwaZulu-Natal
  for Sasol Energy and its gas clients; and
• 100% of Tarlton’s volumes, of which 60% is distributed
  cross-border.

The initiative to secure a direct import terminal in the port of
Durban and a Terminal Operating Licence has become a key
strategic objective for Pipelines, in alignment with the Transnet
Liquid Fuels Master Plan to enable:
• New market participants in line with the charter expectations,
  which emphasises the promotion of broad-based black economic
  empowerment and overall sector transformation; and
• The Department of Energy’s Clean Fuels II Programme, which will
  necessitate increased import terminals due to changes in fuel
  specifications in the short to medium term.

The MPP 24” trunkline is in full multi-product operation,
transporting two diesel grades and two unleaded petrol grades as
well as jet fuel. The inland accumulation facility was
operationalised in December 2017 and will further facilitate
security of supply to the market.

A seamless integrated rail and pipeline service offering is currently
in operation to OR Tambo International Airport, and other routes
are being considered and optimised in this regard.

The Regional Integration Strategy’s primary objective is to grow
beyond South Africa’s borders, thereby repositioning Pipelines to
be a liquid and gas operator of choice across Africa. The business
diversification ambition also places emphasis on revenue streams
that are non-regulated. Opportunities to diversify into the
liquefied natural gas (LNG) market are also being pursued.
TRANSNET Pipelines 3
Transnet Corporate Centre
Johannesburg
Pipeline
LIMPOPO
Key
Refined products
Pretoria West
Waltloo MPUMALANGA Crude oil
Rustenburg
Witbank
Kendal
Tarlton
Airport
Gas
Langlaagte Alrode
GAUTENG
ORTH Park
Secunda
Avtur
WEST Klerksdorp Sasolburg Coalbrook
Standerton
NMPP pipelines
Volksrust
Kroonstad Vryheid
Newcastle
en Bethlehem
Van Reenen LIMPOPO
FREE STATE Ladysmith
Empangeni
NORTH GAUTENG MPUMALANGA
KWAZULU-
WEST
Richards Bay
NATAL Sishen
FREE STATE
KWAZULU-
NATAL
LESOTHO
LESOTHO
NORTHERN CAPE
Durban
EASTERN CAPE
INDIAN OCEAN
WESTERN
CAPE
Figure 1: Petroleum and gas pipeline network
Regulatory
EASTERNenvironment
CAPE Performance context
Pipelines is regulated by the National Energy Regulator of South Pipelines creates value by fulfilling a strategic role in the South
Africa (Nersa) and governed by the Petroleum Pipelines Act, No 60
of 2003 and the Gas Act, No 48 of 2001.
INDIAN OCEAN African logistical fuel supply chain by making pipeline capacity
available ahead of demand, thereby facilitating the supply of
product to the inland market.
On 31 October 2017, Pipelines filed its 2019 and 2020 Petroleum
East
Pipelines System multi-year tariff applications requesting In the 2018 financial year Pipelines operationalised the inland
Ngqura London
R5,7 billion and R6,2 billion allowable revenue respectively, which
translated into a 36% and 10% increase in allowable revenue
accumulation facility (TM2) located in Heidelberg and the Coastal
Terminal (TM1) tightlining solution. The operationalisation of the
respectively. This increase is attributed to: tightlining solution enabled the introduction of multi products into
• Transnet bringing its tightlining assets at Island View Terminal in the 24” MPP. TM2 has provided Pipelines with about 180 million
y Port
Durban (TM1) and its assets at the Inland Terminal (TM2) into litres of accumulation facility, creating a necessary buffer in the
Elizabeth
operation; and pipeline system to ensure that the division will be able to continue
• The anticipated clawback adjustment due to the timing or date to operate and supply product into the market even if there are
at which these assets were admitted into the regulatory asset product supply interruptions at the coast. The commissioning of
base. the 24” MPP to multi product allowed Pipelines to retire the Durban
to Kroonstad section of the Durban to Johannesburg Pipeline (DJP),
On 15 March 2018, Nersa set the tariffs for the 2019 financial year thus eliminating the risk of failure of this pipeline.
only, i.e. a single-year application. Nersa set the Petroleum
Pipelines System tariffs that will allow Transnet to realise a 26%
increase in allowable revenue compared to the 2018 tariff period.TRANSNET Pipelines 4
Operational performance
Core initiatives for 2018
• Execute capital expenditure of R1,5 billion, inclusive of NMPP. • Achieve the petroleum volume of 17,345 billion litres.
• Ensure financial performance targets are achieved in a • Maintain and improve key operational efficiencies.
challenging economic environment. • Achieved a gas volume throughput of 489 million m3.
Overview of key performance indicators
2017 2018 2018 2019
Key performance area and indicator Unit of measure Actual Target Actual Target
Financial sustainability
EBITDA margin % 77,5 71,5 71,1 78,3
Operating profit margin % 57,3 50,9 48,3 57,7
Gearing % 41,0 41,1 38,3 32,3
Net debt to EBITDA times 3,8 4,9 3,9 2,2
Return on average total assets – excluding CWIP % 10,7 6,3 7,0 8,8
Asset turnover –excluding CWIP times 0,2 0,1 0,1 0,15
Cash interest cover times 2,6 1,9 2,7 4,0
Capacity creation and maintenance
Infrastructure and maintenance
Capital expenditure R million 1 706 2 216 1 544 1 338
Actual vs planned maintenance % 95 n/a n/a n/a
Production interruptions hours 249 438 371 438
Operational excellence
Capacity utilisation (actual usage: capacity)
DJP and MPP Mℓ/week 116:152 118:148 115:148 128:148
Crude Mℓ/week 98:134 94:134 87:134 94:134
Avtur Mℓ/week 22:24 20:24 20:24 20:24
Gas (actual usage: capacity) million m3 /month 50:57 51:57 40:57 42:57
Operating cost per Mℓ.km (a) R/Mℓ.km 119 151 135 168
Electricity efficiency Mℓ.km/MWh (year-on-year
percentage improvement) (0,4) n/a n/a n/a
Service delivery
litres per billion litres
“Off spec” volumes delivered 253 022 97 330 162 519 228 271
Number “off spec” delivery events
per thousand dockets number 0,3 0,3 0,4 0,3
Ordered vs delivered volume % 96 95 93 95
Planned vs actual delivery time % 86 88 86 88
Market segment competitiveness
Volume and revenue growth
Total petroleum products Mℓ 16 978 17 564 16 345 17 516
Refined Mℓ 10 563 11 617 10 678 11 476
Crude Mℓ 5 254 4 910 4 534 4 970
Avtur Mℓ 1 161 1 037 1 133 1 130
Gas million m3 595 574 489 506
Storage Mℓ 415 511 315 338
Sustainable developmental outcomes
Human capital
Training spend % of personnel cost 3,3 3,5 3,0
Employee headcount number 642 701 639 684
Employment equity % of black employees 88 n/a n/a n/a
Female employees % of headcount 33 n/a n/a n/a
People with disabilities % of headcount 3,0 n/a n/a n/a
Employee turnover % 4,8 n/a n/a n/a
Absenteeism index % 1,7 n/a n/a n/a
Risk, safety and health
DIFR rate 0,37 0,68 0,09 0,65TRANSNET Pipelines 5
Financial performance review
Year ended Year ended
31 March 31 March
2018 2017 %
Salient features R million R million change
Revenue 4 488 4 355 3,1
– Refined 2 502 2 411 3,8
– Aviation fuel 66 50 32,0
– Crude 1 445 1 660 (13,0)
– Gas 96 120 (20,0)
– Handling 19 27 (29,6)
– Other (31) 16 (293,8)
– Clawback and Levy 391 71 450,7
Operating expenses (1 296) (978) (32,5)
– Energy costs (264) (255) (3,5)
– Maintenance (98) (100) 2,0
– Materials (305) (8) (3 712,5)
– Personnel costs (427) (394) (8,4)
– Other costs (202) (221) 8,6
Profit from operations before depreciation, derecognition,
amortisation and items listed below (EBITDA) 3 192 3 377 (5,5)
Depreciation, derecognition and amortisation (1 026) (883) (16,2)
Profit from operations before items listed below 2 166 2 494 (13,2)
Impairments and fair value adjustments (20) (63) 68,3
Net finance costs (233) 373 (37,5)
Profit before taxation 1 913 2 804 (31,8)
Total assets (excluding CWIP) 38 000 23 174 64,0
Profitability measures
EBITDA margin1 % 71,1 77,5 (6,4)
Operating margin2 % 48,3 57,3 (9,0)
Return on average total assets (excluding CWIP)3 % 7,04 10,6 (3,6)
Asset turnover (excluding CWIP)4 times 0,15 0,19 (21,1)
Capital investments5 R million 1 544 1 706 (9,5)
Employees
Number of employees (permanent) number 639 642 (0,5)
Revenue per employee Rand million 7,02 6,78 3,5
1
EBITDA expressed as a percentage of revenue.
2
Profit from operations before impairment of assets, fair value adjustments, net finance costs and taxation expressed as a percentage of revenue.
3
Profit from operations before impairment of assets, fair value adjustments, net finance costs and taxation expressed as a percentage of average total assets,
excluding capital work-in-progress (CWIP).
4
Revenue divided by average total assets, excluding CWIP.
5
Actual capital expenditure (replacement plus expansion), excluding borrowing costs and including capitalised finance leases.
Performance commentary (excluding the inventory write off) is R3,5 billion, a 3% increase
from the prior year.
Financial sustainability • Return on total average assets (ROTA) decreased to 7,0%
(2017: 10,6%). This is mainly due to the capitalisation of the
• Revenue, including clawback and levy, increased by 3,1% to TM1 tightlining solution and TM2 terminal.
R4,5 billion (2017: R4,4 billion). This is mainly due to the 1,43%
• Revenue per employee increased by 3,5% to R7,0 million
increase in petroleum allowable revenue granted by Nersa in its
(2017: R6,8 million).
2018 Tariff Determination, the favourable distribution pattern
from the coast and the unwinding of clawback raised in the
previous financial year. Looking ahead
• Net operating expenses increased by 32,5% to R1,3 billion
• Pipelines intends to minimise the impact of the 2019 petroleum
(2017: R978 million). The increase is mainly attributable to a write
determination on EBITDA and other key financial ratios.
off of inventory of approximately R297 million. The increase in net
operating costs (excluding the inventory write off) is 3,3%. • Pipelines plans to engage with Nersa on the prudency assessment
criteria to be applied on the MPP project.
• EBITDA, including clawback and levy, of R3,2 billion is 5,5% lower
compared to the previous year (2017: R3.4 billion). EBITDA • The division will persist with the Total and Sasol litigation resolution.
• Pipelines’ new business focus is on gas and terminal operations.TRANSNET Pipelines 6
Capacity creation and maintenance Gas volumes compared to the preceding year have decreased by
17,7% due to lower gas utilisation by clients, as a result of the
• The Operating Division’s spend on capital for the year was economic downturn.
R1,5 billion compared to a target of R2,2 billion. This is mainly
due to the revision of certain project activities.
• TM1 tightlining and TM2 were commissioned in mid-July and Looking ahead
mid-December 2017 respectively. The commissioning of the
• Achieve the set petroleum volume target of 17,516 billion litres.
tightlining enabled the 24” MPP trunkline to be used to transport
• Implement initiatives to increase volumes at Tarlton, including
multi products.
influencing Botswana supply mix and route alternatives.
• On 28 March 2018, the southern section of the DJP was shut
• Continue with Transnet Value Chain Coordinator initiative to
down, marking the commencement of the DJP decommissioning
ensure volumes are maximised for Transnet.
plan.
• Exploring opportunities in Richards Bay to diversify into the LNG
• The prefeasibility exercise for the PL5 (Sasolburg to Kroonstad
market.
pipeline) and PL6 (Jameson Park to OR Tambo International
Airport pipeline) commenced in the 2017/18 financial year and • Implement demand-planning for future NMPP expansion phases.
will continue in the 2018/19 financial year. • Terminal operations in Island View and Ambrose Park.
Looking ahead Operational excellence
• Transnet Pipelines will execute the following major projects in Capacity utilisation
the next financial year:
• Combined capacity utilisation for the 24” MPP and DJP (actual
–– Construction of the Sapref replacement tanks; usage: capacity) of 115:148 Mℓ per week (2017: 116:152 Mℓ per
–– Upgrade of the Fire Protection System at its various sites; and week) is lower than target as a result of lower volume
–– Control System Development and Crude Deployment. performance.
• Pipelines will finalise the business case for the Coastal Terminal • The Natref Refinery shutdown negatively impacted capacity
(TM1) accumulator tanks. utilisation of the crude line, while the utilisation of the avtur line
is in line with the target.
• The economic downturn impacted the utilisation of the gas line.
Market segment competitiveness
• Plans are in place to create capacity and ensure that current
Market conditions in the oil and gas industry are cyclical and capacity is maintained. These include construction of the
subject to global economic and political events as well as new and Terminal 2 to Airport dedicated Jet Line, replacement of the
changing government regulations. Sasolburg to Kroonstad DJP section of the line and completion
of the Terminal 1 accumulation tanks.
The South African economy, as well as the country’s level of
development, is heavily dependent on the availability of affordable
liquid fuels. Service delivery
• Pipelines has maintained the highest level of service delivery to
South Africa is a net importer of oil with at least 70% of the market its clients.
demand being met through either imported crude or imported
• Service delivery measures relating to ordered versus delivered
refined products. Fuels produced from indigenous sources satisfy
volumes and planned versus actual delivery times were 93% and
the balance of the demand.
85,8% respectively.
The major demand for fuels lies within the Durban – Gauteng • Pipelines’ operational cost per megalitre kilometre (Mℓ.km) of
corridor that consumes about 68% of the country’s fuel. R135 per Mℓ.km is lower than the target of R151 per Mℓ.km due to
cost management initiatives implemented during the year.
Although South Africa has traditionally met most of its fuel demand
through locally manufactured products (i.e. Sasol (Secunda), Natref, Looking ahead
Enref, Sapref, Chevref and PetroSA), it is now a net importer of fuel • Safely manage the decommissioning of the Durban to Kroonstad
and this will continue into the future until existing refineries are leg of the DJP.
upgraded or new refineries are built. • With the availability of Terminal 2 ensure that service delivery
performance is further improved.
The four key levers that impact fuel consumption are:
• Develop skills to handle the new assets and new energy
• Rand/Dollar exchange rate – as the Rand is under pressure, this opportunities such as gas.
negatively affects consumption;
• Price of crude oil – currently low, hence a decrease in fuel price
and hopefully increased demand; Human capital
• GDP growth rate – negative outlook and hence depressed • Pipelines achieved a permanent employee headcount of 639
demand; and (target: 701). The filling of vacancies was curtailed during the
• Disposable income – erosion of disposable income and a year due to the current economic environment.
negative impact on demand. • Black employees represented 89% of the total employee base
against a target of 80%.
The petroleum volumes transported for the period have decreased
• Female employees represented 33% of the total employee base
3,7% to 16,345 billion litres (2017: 16,978 billion litres). This
against a target of 40%.
relates predominantly to the lower market demand for refined
• People with disabilities represented 2,4% of the total employee
volumes due to depressed commodity prices and the economic
base against a target of 3%.
slowdown. Another factor that contributed to the lower volumes
was the impact of the Natref Refinery shutdown. • The employee turnover rate is 7,4% compared to a target of 5%.
• The Absenteeism Index of 1,6% is lower than the target of 2,5%.TRANSNET Pipelines 7
Organisational readiness • As part of sustainable initiatives, a green initiative at head
office’s main entrance wall, the 8th floor roof top, and the 9th
Skills development floor balcony has been completed successfully. Thus the
• Pipelines achieved a training spend of 3% compared to a target Pipelines head office building is among the few green buildings
of 3,2%. in the Johannesburg CDB. The 8th floor roof garden has created
little micro climates for an unusual diversity of plant species and
• The division will focus on:
for supporting other living organisms such as bees, dragonflies
–– Building a Gas Skills Framework in preparation for the new and butterflies. This ecosystem in the roof of the building is
business initiatives; viewed as a life support system for human beings and fauna
–– Designing mandatory customer centricity training for all directly or indirectly.
employees;
–– Mandatory Transnet 4.0 (Internet of Things) training for all
employees; and Social accountability
–– A People in Pipeline training programme. • Enterprise Development (ED) initiatives amounted to
R19,2 million for the year, including the following highlights:
Health and safety –– Pipelines entered into partnerships with third-party/conduit
ED companies to implement enterprise and supplier
• A DIFR of 0,09 was achieved for the year compared to a target development initiatives for the purpose of developing and
of 0,68. sustaining small, medium and micro enterprises (SMMEs) that
• Pipelines continues to implement the Transnet Integrated have the potential to become suppliers. The grant included
Management Approach and is aiming for certification on the funding for mentorship or skills development programmes for
safety system in the next financial year. approximately 100 black-owned qualifying small enterprises
(QSEs), exempted micro enterprises, as well as businesses
owned by black youth and people with disabilities.
Stakeholder engagement –– Enterprise and supplier development resources continued to
• Stakeholder engagement sessions were conducted on a regular focus on the needs of SMMEs within Transnet’s supply chain
basis, with the commissioning of the MPP into multi-product and provide them with support and early payment terms
mode and the inland terminal (TM2) being highlights of the year. (approximately 30 black-owned QSEs were supported).
• Servitude awareness was conducted along the entire pipeline –– Market Penetration Programme – Pipelines utilised its ED
network. partnerships (such as the Durban Chamber of Commerce and
• Corporate social investment projects focused on schools Bosch Ulwazi) to sponsor SMMEs with paid advertising space
adjacent to the pipelines. in their local and international publications (and publications
of their partner affiliates) as well as a 12-month membership
with the Durban Chamber of Commerce or sector-specific
Governance and ethics institutes; marketing material; and sponsorship of stands for
local and international trade shows held during the reporting
Environmental stewardship period. The division partnered with the Durban Chamber of
• Pipelines continued to implement a comprehensive Commerce for a tender readiness programme aimed at
Environmental Management System (EMS) based on the empowering 50 SMMEs in highly specialised sectors such as
ISO 14001 standard. Re-certification and transition to engineering, health and safety, construction, waste
ISO 14001:2015 standards were successful. management and professional services.
The following table details Pipeline’s top risks and key mitigating activities:
Key risks Mitigating activities
Material pay-out in terms of Natref’s neutrality • Quantification of the amount potentially payable
principle • Review of arguments against the validity of the letter agreement
Delay in the completion of the Sapref tanks as • Proactive management and monitoring of key milestone dates and activities as per
part of the NMPP project the execution schedule.
DJP Pipeline Integrity (Note) • Decommissioning plan in place
Negative financial impact of Nersa’s NMPP • Prudency operating model in place which includes a Prudency Subcommittee and
prudency review an integrated Prudency Assurance Team
Non-completion of the deferred NMPP scope • Proactive monitoring of critical milestones and activities to expedite the execution
by June 2019 of the deferred scope
• Expedite any interventions required to address slippage in terms of cost and
schedule to minimise the impact
Financial constraints resulting in the • Diversification of revenue to ensure non-reliance on commodity-related revenue
unaffordability of planned capex • Cost management initiatives
• Pipeline’s funding framework aligned to Group’s initiatives
DJP Pipeline Failure (Note) • Decommissioning plan in place
Non-completion of the TM1 accumulator tanks • Review the demand forecast to determine when the tanks are due
in time to meet demand • Timeous compilation and approval of business case for the tanksTRANSNET Pipelines 8 Opportunities Gas Exploring opportunities to diversify into the LNG market Terminal • Creating import capability for new users at Island View, Durban • Terminal operations at Island View and Ambrose Park, Durban Pipelines • Feasibility study – new jet pipeline from Chevref or from Port to Cape Town International Airport • Feasibility study – new pipeline from South Africa to Botswana • Investigating alternative uses of the DJP after its decommissioning from petroleum product use Africa • Via Transnet International Holdings (TIH), Pipelines will focus on the success of the Africa strategy. The division intends to grow the non-regulated business by sharing skills, knowledge, pipeline training, and operational services with other African pipeline companies in the Southern African Development Community (SADC), including Kenya. • Review potential gas and fuel pipelines in the SADC region and, when projects realised, submit Expression of Interest to gain first mover advantage. • Focus on efficient supply chain to Botswana. Integration of Transnet business units • Intermodal integration of Freight Rail and Pipelines service offering for liquid fuel.
www.transnet.net
You can also read