U.S. FOMC : ON THE CUSP OF MONETARY POLICY NORMALISATION - ECONOMIC RESEARCH 17 JUNE 2021 - Bank ...

 
CONTINUE READING
U.S. FOMC : ON THE CUSP OF MONETARY POLICY NORMALISATION - ECONOMIC RESEARCH 17 JUNE 2021 - Bank ...
U.S. FOMC : ON THE CUSP OF MONETARY
        POLICY NORMALISATION
                    17 JUNE 2021
           ECONOMIC RESEARCH

           DR. MOHD AFZANIZAM ABDUL RASHID
                ADAM MOHAMED RAHIM
                 SHAFIZ BIN JAMALUDDIN
                 NOR JANNAH ABDULLAH
               RAJA ADIBAH RAJA HASNAN

                                             Strictly Private & Confidential
U.S. FOMC : ON THE CUSP OF MONETARY POLICY NORMALISATION - ECONOMIC RESEARCH 17 JUNE 2021 - Bank ...
THE FOMC DECIDED TO REMAIN STATUS QUO…FOR NOW

✓    The Federal Open Market Committee (FOMC) decided to keep the Federal Fund Rate (FFR) range at 0.00%-
     0.25% and maintained its asset purchases at USD120.0 billion during its 15-16 June meeting.
✓    The US continued to record upbeat economic data mainly supported by rising vaccinations which have
     successfully reduced the impact on public health accompanied by strong policy support. The sectors most
     adversely affected by the pandemic remained weak but have shown improvement.
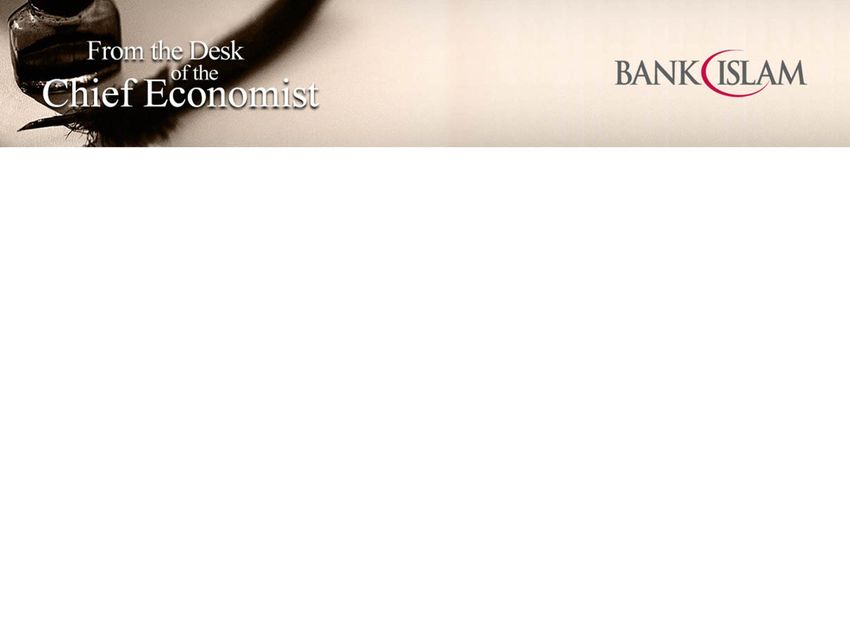
✓    In light of this, the FOMC’s median forecast for 2021 Gross Domestic Product (GDP) growth was revised up to
     7.0% (from the 6.5% projection made in March) before moderating by 3.3% in 2022 and 2.4% in 2023.
✓    Similarly, the US Federal Reserve (Fed) projected that the labour market would continue to improve, although
     the pace of improvement has been uneven. The median projection for the Unemployment Rate (UR) stood at
     4.5% at the end of 2021 before falling to 3.8% in 2022 and 3.5% in 2023.
✓    In addition, the FOMC lifted its projections for PCE inflation to 3.4% this year (from 2.4% made in March) and
     softening by 2.1% in 2022. The revision partly due to a very low base effect last year, as well as the pass-through
     effect from oil prices to consumer energy prices. However, the supply bottleneck effect on inflation has been
     larger than anticipated amid reopening of the economy which has bolstered demand while hiring difficulties
     could continue to limit how quickly supply can adjust to the unprecedented rise in demand.
✓    Against such backdrop, the Federal Fund Rate (FFR) is expected to rise to 0.6% in 2023 (Previous forecast: 0.1%),
     signaling that the normalization of monetary would take place at some point in the future.
✓    Certain conditions have to be met in order to increase the FFR. Among them is the inflation rate which has to be
     sustained at more than 2% for a protracted period.
     The FOMC’s Economic Projections

    Source: US Federal Reserve                                                                                 Page 2
ECONOMIC RESEARCH
U.S. FOMC : ON THE CUSP OF MONETARY POLICY NORMALISATION - ECONOMIC RESEARCH 17 JUNE 2021 - Bank ...
OVERNIGHT POLICY RATE (OPR) VS. FEDERAL FUND RATE (FFR)

   6.00

   5.00

   4.00

   3.00                                                                                      1.75

   2.00

   1.00

   0.00

  -1.00                                                                                      0.25

  -2.00

  -3.00

                             Federal Fund Rate   Spread     Overnight Policy Rate

  Source: CEIC
✓ At the current juncture, the difference between Malaysia’s OPR and FFR stood at 150 basis points
  (bps) (1.75% minus 0.25%).
✓ This would mean Bank Negara Malaysia (BNM) would has room for a possible OPR reduction if
  such decision would be entirely based on the interest rate differentials with the US Fed.
✓ Assuming that the Fed is likely to normalize its benchmark rate to 2.50% (long run FFR), the OPR
  could reach 3.50% in order to maintain a reasonable spread with the FFR.
✓ In light of the current economic shocks which have exacerbated the extent of income and
  wealth disparity, extremely tight monetary stance may not be favourable . This could impede
  investment activities which is necessary to uplift Malaysia’s GDP potential.

ECONOMIC RESEARCH                                                                               Page 3
CENTRAL BANK POLICY RATES

Policy rates                        Jun-20   Jul-20 Aug-20 Sep-20 Oct-20 Nov-20 Dec-20 Jan-21 Feb-21 Mar-21 Apr-21 May-21 Jun-21*
Advanced countries
US (Fed Fund Rate)                    0.25    0.25    0.25    0.25    0.25    0.25    0.25    0.25    0.25    0.25    0.25    0.25     0.25
Japan (Policy Balance Rate)          -0.10   -0.10   -0.10   -0.10   -0.10   -0.10   -0.10   -0.10   -0.10   -0.10   -0.10   -0.10    -0.10
Euro Zone (Main Refinancing Rate)     0.00    0.00    0.00    0.00    0.00    0.00    0.00    0.00    0.00    0.00    0.00    0.00     0.00
UK (Bank Rate)                        0.10    0.10    0.10    0.10    0.10    0.10    0.10    0.10    0.10    0.10    0.10    0.10     0.10
Canada (ON Lending Rate)              0.25    0.25    0.25    0.25    0.25    0.25    0.25    0.25    0.25    0.25    0.25    0.25     0.25
Latin America
Mexico (ON Rate)                     5.00     5.00    4.50    4.25    4.25    4.25    4.25    4.25    4.00    4.00    4.00    4.00     4.00
Brazil (Selic Rate)                  2.25     2.25    2.00    2.00    2.00    2.00    2.00    2.00    2.00    2.75    2.75    3.50     4.25
Argentina (LELIQ 7D Notes Rate)     38.00    38.00   38.00   38.00   36.00   38.00   38.00   38.00   38.00   38.00   38.00   38.00    38.00
Eastern Europe
Russia (Key Rate)                    4.50     4.25   4.25     4.25    4.25    4.25    4.25    4.25    4.25    4.50    5.00    5.00     5.50
Ukraine (Discount Rate)              6.00     6.00   6.00     6.00    6.00    6.00    6.00    6.00    6.00    6.50    7.50    7.50     7.50
Turkey (1W Repo Rate)                8.25     8.25   8.25    10.25   10.25   15.00   17.00   17.00   17.00   19.00   19.00   19.00    19.00
Asia
China (1Y Loan Prime Rate)           3.85     3.85   3.85    3.85    3.85    3.85    3.85    3.85    3.85    3.85    3.85    3.85      3.85
India (Repo Rate)                    4.00     4.00   4.00    4.00    4.00    4.00    4.00    4.00    4.00    4.00    4.00    4.00      4.00
Indonesia (7D Repo Rate)             4.25     4.00   4.00    4.00    4.00    3.75    3.75    3.75    3.50    3.50    3.50    3.50      3.50
Thailand (1D Repo Rate)              0.50     0.50   0.50    0.50    0.50    0.50    0.50    0.50    0.50    0.50    0.50    0.50      0.50
South Korea (Base Rate)              0.50     0.50   0.50    0.50    0.50    0.50    0.50    0.50    0.50    0.50    0.50    0.50      0.50
Philippines (O/N Lending Rate)       2.25     2.25   2.25    2.25    2.25    2.00    2.00    2.00    2.00    2.00    2.00    2.00      2.00
Australia (Cash Rate)                0.25     0.25   0.25    0.25    0.25    0.10    0.10    0.10    0.10    0.10    0.10    0.10      0.10
New Zealand (Cash Rate)              0.25     0.25   0.25    0.25    0.25    0.25    0.25    0.25    0.25    0.25    0.25    0.25      0.25
Malaysia (OPR)                       2.00     1.75   1.75    1.75    1.75    1.75    1.75    1.75    1.75    1.75    1.75    1.75      1.75
* As at 16 June 2021
Source: Bloomberg
✓ Central banks across the globe particularly in Asia have decided to remain with their accommodative
  monetary policy stance as risks from the Covid-19 pandemic continue to linger.
✓ However, central banks in other parts of the world such as Brazil raised its benchmark interest rate by 75
  basis points (bps) from 3.50% to 4.25% on 16 June 2021, continuing to wind down its pandemic stimulus
  stance in the face of rising inflation in Latin America’s biggest economy. The annual inflation rate came
  in at 8.06% in May (April: 6.76%), well above the bank’s target range of 2.25% to 5.25%.

 ECONOMIC RESEARCH                                                                                                                   Page 4
HOW HAS THE FED’S DOT PLOTS EVOLVED IN THE LATEST
 MEETING?
✓ The Fed’s so-called dot plot, which the Fed uses to signal its outlook for the path of interest rates,
  continues to show that officials expect no change in policy this year.
✓ However, there has been a change in their tone regarding the target level of the FFR in 2022 and 2023.
✓ For example, the dot plot for the June 2021 FOMC meeting showed that 7 Fed officials expect higher
  interest rates in 2022 (compared to just 4 Fed officials during the March 2021 FOMC meeting) while 13 Fed
  officials are expecting a rate hike in 2023 (compared to just 7 Fed officials during the March 2021 FOMC
  meeting).
✓ Therefore, expectations among policy makers about a rate hike as early as next year is building up in line
  with the improving health of the US economy. Acceleration in the vaccination efforts are clearly the key
  deciding factor.

March 2021 FOMC                    June 2021 FOMC                ✓ There had also been initial discussions about
    Meeting                            Meeting                     when to pull back on the Fed's USD120.0 billion
                                                                   in monthly bond purchases, a conversation that
                                     13 Fed officials
                                                                   would be completed in coming months as the
     7 Fed officials
     expect a rate                   expect a rate                 economy continues to heal.
                                      hike in 2023
      hike in 2023
                                                                 ✓ As for now, the path of Covid-19 pandemic
                                   7 Fed officials
                                                                   continues to cloud the economic outlook while
 4 Fed officials
 expect a rate
                                   expect a rate                   new strains of the virus remain as the key
                                    hike in 2022
  hike in 2022                                                     downside risk.
                                                                 ✓ The Fed will continue to increase its holdings of
                                                                   Treasury securities by at least USD120.0 billion
                                                                   (USD80.0 billion of Treasury securities and
                                                                   USD40.0 billion of agency mortgage-backed
                                                                   securities) until substantial further progress has
                                                                   been made toward the Committee’s maximum
                                                                   employment and price stability goals.
Source: The US Federal Reserve Summary Of Economic Projections
 ECONOMIC RESEARCH                                                                                               Page 5
QUANTITATIVE EASING (QE) TAPERING – THE COMMITTEE STILL
CONTINUES TO ASSESS PROGRESS OF THE ECONOMY
Asset purchases following each policy meeting during                    Illustrative if FOMC were to adopt a similar tapering
the 2014 taper:                                                         pattern as in 2014:
            Date         Treasuries (USD Billion)   MBS (USD Billion)               Date       Treasuries (USD Billion)   MBS (USD Billion)
17-18 September 2013                45                    40            26-27 January 2021                80                    40
29-30 October 2013                  45                    40            16-17 March 2021                  80                    40
17-18 December 2013                 40                    35            27-28 April 2021                  80                    40
28-29 January 2014                  35                    30
                                                                        15-16 April 2021                  80                    40
19-20 March 2014                    30                    25
                                                                        27-28 July 2021                   80                    40
29-30 April 2014                    25                    20
                                                                        21-22 September 2021              80                    40
17-18 June 2014                     20                    15
29-30 July 2014                     15                    10            2-3 November 2021                 80                    40
16-17 September 2014                10                     5            14-15 December 2021               75                    35
28-29 October 2014                   0                     0            25-26 January 2022                70                    30
16-17 December 2014                  0                     0            15-16 March 2022                  65                    25
Source: FOMC statement                                                  3-4 May 2022                      60                    20
                                                                        14-15 June 2022                   55                    15
✓ The Fed is expected to announce the strategy for
  reducing its massive bond buying programme in August                  26-27 July 2022                   50                    10
  or September 2021 but would start to reduce the                       20-21 September 2022              45                     5
  monthly purchases in early 2022.*                                     1-2 November 2022                 40                     0
✓ To recall, the tapering of the Fed’s Third Round of Large-            13-14 December 2022               35                     0
  Scale Asset Purchases (2012–2014) was announced
                                                                        Source: FOMC statement
  during FOMC meeting in December 2013.
✓ At that time, the FOMC's asset purchases were at a                    ✓ If the Fed decided to reduce the pace of its asses
  pace of USD85.0 billion per month (USD45.0 billion for                  purchasing in December 2021 and adopt a similar
  Treasury securities and USD40.0 billion for mortgage-                   tapering pattern in 2014, we anticipate that the net
  backed securities (MBS)).                                               purchases of MBS would be concluded by the end of
✓ These purchases were reduced gradually to zero within                   2022 but net purchases of Treasury securities would still
  eight scheduled policy meetings, starting from                          be ongoing until 2023.
  December 2013 to October 2014 (about USD10.0 billion
  per month reduction after each meeting).
 *https://www.reuters.com/business/fed-announce-qe-taper-aug-or-sept-rising-inflation-concerns-2021-06-11/
 ECONOMIC RESEARCH                                                                                                                     Page 6
THE CASE FOR MONETARY POLICY NORMALISATION IS RISING AS
 LABOUR MARKET IS GRADUALLY IMPROVING
                           US IJC, '000                                         Nonfarm Payrolls, m-o-m changes ('000)
7,000                                                                 10,000
                                                      6,149
                                                                                                                   4,846
6,000                                                                  5,000
                                                                                                                                559
5,000                                                                      0

4,000                                                                  -5,000

3,000                                                                 -10,000

2,000                                                                 -15,000

1,000                                                                 -20,000                                       -20,679
                                                               376
   0                                                                  -25,000
  05-Jun-10    05-Mar-13      05-Dec-15   05-Sep-18       05-Jun-21         May-16    May-17   May-18   May-19   May-20       May-21

Sources: CEIC, US Department of Labor

 ✓ The number of Americans filing for the US unemployment benefits stood at 376k for the week
   ended 5 June, down by 9k from 385k in the previous week. This was the lowest number of claims
   since March last year, suggesting that the labour market continues to show signs of recovery.
 ✓ Broader economic reopening amid a declining trend of daily Covid-19 cases, as well as rapid
   vaccination programmes in the US have supported the labour market.
 ✓ Thus far, the US economy added 559k number of jobs in May from 278k previously with leisure
   and hospitality, public and private education, as well as health care and social assistance
   recording the biggest gains.
 ✓ As such, we can see that the unemployment rate in the US dropped to 5.8% in May (April: 6.1%),
   the lowest since April last year. The more reasons for the Fed to rethink their monetary stance.
 ECONOMIC RESEARCH                                                                                                         Page 7
MARKET REACTIONS

✓ Wall Street was jostled on Wednesday after the Fed projected interest rate hikes sooner than
  expected causing major benchmark indexes to close mixed. The S&P 500 index and the Nasdaq
  index gained by 1.5% and 4.9% on 16 June 2021 respectively, while the Dow Jones index declined
  by 0.9% on the same day.
✓ Meanwhile, US treasury yields jumped sharply following the Fed’s meeting as investors sold bonds in
  expectation of rising rates. For instance, the 3-year, 5-year, 7-year and 10-year yields saw a 7.0 bps,
  10.0 bps, 8.0 bps and 6.0 bps increase on Wednesday to reach 0.41%, 0.89%, 1.29% and 1.57%
  respectively. On the other hand, the 30-year US Treasury yields remained unchanged at 2.20% on
  the same day.
✓ Looking ahead, movement in the US Treasury yields may continue to be range bound in the
  medium term as the US inflation rate is expected to normalise in 2H2021. Nevertheless, the
  economic optimism will play a key role in preventing any drastic slump in yields.

        Changes in US Treasury Yields                         Performance of US Stock Market
                               Daily Change In Yields                    Percentage Change In Index On
    Tenure of US Treasury                                     Index
                              (Basis Points) On 16 June                           16 June 2021
             Bill
                                         2021
                                                           Dow Jones                 -0.9%
            3-year                      +7.0
                                                             S&P 500                 1.5%
            5-year                     +10.0
                                                             Nasdaq                  4.9%
            7-year                      +8.0

           10-year                      +6.0               Source: Bloomberg

           30-year                       0.0

  Source: US Department of Treasury

ECONOMIC RESEARCH                                                                                   Page 8
INFLATION STILL DEEMED TO BE TRANSITORY IN THE U.S. AS FURTHER
 NORMALISATION WILL TAKE PLACE IN 2H2021

                          US Headline Inflation vs. US Core Inflation (%)                                                                                                                                                                ✓ The U.S. inflation rate reached 5.0% y-o-y
6.0%
                                                                                                                                                                                                                                           in May (April: 4.2%) while the US core
                                                                                                                                                                                                                           5.0%
5.0%
                                                                                                                                                                                                                                           inflation stood at 3.8% in the same month
4.0%
                                                                                                                                                                                                                                           (April: 3.0%).
3.0%                                                                                                                                                                                                                       3.8%
                                                                                                                                                                                                                                         ✓ Nevertheless, the latest uptick in the US
                                           2.2%
2.0%
                                                                                                                                                                                                                                           inflation is deemed to be transitory due
1.0%
                                                                                                                                                                                                                                           to the low base from last year’s
                                           1.1%                                                                                                                                                                                            economic slowdown. Moreover, the low
0.0%
                                                                                                                                                                                                                                           base effect gave rise to a larger-than-

                                                                                                                                                                                                             Nov-20
                         Nov-15
                                  Feb-16

                                                             Nov-16
                                                                      Feb-17

                                                                                                 Nov-17
                                                                                                          Feb-18

                                                                                                                                     Nov-18
                                                                                                                                              Feb-19

                                                                                                                                                                         Nov-19
                                                                                                                                                                                  Feb-20

                                                                                                                                                                                                                      Feb-21
       May-15
                Aug-15

                                           May-16
                                                    Aug-16

                                                                               May-17
                                                                                        Aug-17

                                                                                                                   May-18
                                                                                                                            Aug-18

                                                                                                                                                       May-19
                                                                                                                                                                Aug-19

                                                                                                                                                                                           May-20
                                                                                                                                                                                                    Aug-20

                                                                                                                                                                                                                               May-21
                                                                                                                                                                                                                                           usual growth in consumer prices.
                                                                                                                                                                                                                                         ✓ For instance, all grades of US gasoline
                                           US Headline Inflation (%)                                                                     US Core Inflation (%)
                                                                                                                                                                                                                                           prices surged by more than 40.0% y-o-y
Source: CEIC                                                                                                                                                                                                                               for the second month in May which led
                US Gasoline Prices of Different Grades vs. Brent Crude
                                                                                                                                                                                                                                           to the 28.5% increase in the consumer
                                       Oil Price
                                                                                                                                                                                                                                           price index for energy.
4.00                                                                                                                                                                                                                  3.70 90.00
                                                                                                                                                                                                                                         ✓ Elevated inflationary pressures are likely
3.50 3.14                                                                                                                                                                                                                        80.00
                                                                                                                                                                                                        3.45                               to wane soon once the US regains a
3.00    2.98                                                                                                                                                                                            3.03                     70.00
   2.8                                                                                                                                                                                                                                     more normal footing in 2H2021.
2.5065.56                                                                                                                                                                                                         69.3260.00
                                                                                                                                                                                                                                         ✓ Once normalization occurs, inflation will
2.00                                                                                                                                                                                                                             50.00
                                                                                                                                                                                                                                           be more tied to trend in consumer
1.50                                                                                                                                                                                                                             40.00
                                                                                                                                                                                                                                           spending which is what the Fed will be
1.00                                                                                                                                                                                                                             30.00
                                                                                                                                                                                                                                           paying attention to when deciding rate
0.50                                                                                                                                                                                                                             20.00
                                                                                                                                                                                                                                           hikes.
       Nov-20
       Nov-15

       Nov-16

       Nov-17

       Nov-18

       Nov-19
       May-19
       May-15

       Feb-20
       Feb-16
       May-16

       Feb-17
       May-17

       Feb-18
       May-18

       Feb-19

       May-20

       Feb-21
       May-21
       Aug-15

       Aug-16

       Aug-17

       Aug-18

       Aug-19

       Aug-20

                                                                                                                                                                                                                                         ✓ An increased trend in consumer
                                                                                                                                                                                                                                           spending will likely be more prevalent
                   Regular Price (USD/gallon)-LHS                                                                                    Mid Grade Price (USD/gallon)-LHS                                                                      when herd immunity is achieved in the
                   Premium Price (USD/gallon)-LHS                                                                                    Brent Crude Oil Price (USD/barrel)-RHS
                                                                                                                                                                                                                                           US, spurring high demand for goods as
 Source: CEIC                                                                                                                                                                                                                              the economy continues to reopen.
   ECONOMIC RESEARCH                                                                                                                                                                                                                                                           Page 9
OUR VIEW

✓ Covid-19 cases in the US declines but global cases remain on the rise - The trend in daily Covid-19 cases
  in the U.S. has shown a tremendous decline to reach 11,180 cases on 16 June 2021 from 237,777 cases on
  1 January 2021. On further scrutiny, 45.0% of its population have been fully vaccinated while 17.0% of its
  population have been partly vaccinated, paving way for a faster journey to reach herd immunity.
  According to the Bloomberg Covid-19 Tracker, the US will need another 5 months from 15 June 2021 in
  order to vaccinate 75.0% of its population.

✓ High level of personal savings to boost consumer spending once herd immunity reach in the US - In the US,
  the personal savings as percentage of disposable income has remained elevated at 14.9% in April (March
  27.7%) compared to pre-pandemic levels of below 10.0%. This provides a ground that the economic
  recovery in the US can be very strong should the herd immunity is achieved in the next 5. Henceforth, it is
  not uncommon as more Fed officials are expecting a rate hike as early as next year. Such trends may also
  jive well with the market expectations that the Fed will begin cutting down asset purchases beginning
  early next year.
                                                                              US personal savings as a percentage
          Number of daily Covid-19 cases in the US                                 of disposable income (%)
350,000                                                       40.0
                                                                                                                                                                                                                        33.7%
300,000                                                       35.0
                                                                                                                                                                                                                                                 27.7%
                                                              30.0
250,000
                                                              25.0
200,000                                                       20.0

150,000                                                       15.0
                                                              10.0                                                                                                                                                                               14.9%
100,000
                                                               5.0
 50,000                                                        0.0
                                                     11,180
                                                                                       Dec-14

                                                                                                                                                               Dec-17
                                                                                                                  Dec-15

                                                                                                                                             Dec-16

                                                                                                                                                                                          Dec-18

                                                                                                                                                                                                                     Dec-19

                                                                                                                                                                                                                                                Dec-20
                                                                     Apr-14

                                                                                                Apr-15

                                                                                                                           Apr-16

                                                                                                                                                      Apr-17

                                                                                                                                                                        Apr-18

                                                                                                                                                                                                   Apr-19

                                                                                                                                                                                                                              Apr-20

                                                                                                                                                                                                                                                         Apr-21
                                                                              Aug-14

                                                                                                         Aug-15

                                                                                                                                    Aug-16

                                                                                                                                                               Aug-17

                                                                                                                                                                                 Aug-18

                                                                                                                                                                                                            Aug-19

                                                                                                                                                                                                                                       Aug-20
     -
         1-Jan   1-Feb   1-Mar   1-Apr   1-May   1-Jun
  Source: CEIC
   ECONOMIC RESEARCH                                          Source: CEIC                                                                                                                                                               Page 10
OUR VIEW

✓ Full-scale lockdown in Malaysia to impact economic growth trajectory - The latest full scale lockdown
  which entails a 60.0% working capacity for exempted manufacturing sectors will have a bearing on
  Malaysia’s economic growth trajectory. As such, we have revised our GDP growth forecast downwards to
  4.2% (previously 5.0%) for 2021 from a 5.6% contraction in 2020.

✓ Herd immunity likely to be reached by year-end in Malaysia - The government is planning to ramp up
  daily vaccination doses to the tune of 300k to 400k per day on average from August onwards from
  current average of 150k to 200k doses per day. Should the plan be materialized, Malaysia may be able to
  vaccinate 80.0% of the country’s population to reach herd immunity by end of 2021.

✓ Higher OPR in 2022 is highly likely - Assuming that herd immunity is reached by year-end in Malaysia with
  relaxations being probably eased, we opine that the pace of economic recovery will be well supported y
  strong consumer spending. Judging from M1 growth, it has increased by 18.3% y-o-y in April to RM551.1
  billion from RM466.2 million in the same month last year. What it means is that there is a lot of cash
  circulating in the country. Therefore, higher OPR would make a compelling case in 2022 once the country
  is fully vaccinated, paving the way for a steady reopening of the economy.
         Total number of daily vaccination doses                       Malaysia's M1 Money Supply (RM billion)
                 administered in Malaysia                    600.0
                                                                                                                                                                                                                                                            551.5
250,000                                            215,876   550.0
200,000                                                      500.0
150,000
                                                             450.0
100,000
                                                             400.0
 50,00014,399
                                                             350.0 325.5
     -
                                                             300.0
                                                                     Apr-14

                                                                                       Dec-14
                                                                                                Apr-15

                                                                                                                  Dec-15
                                                                                                                           Apr-16

                                                                                                                                             Dec-16
                                                                                                                                                      Apr-17

                                                                                                                                                                        Dec-17
                                                                                                                                                                                 Apr-18

                                                                                                                                                                                                   Dec-18
                                                                                                                                                                                                            Apr-19

                                                                                                                                                                                                                              Dec-19
                                                                                                                                                                                                                                       Apr-20

                                                                                                                                                                                                                                                         Dec-20
                                                                                                                                                                                                                                                                  Apr-21
                                                                                                                                                                                          Aug-18
                                                                              Aug-14

                                                                                                         Aug-15

                                                                                                                                    Aug-16

                                                                                                                                                               Aug-17

                                                                                                                                                                                                                     Aug-19

                                                                                                                                                                                                                                                Aug-20
 Source: CEIC
  ECONOMIC RESEARCH                                              Source: CEIC                                                                                                                                                                   Page 11
APPENDIX

ECONOMIC RESEARCH              Page 13
FOMC STATEMENT

 ✓ The Federal Reserve is committed to using its full range of tools to support the U.S. economy in this challenging time,
   thereby promoting its maximum employment and price stability goals.
 ✓ Progress on vaccinations has reduced the spread of COVID-19 in the United States. Amid this progress and strong
   policy support, indicators of economic activity and employment have strengthened. The sectors most adversely
   affected by the pandemic remain weak but have shown improvement. Inflation has risen, largely reflecting
   transitory factors. Overall financial conditions remain accommodative, in part reflecting policy measures to support
   the economy and the flow of credit to U.S. households and businesses.
 ✓ The path of the economy will depend significantly on the course of the virus. Progress on vaccinations will likely
   continue to reduce the effects of the public health crisis on the economy, but risks to the economic outlook remain.
 ✓ The Committee seeks to achieve maximum employment and inflation at the rate of 2 percent over the longer run.
   With inflation having run persistently below this longer-run goal, the Committee will aim to achieve inflation
   moderately above 2 percent for some time so that inflation averages 2 percent over time and longer-term inflation
   expectations remain well anchored at 2 percent. The Committee expects to maintain an accommodative stance
   of monetary policy until these outcomes are achieved. The Committee decided to keep the target range for the
   federal funds rate at 0 to 1/4 percent and expects it will be appropriate to maintain this target range until labor
   market conditions have reached levels consistent with the Committee’s assessments of maximum employment and
   inflation has risen to 2 percent and is on track to moderately exceed 2 percent for some time. In addition, the
   Federal Reserve will continue to increase its holdings of Treasury securities by at least $80 billion per month and of
   agency mortgage-backed securities by at least $40 billion per month until substantial further progress has been
   made toward the Committee’s maximum employment and price stability goals. These asset purchases help foster
   smooth market functioning and accommodative financial conditions, thereby supporting the flow of credit to
   households and businesses.
 ✓ In assessing the appropriate stance of monetary policy, the Committee will continue to monitor the implications of
   incoming information for the economic outlook. The Committee would be prepared to adjust the stance of
   monetary policy as appropriate if risks emerge that could impede the attainment of the Committee’s goals. The
   Committee’s assessments will take into account a wide range of information, including readings on public health,
   labor market conditions, inflation pressures and inflation expectations, and financial and international
   developments.
 ✓ Voting for the monetary policy action were Jerome H. Powell, Chair; John C. Williams, Vice Chair; Thomas I. Barkin;
   Raphael W. Bostic; Michelle W. Bowman; Lael Brainard; Richard H. Clarida; Mary C. Daly; Charles L. Evans; Randal K.
   Quarles; and Christopher J. Waller.
ECONOMIC RESEARCH                                                                                                   Page 14
MANUFACTURING SECTOR – 12 CONSECUTIVE MONTHS OF GROWTH

                                    Series Index       Series Index      Percentage                                               Trend
           Index                                                                               Direction      Rate of Change
                                     May 2021           April 2021      Point Change                                             (Months)
PMI                                     61.2               60.7               0.5              Growing            Faster            12
New Orders                             67.0                 64.3                2.7            Growing            Faster            12
Production                             58.5                 62.5                -4.0           Growing            Slower            12
Employment                             50.9                 55.1                -4.2           Growing            Slower             6
Supplier Deliveries                    78.8                 75.0                3.8             Slowing           Faster            63
Inventories                            50.8                 49.7                1.1            Growing       From Contracting        1
Customers’ Inventories                 28.0                 28.4                -0.4           Too Low            Faster            56
Prices                                 88.0                 89.6                -1.6          Increasing          Slower            12
Backlog of Orders                      70.6                 68.2                2.4            Growing            Faster            11
New Export Orders                      55.4                 54.9                0.5            Growing            Faster            11
Imports                                54.0                 52.2                1.8            Growing            Faster            11
                                   OVERALL ECONOMY                                             Growing            Faster            12
                                   Manufacturing Sector                                        Growing            Faster            12
Source: US ISM
              US ISM Manufacturing PMI, points                                         ✓   According to the US Institute for Supply
                                                                                           Management (ISM), Manufacturing Purchasing
 70
                                                                                           Manger’s Index (PMI) increased to 61.2 points in
 65
                                                                         64.7              May from 60.7 points in the preceding month.
                                                                             61.2      ✓   The growth was mainly contributed by the
 60                                                                                        higher New Orders (May: 67.0 points vs. April:
                   56.5
                                                                                           64.3 points) in May particularly for Non–metallic
 55                                                                                        Mineral Products, Furniture & Related Products,
                                                                                           as well as Electrical Equipment, Appliances &
 50
                                                                                           Components.
 45                                                                                    ✓   Apart from that, with businesses remaining
                                                                                           optimistic about the outlook as the economy
                                                                      41.7
 40                                                                                        continues to reopen from Covid19 restrictions,
  May-11                  Sep-14                   Jan-18              May-21              demand is expected to rise further in the next
Sources: Bloomberg, US ISM                                                                 few months.
ECONOMIC RESEARCH                                                                                                                   Page 15
MANUFACTURERS’ SENTIMENTS IN MAY 2021 – MIXED VIEWS

  Business Sector                            Outlook on Business Activities
  Computer &              Demand is high but they are facing supply chain problems and labour
  Electronic Products     shortages.
  Chemical Products       Strong consumer demand has led to the increase in sales.

  Furniture & Related     Business is good, but costs are increasing due to labor and raw
  Products                materials problems.
  Plastics & Rubber       Experiencing a high demand and backlog of orders.
  Products
  Non–metallic            Demand remains strong. However, global supply chain tightness and
  Minerals Products       raw material shortages from the Gulf due to winter storms make it less
                          likely that businesses can recover this year.
  Electrical Equipment,   Labor shortages impacting internal and supplier production, together
  Appliances &            with poor logistics performance.
  Components
  Food, Beverage &        Production delays due to labour shortages. Apart from that, delays at
  Tobacco Products        the ports continue to strain inventory levels.
  Source: US ISM

ECONOMIC RESEARCH                                                                           Page 16
DISCLAIMER

  Produced and issued by BANK ISLAM MALAYSIA BERHAD (Bank Islam) for private circulation only or for distribution
  under circumstances permitted by applicable laws. All information, opinions and estimates contained herein have
  been compiled or arrived at based on sources and assumptions believed to be reliable and in good faith at the
  time of issue of this document. This document is for information purposes only and has no regard to the specific
  investment objectives, financial situation or particular needs of any specific recipient. No representation or
  warranty, expressed or implied is made as to its adequacy, accuracy, completeness or correctness. All opinions
  and the content of this document are subject to change without notice and may differ or be contrary to opinions
  expressed by other business areas or groups of Bank Islam as a result of using different assumptions and criteria. No
  part of this document may be used, reproduced, distributed or published in any form or for any purpose without
  Bank Islam’s prior written permission.

ECONOMIC RESEARCH                                                                                                   Page 17
You can also read