Flexible Defense Succeeds Creative Attacks!-A Simulation Approach Based on Position Data in Professional Football
←
→
Page content transcription
If your browser does not render page correctly, please read the page content below
Journal of Software Engineering and Applications, 2021, 14, 493-504
                                                                                                https://www.scirp.org/journal/jsea
                                                                                                           ISSN Online: 1945-3124
                                                                                                             ISSN Print: 1945-3116

Flexible Defense Succeeds Creative Attacks!—A
Simulation Approach Based on Position Data in
Professional Football

Daniel Memmert1, Jonas Imkamp1, Jürgen Perl2
1
    German University of Sport Science, Cologne, Germany
2
    University of Mainz, Mainz, Germany

How to cite this paper: Memmert, D.,          Abstract
Imkamp, J. and Perl, J. (2021) Flexible
Defense Succeeds Creative Attacks!—A          Introduction: The key to success is finding the perfect mixture of tactical
Simulation Approach Based on Position         patterns and sudden breaks of them, which depends on the behavior of the
Data in Professional Football. Journal of
                                              opponent team and is not easy to estimate by just watching matches. According
Software Engineering and Applications, 14,
493-504.
                                              to the specific tactical team behavior of “attack vs. defense” professional football
https://doi.org/10.4236/jsea.2021.149029      matches are investigated based on a simulation approach, professional football
                                              matches are investigated according to the specific tactical team behavior of “at-
Received: July 6, 2021
                                              tack vs. defense.” Methods: The formation patterns of all the sample games are
Accepted: September 13, 2021
Published: September 16, 2021
                                              categorized by SOCCER© for defense and attack. Monte Carlo-Simulation can
                                              evaluate the mathematical, optimal strategy. The interaction simulation be-
Copyright © 2021 by author(s) and             tween attack and defense shows optimal flexibility rates for both tactical groups.
Scientific Research Publishing Inc.
                                              Approach: A simulation approach based on 40 position data sets of the
This work is licensed under the Creative
Commons Attribution International
                                              2014/15 German Bundesliga has been conducted to analyze and optimize such
License (CC BY 4.0).                          strategic team behavior in professional soccer. Results: The results revealed
http://creativecommons.org/licenses/by/4.0/   that both attack and defense have optimal planning rates to be more successful.
                 Open Access                  The more complex the success indicator, the more successful attacking player
                                              groups get. The results also show that defensive player groups always succeed in
                                              attacking groups below a specific planning rate value. Conclusion: Groups are
                                              always succeeding. The simulation-based position data analysis shows success-
                                              ful strategic behavior patterns for attack and defense. Attacking player groups
                                              need very high flexibility to be successful (stay in ball possession). In contrast,
                                              defensive player groups only need to be below a defined flexibility rate to be
                                              guaranteed more success.

                                              Keywords
                                              Strategy, KPI, Offensive and Defensive Dynamics, Ball Contact, Ball Possession,
                                              Passes

DOI: 10.4236/jsea.2021.149029 Sep. 16, 2021                      493               Journal of Software Engineering and Applications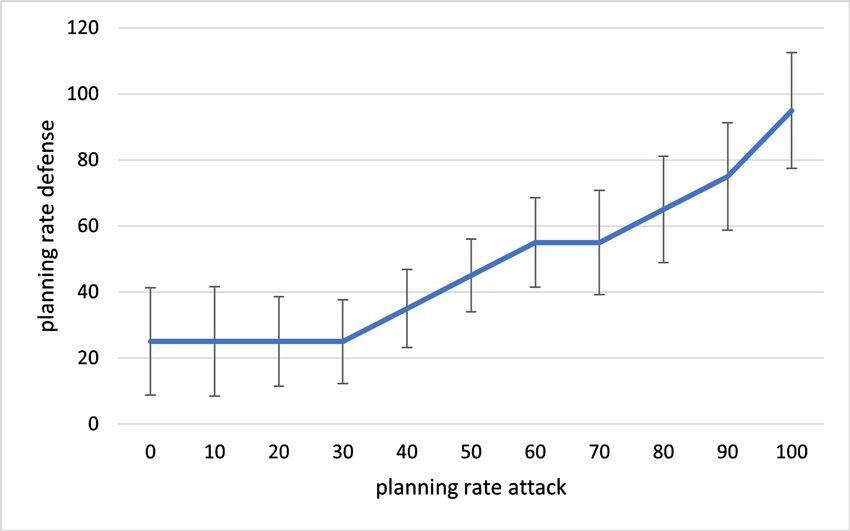
D. Memmert et al.

                                1. Introduction and Theoretical Framework
                                The almost unknown Union Berlin in the German Bundesliga ranked 7th in the
                                2020/2021 Bundesliga league table, while Hertha BSC, the well-known Berlin
                                soccer team, was close to relegation. A reasonable explanation of the sudden
                                success of Union Berlin could be their specific style of playing, where flexible ac-
                                tions of defensive player groups with the ball suddenly break into periods of
                                stereotype defensive action patterns. In contrast to this, Hertha BSC shows the
                                efforts of the creative action of offensive player groups. The key to success is to
                                find the perfect mixture of tactical patterns and sudden breaks freedom. This
                                balance of strategies, of course, depends on the behavior of the opponent team
                                and is not relatively easy to estimate by just watching games (Memmert & Raabe,
                                2018 [1]). To shed light on the perfect balance of professional football flexibility,
                                we provide and test a simulation framework based on big data (positional data of
                                the players and the ball).
                                   Work in the simulation of positional data is closely related to trajectory pre-
                                diction and theory on multi-agent simulation (e.g., Wellman, 2006 [2]). Once
                                you train your model to predict movements, you can simulate all game actors
                                (Tuyls et al., 2020 [3]). This action is usually called “ghosting” in the literature
                                (Lowe, 2013 [4]). This approach is first used in soccer or basketball (Maksai,
                                Wang, & Fua, 2016 [5]; Le, Carr, Yue & Lucey, 2017 [6]; Le, Yue, Carr, & Lucey,
                                2017 [7]). However, so far, no attempts were made on position data simulations
                                themselves.
                                   This study analyzes the defensive- and attacking lines of Bundesliga teams by
                                Monte Carlo Simulation to determine the best possible flexibility for both.

                                2. Simulation-Based Approach on
                                Tactical Patterns in Football
                                Some teams win using “Tiki Taka,” and other teams win by breaking “Tiki Taka”
                                by fast counter attacks. The main goal of our simulation approach is to under-
                                stand which offensive and defensive strategic concepts and tactical flexibility are
                                successful in interacting with the opponent ones. To this aim, we analyze
                                matches strongly reduced to actions and interactions of specific player groups
                                (formations) like defense and offense. The constellations of the respective play-
                                ers, i.e., the types of appearance, are straightforward for tactical situations like
                                ball contact, ball possession, and passing or the strategic background of interac-
                                tion. Therefore, reduced to those formation interactions and tactical aspects, the
                                strategic plans can be recognized and calculated, and optimized by simulation,
                                using mathematical approaches like Monte Carlo simulation and game theory to
                                generate optimal strategic patterns (Perl & Memmert, 2018a [8], b [9]).
                                   Such an optimal strategy consists typically of a variety of partial methods like,
                                e.g., “conserving ball possession,” “build attack,” “fast attack,” or “playing the
                                ball directed to the goal” (Memmert & Rein, 2018 [10]). Thus, while only a little
                                data is available to calculate and decide what was victorious from the original

DOI: 10.4236/jsea.2021.149029                        494              Journal of Software Engineering and Applications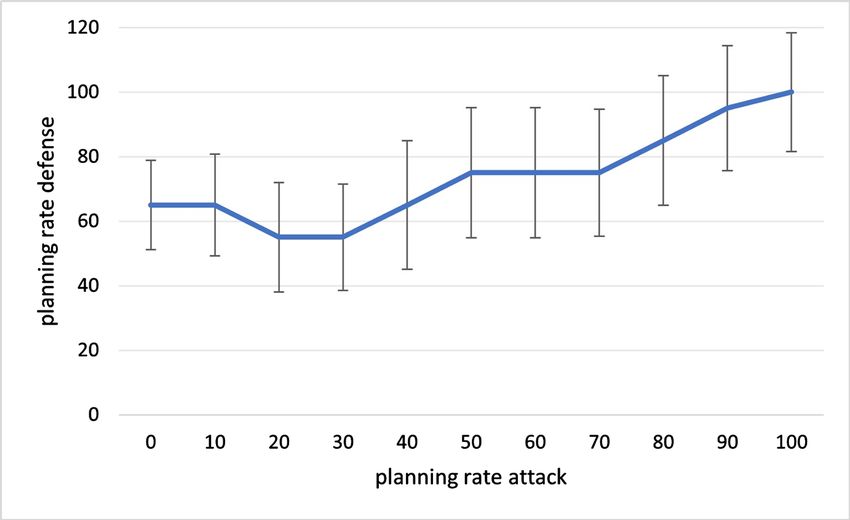
D. Memmert et al.

                                match, an accurate simulation can generate lots of data to estimate what could
                                have been successful. The result is a percentage distribution of the leading and
                                remaining strategies.
                                  However, for complex games like soccer with more than 20 interacting play-
                                ers, such a strategy distribution is much too complicated to get to work. It has to
                                be simplified to player group-specific tactical variations. Therefore, Perl (2018
                                [11]) provides a simulation framework that generates a specific primary or
                                “strict” strategy for just one type of success, e.g., space control, which gives room
                                for situation-depending “flexible” variations. The number of generated flexible
                                variations can be smaller or larger regarding the strict primary strategy, respec-
                                tively defining a percentage degree of flexibility F against the remaining amount
                                of MC-simulated actions that establishes the percentage degree of strictness S: S
                                + F = 100. One example of a stringent space control strategy is the well-known
                                “Tiki Taka.” An example of a successful flexible counter-strategy is “fast
                                counter-attacks.”
                                  For the first time, Perl, Imkamp, and Memmert (2021 [12]) tested this simula-
                                tion framework by answering the question of whether “strictness” and “flexibil-
                                ity” are at all acceptable terms for characterizing strategic plans and tactical
                                variations as well as their success. 40 positional data sets extracted from 10 pro-
                                fessional soccer games were analyzed to find the original vital strategies, simulate
                                the optimal primary strategy, and compare the values of strictness and flexibility.
                                Moreover, soccer experts evaluated those results based on video analyses and
                                confirmed the applicability of that simulation approach to professional Football.
                                  Based on Perl et al. (2021 [12]), the current approach presents additional and
                                more detailed results regarding the essential topics of flexible defense and crea-
                                tive attack in Football based on a simulation framework. In addition, we expand
                                the study from Perl et al. (2021 [12]) by analyzing three performance indicators
                                (ball contact, ball possession, and passes) in the simulation framework instead of
                                one (ball contact).

                                3. Method
                                The positional data of the selected sample of N = 10 matches from 2014/15
                                German Bundesliga was used for verification and evaluation using simulative
                                and network-based process analysis. Football coaches (UEFA A-license) took the
                                selected sample of the ten matches based on the teams’ tactical orientation. Sub-
                                stitution effects and tactical formation bias were avoided by only using the first
                                half of the matches (Memmert & Raabe 2018 [1]). Each team in the sample played
                                in an offensive formation with a four-man defensive line, two defensive midfield-
                                ers, a central offensive midfielder, two wingers, and a forward, thus in a 4-2-3-1.
                                The defensive formation of all teams is a 4-4-2. All success values (ball contact, ball
                                possession, passes) for every simulated interaction of tactical player groups are av-
                                eraged, and the threshold values are defined. This procedure is for Bundesliga
                                team A and Bundesliga team B (both five games) and all three player groups.

DOI: 10.4236/jsea.2021.149029                         495              Journal of Software Engineering and Applications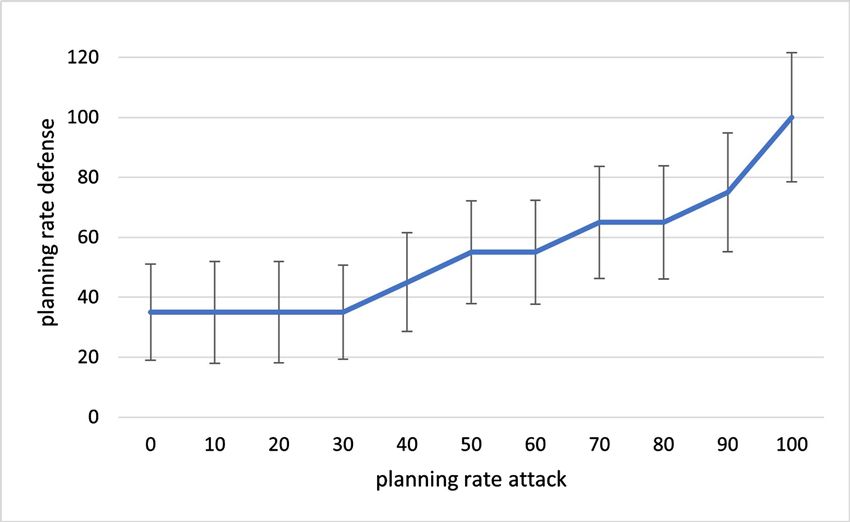
D. Memmert et al.

                                   The intention is to simulate the interplay between the tactical groups of both
                                teams. The tactical groups, defense, and attack are first determined. Then, the
                                four-man defensive line players, 2, 3, 4, and 5, are selected for the defense. Next,
                                players 9, 10, and 11 were chosen for the tactical player group attack, and finally,
                                the interaction of defense and attack were simulated in both directions. In this
                                case, the goalkeeper is disregarded. Therefore, performance values for two tacti-
                                cal (defensive vs. attack) player groups of both teams of 10 matches result in a
                                data set of N = 40. The positions of the two tactical player groups are recorded
                                per second and reduced to 20 distinct constellation types with the use of the
                                SOCCER© neuronal network (see for more details, Perl & Memmert, 2011 [13];
                                Perl, Grunz, & Memmert, 2013 [14]). The formation data of every team and tac-
                                tical player group is trained on that artificial neural network to generate clusters
                                of similar constellations during the training process, thus characterizing the
                                constellation types by performance indicators. The interplay interaction of
                                SOCCER© is based on these trained formation types.
                                   The actual game action is replaced by the interaction between these constella-
                                tion types in the simulation. Several performance indicators (see Low et al., 2019
                                [15]), such as ball contact, space control, or pass-game, can be used to evaluate
                                success (Memmert & Raabe, 2018 [1]). The simulation of the performance indi-
                                cators by combining attacking and defensive constellations is based on the pre-
                                viously mentioned clustering of constellations. Since only ball contacts are not a
                                very complex indicator for success (Perl & Memmert, 2017 [16]), this current
                                study evaluates success by using “ball contact” in connection with “ball posses-
                                sion” and “passes” as one single overall performance indicator. Therefore, the
                                total of 10 games was split into the two teams’ raw positional data per match sec-
                                tion, and each team’s trajectories were divided into the attack and defensive con-
                                stellation. Overall, we have N = 40 position data sets, three performance indica-
                                tors, and two tactical groups per team of every selected match as a final result.
                                   The core of the analysis consists of a comparison between the success-oriented
                                recommendation that is derived from strategy optimization on the one hand and
                                a Monte Carlo simulation of the actual tactical behavior on the other hand. The
                                “planning rate” or “strictness” then is defined by the percentage of coincidence
                                between essential and recommended behavior, i.e., the ratio with which the cal-
                                culated primary strategy (“plan”) is implemented in the match (for more details,
                                see Perl et al., 2021 [12]). The complement to the planning rate S is the flexibility
                                rate F: S + F = 100. The flexibility rate measures the percentage with which the
                                primary strategy is deviated by tactical variations depending on the situation. A
                                high planning rate describes a highly planned or stereotypical game that the op-
                                ponent can easily recognize. A low planning rate leads to more flexible, tactical
                                behavior. Too low planning rate values can lead to high flexibility or aimless
                                conduct.

                                Simulation Approach
                                The simulation by SOCCER© provides simulated success values of both teams in

DOI: 10.4236/jsea.2021.149029                        496              Journal of Software Engineering and Applications
D. Memmert et al.
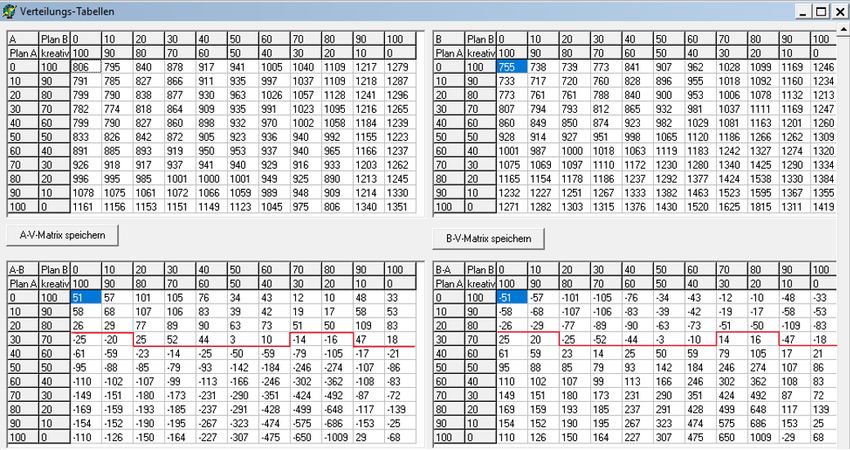
distribution tables in an 11 × 11 matrix. The X-axis shows the planning rate of
team B from 0 to 100 and its flexibility rate from 100 to 0, both in steps of 10. On
the Y-axis, team A’s planning rate and flexibility rate are also shown from 0 to
100 and 100 to 0. The simulated numbers of successful events of the given suc-
cess parameter (ball contact) per halftime are shown as the success values: The
higher the value, the more successful.
Figure 1 shows the success values for the selected performance indicator (ball
contact) and the planning rates on the left for team A and the right for team B.
Every success value shows the simulated numbers of successful ball contacts for
each team. The tables in the second row show both teams’ positive or negative
results as differences of the respective performance values depending on the in-
dividual planning rates. In the next step, the threshold values of the flexibilities
are determined by the balance point of the optimal 0-sum-distribution. The
threshold values describe the line where the positive performance difference
values change into negative values (for more detailed information, see Perl et al.,
2021 [12]).
4. Results
The threshold evaluation of the simulated interaction between attack and de-
fense for the three performance indicators, ball contact (Figure 2), ball posses-
sion (Figure 3), and passes (Figure 4), show a high dispersion demonstrated by
Figure 1. Example screenshot of distribution tables created by SOCCER©. The X-axis shows the strictness of team B
from 0 to 100 (planning rate), and the Y-axis, the strictness of team A. Top tables show simulated, successful event
values for every flexibility combination of offense and defense for team A on the left and team B on the right. The
bottom tables show successful event values of team A minus successful event values of team B for all flexibility com-
binations on the left and team B minus team A on the right. The red line marks the threshold.
DOI: 10.4236/jsea.2021.149029 497 Journal of Software Engineering and ApplicationsD. Memmert et al.
the standard deviation. These results were also found to analyze the attack, de-
fense player groups of all Bundesliga Teams in the sample. The results for all
three indicators show similar patterns. Figure 2 shows the threshold value curve
of all ball contacts. Figure 3 shows the same for the indicator ball possession,
and in Figure 4, the threshold values of the interaction simulation by SOCCER@
are demonstrated for the indicator passes.
The threshold results for each of the three given performance indicators start
with low to mid-low values and increase by the higher planning rates of the at-
tack. The threshold values are higher with the indicator ball contact than ball
possession and pass. The more complex the indicators become, the more the
threshold values align themselves to a linear curve.
4.1. Success Indicator: Ball Contact
SOCCER© defines the performance indicator ball contact as an event in which
coordinates of the ball are close to the coordinates of the nearest player. All ball
contacts for the defense and the attack player groups are added and shown in
distribution tables (Figure 1). All threshold values are based on the simulated
positive ball contacts of both player groups. Thus, the indicator ball contact is
the less complex indicator that SOCCER© can evaluate.
In Figure 2, the threshold values for the performance indicator ball contact
are shown. It shows the average threshold values of all ten matches with all
Figure 2. Average thresholds of all games of the sample with the performance indicator
ball contact. The X-axis shows the average planning rate value of the attack from 0 to 100
for the whole sample. The Y-axis shows the threshold value of the defense from 0 to 100.
Thus, the data points describe the average threshold for any given planning rate combi-
nation of the simulated interaction of defense and attack of all games in the sample. The
area below the respective threshold value curves describes the planning rate ranges in
which the defense team groups are more successful. The area above the individual thresh-
old curves represents the more successful planning rate combinations of the attack player
groups (success indicator: ball contact).
DOI: 10.4236/jsea.2021.149029 498 Journal of Software Engineering and ApplicationsD. Memmert et al.
defense and attack player groups of all teams. It shows the successful attack
ranges (above the threshold graph) and defense (below the threshold graph).
Figure 3 and Figure 4, Figure 2 also offers the maximum value of 100 for the
attack and defense planning rates. This can be explained by the lack of change in
the match, which is positive for defensive player groups. Figure 2 shows that the
optimal flexibility of an attack, depending on ball contacts, is between planning
rates of 20 and 30. Even higher flexibility rates do not result in more success.
Very high planning rates (strictness) of the defense are the areas of more suc-
cessful ball contacts of the attack. Defense player groups need, on average, a
higher planning rate to gain more successful ball contacts than the attack. How-
ever, the success of a player group is not only influenced by its planning rate.
Also, the interaction of both player groups and their planning rates is essential.
4.2. Success Indicator: Ball Possession
Ball possession is defined as a period of 2 seconds in which the coordinates of
the closest player to the ball and the ball’s coordinates are as relative as for ball
contact. These successful ball possession events in the interaction of attack and
defense are simulated by SOCCER© and shown in distribution tables (Figure 1).
The middle threshold values between positive ball possession values of the attack
and the defense from all ten matches are shown in Figure 3.
Figure 3 shows that the optimal planning rate of an attack depending on ball
Figure 3. Average thresholds of all games of the sample with the performance indicator
ball possession. The X-axis shows the average planning rate value of the attack from 0 to
100 for the whole sample. The Y-axis shows the threshold value of the defense from 0 to
100. Thus, the data points describe the average threshold for any given planning rate
combination of the simulated interaction of defense and attack of all games in the sample.
The area below the respective threshold value curves describes the planning rate ranges in
which the defense team groups are more successful. The area above the individual thresh-
old curves represents the more successful planning rate combinations of the attack player
groups (success indicator: ball possession).
DOI: 10.4236/jsea.2021.149029 499 Journal of Software Engineering and ApplicationsD. Memmert et al.
possession lies between 0 and 30, with a planning rate range of the defense from
35 to 100 in which the attack succeeds the defense. The results are shown in
Figure 3 also describe that defensive player groups have a planning rate below
35. They will be more successful in ball possession in every planning rate of the
attack. The higher the planning rates of the attack, the higher the success rates of
the defense get.
4.3. Success Indicator: Pass
The success indicator pass simulated by SOCCER© is defined as a ball posses-
sion of the passing player before the pass and a successful ball possession of a
different player of the same team after the pass. This indicator was detected by
SOCCER© adds the time of passing and position of the involved players. This
indicator is the most complex indicator of ball contact, ball possession, and pass.
The successful passes are simulated interactively by SOCCER© for every given
planning rate combination of attack and defense. These successful passing values
are shown in distribution tables (Figure 1). The middle threshold values of all 10
matches are shown in Figure 4.
Figure 4 shows an optimal attack planning rate of 0 to 30 with a threshold
value of 25. That means the success range goes from defense planning rate 25 to
100. From attack planning rate 30, the threshold values rise nearly as the plan-
ning rate rises. With a 100 attack and defense planning rate, the attack still has a
Figure 4. Average thresholds of all games of the sample with the performance indicator
pass. The X-axis shows the average planning rate value of the attack from 0 to 100 for the
whole sample. The Y-axis shows the threshold value of the defense from 0 to 100. Thus,
the data points describe the average threshold for any given planning rate combination of
the simulated interaction of defense and attack of all games in the sample. The area below
the respective threshold value curves describes the planning rate ranges in where the de-
fense team groups are more successful. The area above the individual threshold curves
describes the more successful planning rate combinations of the attack player groups
(success indicator passes).
DOI: 10.4236/jsea.2021.149029 500 Journal of Software Engineering and ApplicationsD. Memmert et al.
small success range of 5.
The threshold values of the indicator pass show a similar curve as the thresh-
old values of ball contact and ball possession. The main differences are the suc-
cess ranges for optimal attack planning rates. The more complex the indicator
gets, the more extensive the success goes for optimal attack planning rates. This
can be the result of a lower count of detected events for more complex indica-
tors. Fewer events lead to more extreme middle values. The theory can also ex-
plain these results that defending player groups can defend less complicated
events of a flexible or creative attack. On the other hand, if the events get more
complex and have the same high flexibility, it gets more challenging to defend.
5. Discussion
Notational analysis approaches aimed to determine the successful tactical be-
havior of different team members. Still, it could not investigate interaction proc-
esses in team strategies (Memmert & Raabe, 2018 (1)) because it is narrowed to
the already seen strategy and not the overall space of possibilities. Therefore, the
main aim of this study was to establish a simulation approach in professional
Football with a simulation of the tactical behavior “attack vs. defense” in soccer
as a function of the strategic planning rate based on three fundamental per-
formance indicators.
The results for all indicators show a similar threshold curve. The main differ-
ence is the threshold values at low attack planning rates. The more complex the
indicator gets, the lower the planning rate values at low or optimal attack plan-
ning rates are. Thus, more complex events and low attack planning rates result
in more extensive success ranges of the attacking player group.
This can be interpreted in different ways. The more complex an indicator gets,
SOCCER© will detect the more minor events. That can influence threshold val-
ues to more extreme values. It could also mean that if a complex event is played
highly flexible or creative, it is more difficult to defend than events of lower
complexity. Passes between highly flexible positioned attacking player groups
seem to have high success. Based on this assumption, passing drills should be
modified. Different positions in every trial could lead to more flexibility in the
games. This could also train defense player groups to find the perfect balance
between flexibility and strictness.
Results also show a very high success range from attack planning rate 0 to 100
at low planning rate values of the defense. At ball contact from 0 to 55, at ball
possession from 0 to 35, and passes from 0 to 25. This means that defense player
formations should play highly flexible. They will succeed against attack player
groups no matter how flexible they are. For practical implications, the results
can be summarized as follows: offensive player groups should play more flexible
or creative tactical variations to stay in ball possession, whereas defensive player
groups need the right balance between flexibility and strictness. The results for
ball contacts show that defense formations with planning rates between 60 to 70
DOI: 10.4236/jsea.2021.149029 501 Journal of Software Engineering and ApplicationsD. Memmert et al.
are likely to be the more successful team. This changes with the indicator ball
possession, where the defense is more successful with low planning rates no
matter how the attack plays. The results of all indicators show that an optimal
planning rate for an attack should be between 20 and 30 to be as successful as
possible.
The practical effect of such approaches and measures can be checked utilizing
exemplary concrete games. First, the teams become instructed about their tacti-
cal-strategic behavior and then set creative accents freely or controlled by simu-
lation results. The first attempts for such approaches are the studies by Mem-
mert et al. (2019 [17]) and Low et al. (2021 [18]). Both presented field experi-
ments in an 11 vs. 11 soccer game set-up to investigate the impact of different
formations (e.g., 4-2-3-1 vs. 3-5-2) and pressing strategies (high vs. low pressing)
on tactical key performance indicators using positional data a controlled design.
This demonstrated that an experimental positional data analysis paradigm is a
valuable tool to develop theory-oriented models in performance analysis in team
sports.
For this purpose, portable sensors (GPS tracking systems, see Baca et al., 2009
[19]) are needed to collect the position data of players from both teams in a
field-based but controlled environment. Furthermore, by using several matches
in the simulation, more reliable results will be achieved. Also, the increased
number of matches can take better account of the variability and improve the
teams’ flexibility. This will lead to further development of theory-driven simula-
tion models (Groom, Cushion, & Nelson, 2011 [20]; Rein, Perl, & Memmert,
2017 [21]) and incorporate existing talent and periodization models in simula-
tion approaches.
In conclusion, high flexibility is the key to success in soccer, depending on the
three indicators of ball possession: Monte Carlo-based analysis shows this leads
to optimizing tactical processes. In particular, highly flexible defensive forma-
tions have an advantage over attacking formations. Finally, it shows that flexibil-
ity needs to be integrated in practice for every tactical part of the team to in-
crease the overall performance.
6. Conclusions
The simulation-based position data analysis shows successful strategic behavior
patterns for attack and defense. Attacking player groups need very high flexibil-
ity to be successful (stay in ball possession). In contrast, defensive player groups
only need to be below a defined flexibility rate to be guaranteed more success.
The results for the three success indicators used in this study show that if the
defensive line on average is below a planning rate of 30, it succeeds the attacking
line no matter how flexible they play.
Concerning these findings, passing drills and coaching should be optimized to
develop flexible decision-making for future professional football players.
Further research based on this study’s results should examine the differences
DOI: 10.4236/jsea.2021.149029 502 Journal of Software Engineering and ApplicationsD. Memmert et al.
between flexibility rates of a four-man defensive line and a three- or five-man
defensive line. The same should be done for different attacking line-ups.
Conflicts of Interest
The authors declare no conflicts of interest regarding the publication of this
paper.
References
[1] Memmert, D. and Raabe, D. (2018) Data Analytics in Football: Positional Data Col-
lection, Modelling and Analysis. Taylor & Francis Inc., London.
https://doi.org/10.4324/9781351210164
[2] Wellman, M.P. (2006) Methods for Empirical Game-Theoretic Analysis. Associa-
tion for the Advancement of Artificial Intelligence, Menlo Park, 1552-1556.
[3] Tuyls, K., Omidshafiei, S., Muller, P., Wang, Z., Connor, J., Hennes, D., et al. (2021)
Game Plan: What AI Can Do for Football, and What Football Can Do for AI. Jour-
nal of Artificial Intelligence Research, 71, 41-88. https://doi.org/10.1613/jair.1.12505
[4] Lowe, Z. (2013) Lights, Cameras, Revolution.
[5] Maksai, A., Wang, X. and Fua, P. (2016) What Players Do with the Ball: A Physical-
ly Constrained Interaction Modeling. Proceedings of the IEEE Conference on
Computer Vision and Pattern Recognition, Las Vegas, 27-30 June 2016, 972-981.
https://doi.org/10.1109/CVPR.2016.111
[6] Le, H. M., Yue, Y., Carr, P. and Lucey, P. (2017) Coordinated Multi-Agent Imitation
Learning. International Conference on Machine Learning, New York, 19-24 June
2016, 1995-2003.
[7] Le, H.M., Carr, P., Yue, Y. and Lucey, P. (2017) Data-Driven Ghosting Using Deep
Imitation Learning. MIT Sloan Sports Analytics Conference, Boston, 3-4 March
2017, 1-15.
[8] Perl, J. and Memmert, D. (2018) Soccer: Process and Interaction. In: Baca, A. and
Perl, J., Eds., Modelling and Simulation in Sport and Exercise, Routledge, Abing-
don, 73-94. https://doi.org/10.4324/9781315163291-4
[9] Perl, J. and Memmert, D. (2018) Key Performance Indicators. In: Baca, A. and Perl,
J., Eds., Modelling and Simulation in Sport and Exercise, Routledge, Abingdon,
146-166. https://doi.org/10.4324/9781315163291-8
[10] Memmert, D. and Rein, R. (2018) Match Analysis, Big Data and Tactics: Current
Trends in Elite Soccer. German Journal of Sports Medicine/Deutsche Zeitschrift für
Sportmedizin, 69, 65-72. https://doi.org/10.5960/dzsm.2018.322
[11] Perl, J. (2018) Formation-Based Modelling and Simulation of Success in Soccer. In-
ternational Journal of Computer Science in Sport, 17, 204-215.
https://doi.org/10.2478/ijcss-2018-0012
[12] Perl, J. Imkamp, J. and Memmert, D. (2021) Key Strictness vs. Flexibility: Simula-
tion-Based Recognition of Strategies and Its Success in Soccer. International Journal
of Computer Science in Sport, 20, 43-54. https://doi.org/10.2478/ijcss-2021-0003
[13] Perl, J. and Memmert, D. (2011) Net-Based Game Analysis by Means of the Soft-
ware Tool Soccer. International Journal of Computer Science in Sport, 10, 77-84.
[14] Perl, J., Grunz, A. and Memmert, D. (2013) Tactics in Soccer: An Advanced Ap-
proach. International Journal of Computer Science in Sport, No. 12, 33-44.
DOI: 10.4236/jsea.2021.149029 503 Journal of Software Engineering and ApplicationsD. Memmert et al.
[15] Low, B., Coutinho, D., Gonçalves, B., Rein, R., Memmert, D. and Sampaio, J. (2019)
A Systematic Review of Collective Tactical Behaviours in Football Using Positional
Data. Sports Medicine, 50, 343-385. https://doi.org/10.1007/s40279-019-01194-7
[16] Perl, J. and Memmert, D. (2017) A Pilot Study on Offensive Success in Soccer Based
on Space and Ball Control—Key Performance Indicators and Key to Understand
Game Dynamics. International Journal of Computer Science in Sport, 16, 65-75.
https://doi.org/10.1515/ijcss-2017-0005
[17] Memmert, D., Raabe, D., Schwab, S. and Rein, R. (2019) A Tactical Comparison of
the 4–2-3-1 and 3–5-2 Formation in Soccer: A Theory-Oriented, Experimental Ap-
proach Based on Positional Data in an 11 vs. 11 Game Set-Up. PLoS ONE, 14,
e0210191. https://doi.org/10.1371/journal.pone.0210191
[18] Low, B., Rein, R., Raabe, D., Schwab, S. and Memmert, D. (2021) The Porous
High-Press? An Experimental Approach Investigating Tactical Behaviours from
Two Pressing Strategies in Football. Journal of Sports Sciences, 1-12. (In Press)
https://doi.org/10.1080/02640414.2021.1925424
[19] Baca, A., Dabnichki, P., Heller, M. And Kornfeind, P. (2009) Ubiquitous Compu-
ting in Sports: A Review and Analysis. Journal of Sport Science, 27, 1335-1346.
https://doi.org/10.1080/02640410903277427
[20] Groom, R., Cushion, C. and Nelson, L. (2011) The Delivery of Video-Based Perfor-
mance Analysis by England Youth Soccer Coaches: Towards a Grounded Theory.
Journal of Applied Sport Psychology, 23, 16-32.
https://doi.org/10.1080/10413200.2010.511422
[21] Rein, R., Perl, J. and Memmert, D. (2017) Maybe a Tad Early for a Grand Unified
Theory: Commentary on “Towards a Grand Unified Theory of Sports Perfor-
mance”. Human Movement Science, 56, 173-175.
https://doi.org/10.1016/j.humov.2017.04.011
DOI: 10.4236/jsea.2021.149029 504 Journal of Software Engineering and ApplicationsYou can also read