The High Frequency Seismic Attenuation Structure of the East Anatolian Fault Zone
←
→
Page content transcription
If your browser does not render page correctly, please read the page content below
European International Journal of Science and Technology                             Vol. 9 No. 11              November 2020

           The High Frequency Seismic Attenuation
          Structure of the East Anatolian Fault Zone

                                                    Şakir ŞAHİN
          Suleyman Demirel University, Engineering Faculty, Geophysical Division, Isparta, Turkey
                                     Orcid no:0000-0001-6345-5270
                                      E-mail: sakirsahin@sdu.edu.tr

Published: 30 November 2020
Copyright © Şahin.

ABSTRACT
The East Anatolian Fault Zone (EAFZ) is Turkey's main tectonic unites bordered the Anatolian plate from
the southeastern side. EAFZ, which is NE-SW direction, consists of many fault segments. Many damaging
earthquakes occurred in the historical and instrumental period, the largest being 6.8 (Ms). The last
earthquake occurred on January 24, 2020, magnitude 6.6 (Ml) (Mw=6.8). This earthquake in Elazığ-Sivrice
occurred in the Hazar-Sincik segment of EAFZ. However, considering the historical and instrumental
activity, it is seen that many fault segments are silent. In this study, the attenuation structure (as and
        is determined by using the high-frequency band as 12 and 24 Hz. The values of attenuation of P and
S waves are determined as ±0.002 and ±0.001, respectively. The frequency dependency values are obtained
between 0.01 and 1.2 for P and S waves. From the results obtained with the use of the data of the
earthquakes that occurred from 2007 to the end of December 2019, it was determined that the attenuation
increased in the Caspian-Sincik segment. The attenuation values on the segments of EAFZ where the
earthquake occurred and in the silent section are revealed.

Keywords: Attenuation, EAFZ, earthquake, tomography.

1. Introduction
The East Anatolian Fault Zone (EAFZ) is the second-longest tectonic structure with respect seismic activity
in Turkey. EAFZ, which forms the southern border of the Anatolian Plate with the Arabian plate, joins with
the North Anatolian Fault Zone (NAFZ) in Bingöl-Karlıova. Karlıova region, where both tectonic zones

Cite this article: ŞAHİN, Ş. (2020). The High Frequency Seismic Attenuation Structure of the East Anatolian Fault Zone. European
International Journal of Science and Technology, 9(11), 19-36.
                                                                                                                                   19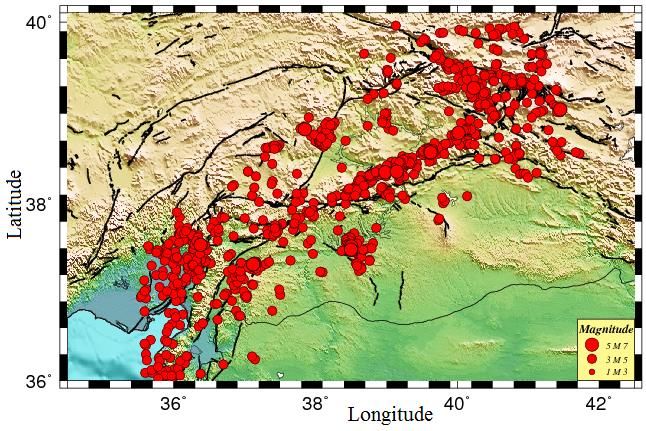
European International Journal of Science and Technology ISSN: 2304-9693 www.eijst.org.uk join, is the largest stress area. This stress zone occurs according to the movement of plates in Turkey. With the pressure of the Arabian plate from the south, the most significant stress occurs in this region, and the Anatolian plate moves westward along the borders of the NAFZ and EAFZ (Allen et al., 2004). In this respect, DAFZ, together with the NAFZ, shapes the other border of the Anatolian plate on land. DAFZ, which has a length of 580 km between Karlıova and Hatay, has a very significant role in the geodynamic evolution of the Anatolian block and Turkey's earthquake (Arpat and Şaroğlu, 1972; McKenzie, 1976; Taymaz et al., 1991; Herece and Akay, 1992; Şaroğlu et al., 1992; Nalbant et al., 2002; Aksoy et al., 2007; Bulut et al., 2012; Kartal and Kadiroğlu, 2013; Bulut, 2017; Demirtaş and Erkmen, 2019). The westward movement of the Anatolian Plate causes a left-lateral deformation of around 4-13 mm / year on the EAFZ and slipping where friction is low. The tectonic studies along the EAFZ carried out that the fault with a slip distribution around 9-40 km has actively moved in the left lateral character for the last 3-5 million years (Arpat and Saraglu, 1972; Hempton, 1985; Dewey et al., 1986; Allen et al., 2004; Herece and Akay, 1992; Aksoy et al., 2007; Demirtaş and Erkmen, 2019). DAFZ, which has a deeper seismogenic zone than the NAFZ, produces earthquakes reaching depths of about 26 km (Bulut et al., 2012). In the instrumental period, on the DAFZ, which bordered the Anatolian Plate from the south and consisted of many segments, the earthquakes of 6.5 (Ms) and above on the Karlıova-Bingöl and Hazar- Sincik segments 1971 Bingöl and 2020 Sivrice earthquakes occurred respectively. Demirtaş and Erkmen (2019) suggested that an earthquake should be expected on the segments that continue in the north-east or south-west of Sivrice on the EAFZ, which consists of six fault segments. After the last Sivrice Earthquake, a seismic gap has occurred between the Hazar-Sincik fault and the Bingöl-Karlıova fault. In terms of earthquake safety of the cities and extensive facilities along the EAFZ, it has become essential to determine which segments these seismic gaps cover and what kind of earthquake behavior the zone will exhibit soon. In terms of the cities` earthquake safety and ample facilities located along the EAFZ, it has become essential to determine which segments these seismic gaps cover and what kind of earthquake behavior the zone will exhibit shortly. The changes in attenuation and seismic velocity along the zone will help determine the earthquake behavior (Jordan et al., 2011). The attenuation of seismic waves in the crust is the decrease in wave energy with time and distance due to heterogeneity and/or inelastic effect within the crust (Aki and Chouet, 1975; Sato, 1977; Aki, 1980; Pulli, 1984; Sato and Fehler, 1998; Aydın et al., 2020). The decrease in wave energy depends on the density of the medium and the scattering. The attenuation in the crust varies depending on these features. Absorption is high in the altered zones, in the areas with high volcanic activity, in the places with high fault zones and discontinuities, in other words, environments with low seismic velocities medium. Seismic waves are scattered in the areas with high heterogeneity. In this study, the attenuation of P and S waves ( and and the degree of frequency dependence () are determined according to the environment`s characteristics during wave propagation. Elastic wave propagation and decay relationship are used to determine these changes. According to the results obtained using the data collected until the end of 2019, it was observed that the attenuation on the Hazar-Sincik fault, where the Sivrice earthquake occurred, was low. Based on these results, it has been determined that the earthquake behavior will be exhibited on other segments on the EAFZ. 20
European International Journal of Science and Technology Vol. 9 No. 11 November 2020
2. The Tectonics and seismicity of the Eastern Anatolian Fault Zone
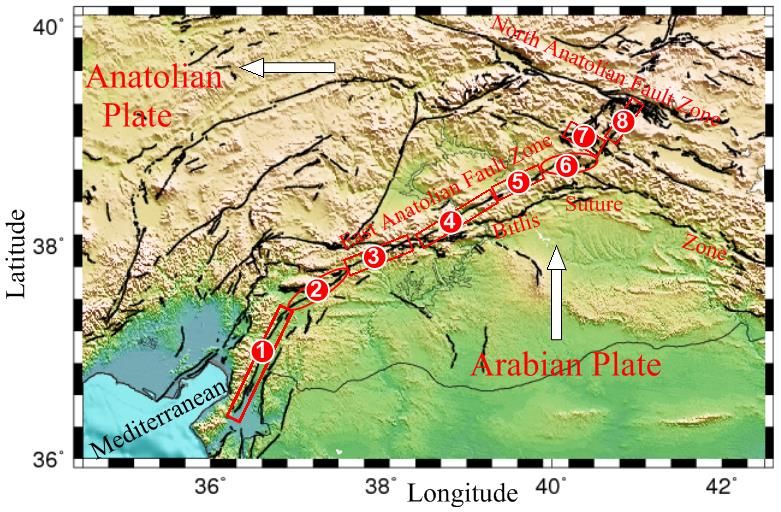
The EAFZ, extending between Karlıova in the northeast and Hatay in the southwest, approximately 600
km in length, is consisted of 6 different fault segments with lengths varying between 50 km and 145 km
(Herece2003; Demirtaş 2003; Demirtaş and Erkmen, 2019). The Türkoğlu-Antakya fault, given as number 1
in Figure 1, is approximately 145 km long and has a strike of N30-35E. The Gölbaşı-Türkoğlu fault, given
as the number 2, extends between Gölbaşı and Türkoğlu, approximately 90 km in length, and its strike is
N55E. The fault extending between Çelikhan and Gölbaşı and shown as five numbered is called the
Çelikhan-Gölbaşı segment and this fault has a length of approximately 50 km and a strike of N65E. The
Hazar-Sincik fault, where the 2020 Sivrice earthquake occurred and shown as number 4, is about 85 km
long and extends between Lake Hazar and Sincik, and consists of two sub-sections. The northern part
striking N60E is located between Lake Hazar and Doğanyol. The Palu-Hazar fault, shown as five the
number, is approximately 50 km long with the N60E strike and is located between Palu and Lake Hazar. The
Karlıova-Bingöl fault, where the 1971 Bingöl earthquake occurred, extends between Karlıova and Bingöl.
This segment, which has a strike of N50E, has a length of approximately 65 km and is shown as number 8 in
Figure 1. The segment not named and given the number 6 is the intersection zone between Yayla fault
(MTA, 2013) and EAFZ (Fig. 1). On the other hand, the fault given number 7 indicates the 2003 Bingöl
earthquake segment (Demirtaş 2003; Demirtaş and Erkmen, 2019). This segment has the same strike of the
Yayla Fault (Fig. 1).
Figure 1- It is the map of the segments belonging to the Eastern Anatolian Fault Zone (EAFZ) (Demirtaş
and Erkmen, 2019). The arrows show the plate directions. The segments, shown with a red rectangle and
ellipse, are 1) Türkoğlu-Antakya Segment, 2) Gölbaşı-Türkoğlu Segment, 3) Çelikhan-Gölbaşı Segment, 4)
Hazar-Sincik Segment, 5) Palu-Hazar segment, 8) Karlıova-Bingöl segment. The number 6 is not named
here, but it is one of the region`s seismic gaps. Segment number 7 shows the fault segment of the earthquake
that occurred on May 1, 2003.
21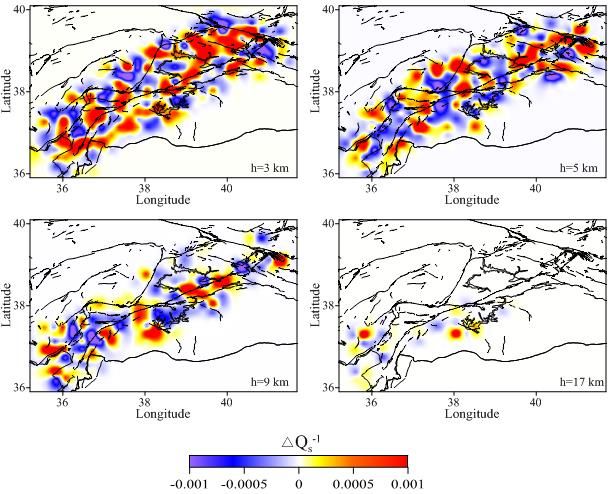
European International Journal of Science and Technology           ISSN: 2304-9693          www.eijst.org.uk

   The total left lateral offset along the EAFZ is between 15 and 22 km (Arpat and Şaroğlu 1972, Herece
2003). According to geological data, the age of EAFZ is the Upper Pliocene and has an average slipping
velocity of 5-8 mm / year (Herece 2003, Demirtaş and Erkmen, 2019). Due to no paleo seismological studies
that have been carried on the EAFZ, it is stated that there is not enough information about the behaver of the
different fault segments on the zone (Demirtaş and Erkmen, 2019). Using historical earthquake data, it has
been stated that there are two seismic gaps between Gölbaşı-Türkoğlu and Palu-Bingöl in EAFZ (Barka ve
Kadinsky-Cade, 1998; Nalbant et al., 2002; Demirtaş, 2003).

   One of the earthquakes that occurred in the historical period on the segments that shape the Eastern
Anatolian Fault Zone and given above as numbered (Fig. 1) is the 1822 Antakya Earthquake (Ms = 7.5), and
it was stated that it caused approximately 200 km surface rupture (Demirtaş and Erkmen, 2019). The
Karlıova-Bingöl Earthquake (Ms = 7.2), which occurred in 1866, caused approximately 45 km of surface
rupture. The Bingöl earthquake (Ms = 6.8) occurred on the same fault on May 22, 1971. Historical period
earthquakes are the 1872 Amik Lake Earthquake (Ms = 7.2, approximately with 20 km surface rupture),
1874 and 1875 Hazar Lake Earthquakes (Ms = 7.1 and Ms = 6.7 45 and 20 km surface rupture) and 1893
Malatya Earthquake (Ms = 7.1) (Kartal and Kadiroğlu, 2013; Demirtaş and Erkmen, 2019). Earthquakes
started from the NE end of the EAFZ and movement towards the SW. The general distribution of historical
earthquakes is concentrated in the middle and NE parts of the EAFZ. There has not been a devastating
earthquake that has caused surface ruptures in the last 500 years on the Gölbaşı-Türkoğlu segment where the
fault folds into the SW (Fig. 1) (Demirtaş and Erkmen, 2019).

   According to the historical records, two damaging earthquakes occurred on the Gölbaşı-Türkloğlu fault
(segment number 2 in Figure 1) in 1114 and 1513 on the EAFZ. After the earthquake that occurred in 1789
on the segment numbered 6, no significant activity occurred (Kartal and Kadiroğlu, 2013; Demirtaş and
Erkmen, 2019). After 1789, on the segments of Türkoğlu-Antakya in 1822 and 1872 (segment number 1),
Palu-Caspian (segment number 5) in 1874, Hazar-Sincik in 1875 (segment number 4 where the Sivrice
earthquake occurred in 2020), Çelikhan-Gölbaşı in 1893 and 1905 Earthquakes have occurred on the
segment.

   In the instrumental period, the earthquakes occurred in 1971 (Ms = 6.8) on the segment of Karlıova-
Bingöl (segment number 8), in 2003 in Bingöl (Mw = 6.4) (segment 7), and in 2020 in Elazığ-Sivrice (Mw
= 6.8) the Caspian-Sincik segment (segment number 4) (AFAD, 2020). Meanwhile, an earthquake of 5.2
(Mw) occurred on the Caspian-Sincik segment on April 4, 2019. It is observed that Ms = 6.7 and bigger
earthquakes occurred on the faults that make up the EAFZ in the historical period (AFAD, 2020). In the
instrumental period, the magnitude of the most massive earthquake is 6.8 (Ms) in the EAFZ. It can be said
that the middle and NE part of the EAFZ are more active with respect to seismotectonic in the instrumental
period. On the other hand, in the historical and instrumental earthquake activity of the DAFZ, it is observed
that the Gölbaşı-Türkoğlu fault is silent in terms of seismic activity (Kartal and Kadiroğlu, 2013). Besides,
there is no earthquake on the 2 and 6 segments, and there is a seismically silent phase on these segments
(Fig. 1).

3. Data and Method
   In this study, to determine the P and S wave attenuation structure along the Eastern Anatolian Fault Zone
(EAFZ), 4474 digital signals (P and S phases) belonging to 922 earthquakes that occurred between the
coordinates 35.2-41.7 E and 35.9-40.1 N were has been analyzed (Fig. 2). The data set is recorded by the
22
European International Journal of Science and Technology                Vol. 9 No. 11          November 2020

three-component broadband stations coded as ARPR, BNGB, CEYT, DARE, ERZN, GAZ1, GAZ, KARO,
KHMN, KMRS, KOZT, KRTD, KRTS, MALT, PTK, SVRC, TAHT, URFA, VRTB, SEVEN, BINT,
MYA, EZC, HTY, YURE, DORT and YAYL operated by Kandilli Observatory and Earthquake Research
Institute (KOERI) (Fig. 3). The stations are marked as yellow triangles in Figure 3. The response function of
seismographs is between 0.02 and 100 Hz. The local magnitudes (ML) of the earthquakes are between 1 and
6.1 (Fig. 2). In determining the attenuation structure, the earthquakes` signal to noise ratio was taken as 1.5
and higher. The ray paths of earthquakes are given in Figure 3.

Figure 2- It is the map of the epicenter distribution of earthquakes used in the study. Here the black lines
denote the fault lines.

   The initial model for the checkerboard test is designed according to the changing the horizontal and
vertical cell spacing and velocity distributions, the width of the study area, and the possible velocity changes
in the region (Fig. 4). This model is tested much time according to the features mentioned above. As a result
of these tests, it was observed that the study area was gridded at 0.44 * 0.33 ° horizontally and 0.5 km
vertically, and when divided into cells consisting of positive and negative anomalies, relevant results were
obtained at depths of 3, 5, 9 and 17 km (Fig. 5). Model depth has been designed to the depth of 30 km to
complete the ray paths in the study area. Amplitudes for P and S wave attenuation anomalies were
determined as ± 0.001 (Fig. 4).

                                                                                                             23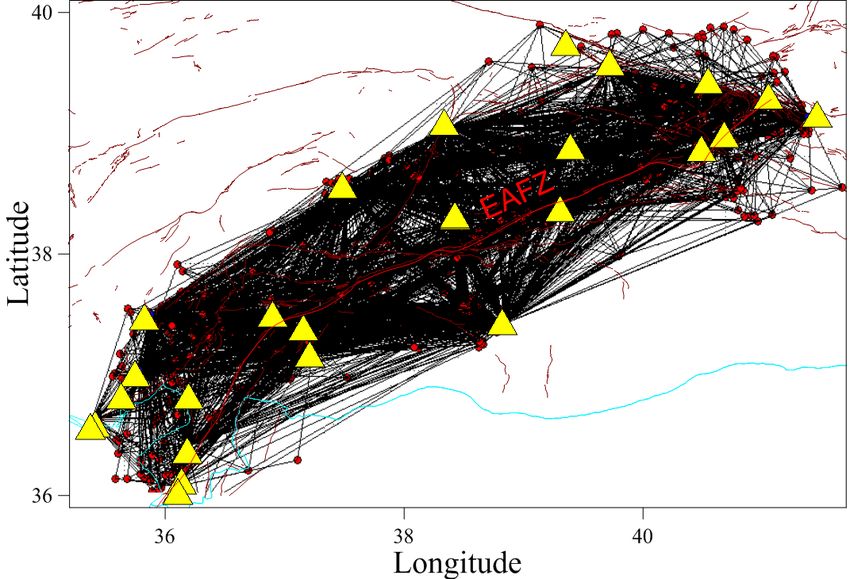
European International Journal of Science and Technology           ISSN: 2304-9693          www.eijst.org.uk

Figure 3- Ray paths created in determining P and S wave attenuation values                and         In here,
brown lines denote faults, and yellow triangles denote earthquake stations. EAFZ denotes the East Anatolian
Fault Zone, and vertical sections (given in Figure 11-16) were taken along this line has given red color.

The "Coda Normalization Method", based on the ratio of the vertical component P and S wave amplitudes to
the noise and the coda wave amplitudes separately, was used to demonstrate the three-dimensional
attenuation structure in a tomographic method. To determine the attenuation as tomographic, MuRATv.2
program is used developed by De Siena et al. (2009) based on Matlab code (De Siena et al., 2016; 2017).

Figure 4- The checkerboard resolution model for P and S wave attenuation            ve
24
European International Journal of Science and Technology Vol. 9 No. 11 November 2020
Figure 5- The interval of grid spacing as horizontal (top) and vertical (bottom). The grid spacing are 0.44 °
x 0.33 ° in the horizontal direction and -3, -5, -9 - 17 km in the vertical direction.
Table 1- The initial velocity model was used to determine attenuation values ve (Kalafat et
al., 1987)
Depth (km) Vp (km/sec) Vs (km/sec)
0 4.50 2.60
5.4 5.91 3.42
31.6 7.80 4.51
89.0 8.30 4.80
MuRATv.2 is prepared based on the approach of Del Pezzo et al. (2006). This approach is also based on
the “Coda Normalization Method” model of Aki (1980) and Frankil et al. (1990). This method assumes that
the average source size and ground amplification calculated from many earthquake data spread in different
directions are independent of the source-receiver direction, and the average value varies geographically
(Aki, 1980). According to this; by using the spectral amplitude of the P wave by the noise spectral amplitude
and the spectral amplitude of the S wave by the spectral amplitude of the coda wave, the effects of the
source, ground and instrument are eliminated. The attenuation values ( ve ) are calculated from
the reducing of the P and S wave amplitude of the crust caused by inelastic conditions or scattering at each
station (Aki, 1980; Frenkal et al., 1990). The amplitude spectra were calculated by selecting P and S waves
and Δt = 2-sec lengths of noise and coda waves, respectively. This process is given the equation (1) (Aki,
1980; Frenkal et al., 1990);
⟨ { }⟩ (1)
Where D is the source-receiver distance, is the geometric scattering effect, Ap,S(f) is the spectral amplitude
of the P and S wave, and AN,c(f) is the noise and coda wave spectral amplitude, respectively. The coda
25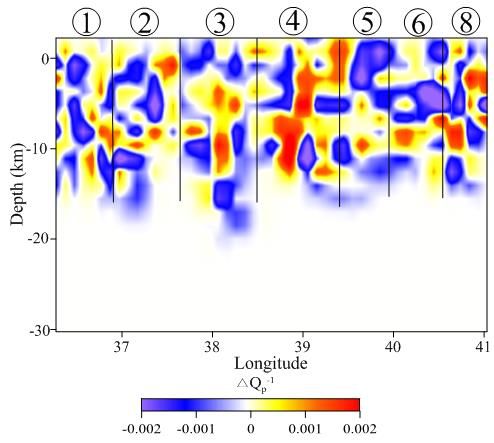
European International Journal of Science and Technology              ISSN: 2304-9693           www.eijst.org.uk

normalization method is widely used to calculate the attenuation in the earth's crust independent of soil and
instrumental transfer functions (Aki, 1980; Sato and Fehler, 1998; Şahin and Alptekin, 2003; Aydın et al.,
2012). With Del Pezzo et al. (2006) model, the attenuation of P and S waves in the EAFZ was determined
for certain depths along each ray path (Fig. 3). The equation of energy reduction used in this study is given
below;

                        [       ∫         ]                                                   (2)

With the application of linear integral by taking the logarithms of both sides, the equation (3) is obtained as
below.

            (       )   ∑                                                                     (3)

Where the      value is the logarithm of the spectral ratio between P with noise and S with coda determined
for the ray path length and is gridded for the given metric range, the gridded N cells are the total number of
blocks crossed by the ray path. lkb is the length of the k th ray path intersecting the b block characterized by
Sb and quality factor Q. In equation (3), k represents the ray path between the hypocenter of the earthquake
and the station. As in equation (3),         and       values are calculated for the whole region by dividing
    equal to the whole area`s average quality factor. The attenuation values are calculated for a central
frequency value. In this study, the frequency band is between 12 and 24 Hz, and the central frequency value
as 18 Hz. The details of the method are given in De Siena et al. (2009). By comparing the spectral
amplitudes of the P and S waves to the noise and code wave amplitudes separately, the seismic attenuation
values were determined along the EAFZ. In this way, the discontinuities in the crust and the tectonic
structures have been determined. In the method developed by De Siena et al. (2009) (MuRATv.2), P and S
wave attenuation values are determined depending on the velocity structure in the crust (De Siena et al.,
2016; 2017; Şahin and Öksüm, 2020).

4. Results
   The checkerboard test was applied to determine the attenuation structure`s resolution along the EAFZ
(Fig. 6-7). Initially, the checkerboard resolution model was designed (Fig. 4), and resolution tests were
applied according to the velocity model given in Table 1. Parameters for the matrix before the inverse
process are determined according to the station and earthquake distribution of the region examined, and the
number of rays. For this reason, during the synthetic tests step, specific parameterization is made for the
study area, and its effects on the results are investigated. The working area`s checkerboard test is divided
into square/rectangular prisms of certain sizes (Fig. 4-7). Each of these prisms is assigned negative/positive
or low/high absorption values. Then, by taking into account the phase reading errors, noise is added to the
synthetic travel times, and as a result of the inverse solution, it is checked whether these prisms can/cannot
be recovered synthetically. The seismic model produced by synthetic travel times is thought to be unknown,
and the inverse process has been performed using a new initial model. In this way, the checkerboard model
used in the beginning was tried to be obtained. If the sufficient resolution is not obtained, the test is repeated
by changing the square / rectangular prism (Özer et al., 2018). In this study, to determine the           ve
values, the attenuation amplitudes were designed as ± 0.001 for each prism, respectively (Fig. 6-7).

26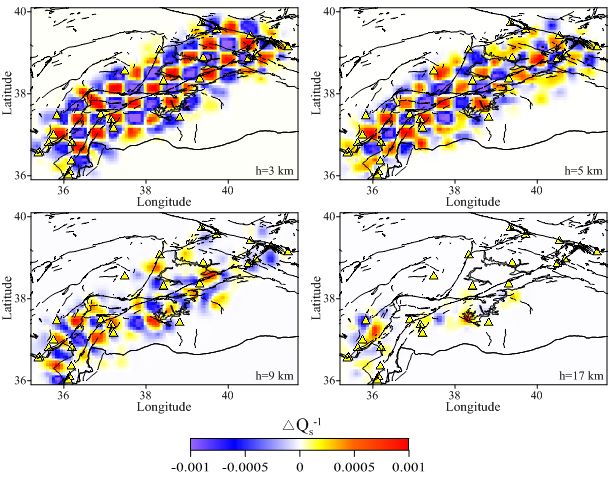
European International Journal of Science and Technology Vol. 9 No. 11 November 2020
According to the checkerboard results, the resolution decreases in the number of ray paths due to the low
number of stations and the number of earthquakes, and the low intensity of earthquakes towards deeper.
By applying the inversion solution test technique to the arrival times of P and S waves of local
earthquakes occurring between 35.2-41.7 E and 35.9-40.1 N coordinates, the three-dimensional attenuation
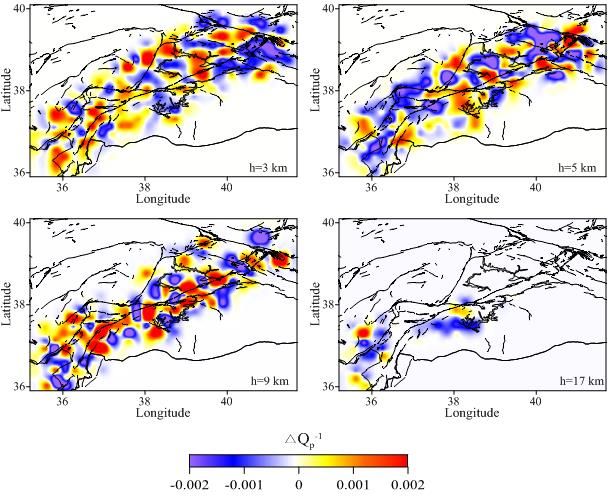
structure was determined along the EAFZ (Fig. 8-9). According to the obtained results obtained, it was
determined that attenuation was low in the Caspian-Sincik segment (segment 4 in Figure 1), where the 24
January 2020 Sivrice earthquake occurred.
Although and values show a spatial distribution in areas close to the surface, in the deeper
part of crust, they change according to the faults in the studying region. The results obtained from geodetic
studies have also suggested that the slip reaches a depth of 20 km (Melgar et al., 2020). There is a decrease
in the attenuation values ( ve ) in the Karlıova region. Besides, the existence of similar attenuation
structures is observed on the Türkoğlu-Antakya segment where two significant earthquakes occurred in
1822 and 1872 in Hatay, on the Adana Basin where the 1945 and 1998 earthquakes occurred, on the
Gölbaşı-Türkoğlu where the 1513 and 1114 earthquakes occurred and Karlıova were the 1866 and 1971
earthquakes occurred. The results obtained are consistent with previous studies (İmamoğlu and Çetin, 2007;
Yalçın et al., 2012; Jamalreyhani et al., 2020). It has been observed that the obtained values of and
are compatible with the heat flow values (Çırmık, 2018). It is possible to say that the mantle material
approaches the surface in this region. It has been determined that the slip velocity on the EAFZ is mostly on
the Caspian-Sincik segment, and the velocities obtained from the fault periphery are concentrated in the
Bingöl-Karlıova region (Bulut, 2017).
Figure 6- P-Wave attenuation ( ) checkerboard test results at 3km, 5 km, 9 km and 17 km depths.
27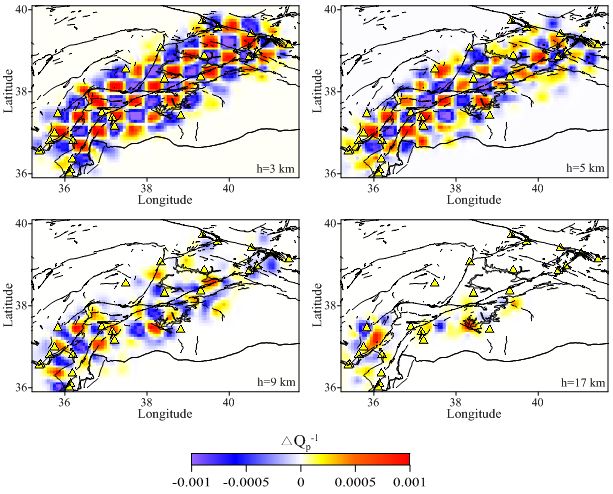
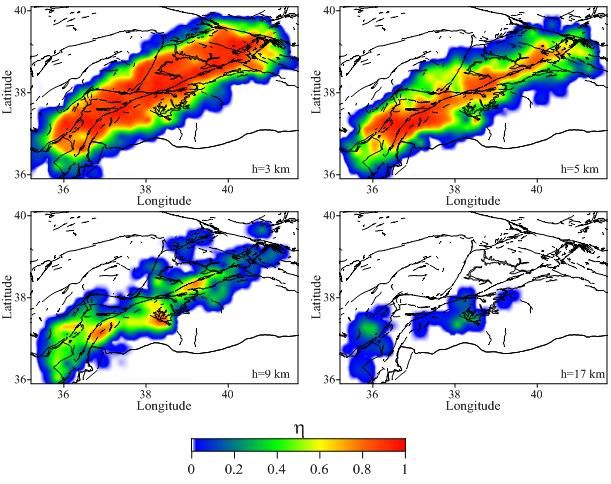
European International Journal of Science and Technology ISSN: 2304-9693 www.eijst.org.uk Figure 7- S-Wave attenuation checkerboard test results at 3km, 5 km, 9 km and 17 km depths The vertical section of attenuation for P and S waves and frequency dependency was determined by taking a cross-section along the EAFZ (Fig. 11-13). The increase of x up to 1 on this segment indicates that seismotectonic activity is high here. Increasing up to 1 on the EAFZ indicates that seismotectonic activity is high (Fig. 13). In the sections taken along the EAFZ, it was observed that the attenuation effect was most in-depth in the Caspian-Sincik segment that occurred on January 24, 2020, earthquake. It has been determined that this effect is reached to the depth of 20 km, but the seismic velocity change is reached to the 36 km in the region (Salah et al., 2011; Salah and Şahin 2019). On the other hand, the earthquake activity is high on the Gölbaşı-Türkoğlu (number 2), Bingöl-Karlıova (number 8), and the unknown segment number 6 on the EAFZ (AFAD, 2020). 28
European International Journal of Science and Technology Vol. 9 No. 11 November 2020
Figure 8- The spatial distribution of P wave attenuation ( ) values at 3, 5, 9 and 17 km depths and its
relation with tectonic structure.
Figure 9- The spatial distribution of S wave attenuation values at 3, 5, 9 and 17 km depths and its
relation with tectonic structure.
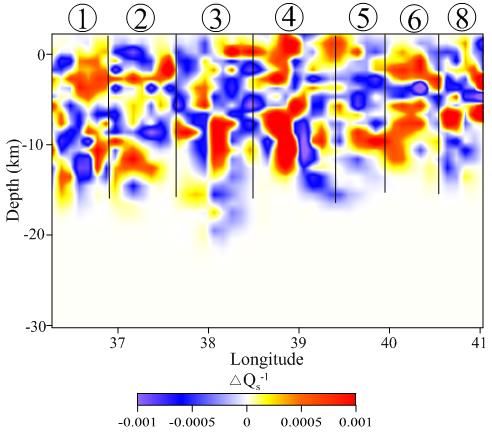
29European International Journal of Science and Technology ISSN: 2304-9693 www.eijst.org.uk Figure 10- The spatial distribution of frequency dependency () values at 3, 5, 9 and 17 km depths and its relation with tectonic structure. Figure 11- The variation of P wave attenuation values ( ) in the vertical direction along the EAFZ. Here, the segment numbers on the section are the same as in Figure 1. 30
European International Journal of Science and Technology Vol. 9 No. 11 November 2020
Figure 12- The variation of S wave attenuation values in the vertical direction along the EAFZ.
Here, the segment numbers on the section are the same as in Figure 1.
Figure 13- The variation of frequency dependency values () in the vertical direction along the EAFZ.
Here, the segment numbers on the section are the same as in Figure 1.
31European International Journal of Science and Technology ISSN: 2304-9693 www.eijst.org.uk Besides, 3-dimensional vertical sections were taken to determine the change of , and values during EAFZ (Figs. 14-16). It has been observed that these values are changing according to the seismogenic structures in the studying region. It is observed that and value, and the frequency-dependency values obtained from the depth of 20 km and 15 km in the vertical sections along the EAFZ, respectively (Figs. 14-16). It is seen that the three values reache the most profound part in the segments of Çelikhan-Gölbaşı (segment number 3 in Fig. 1), Caspian-Sincik (segment number 4 in Fig. 1), and Palu-Hazar (segment number 5 in Fig. 1) (Figs. 11- 16). The changes in attenuation and frequency dependency values have been revealed clearly. According to these results and the 2020 Sivrice earthquake coulomb stress change (Jamalreyhani et al., 2020), the active seismicity on the EAFZ should be expected to be in the Palu-Caspian segment. The changes in attenuation and values are in that direction. This situation is seen in vertical sections. Besides, to make this study sustainable, it will be useful to follow the changes in the EAFZ with additional data. Figure 14- The 3-D variation of P wave attenuation values ( ) in the vertical direction along the EAFZ. 32
European International Journal of Science and Technology Vol. 9 No. 11 November 2020
Figure 15- The 3-D variation of S wave attenuation values in the vertical direction along the EAFZ.
Figure 16- The 3-D variation of frequency dependency values () in the vertical direction along the EAFZ.
33European International Journal of Science and Technology ISSN: 2304-9693 www.eijst.org.uk
5. Conclusions
The three-dimensional , and values were determined as tomographic and based on the Coda
Normalization Method using 4474 P and S wave signals from travel time inversion of local earthquakes
collected from 27 stations operated by KOERI along the EAFZ. The checkerboard resolution test results, the
number of rays, and the ray path’s maps show that the attenuation anomalies obtained are reliable reaches to
the depth of about 20 km.
The vertical longitudinal sections were taken along the EAFZ in the study area, and it was observed that
the change of , and values are compatible with the tectonism. It indicates that the attenuation
and frequency dependence is high, the crust does not lose its heterogeneity with depth, and a complex
structure or upper mantle material that increases attenuation is close to the upper part of the crust. ,
and values vary significantly according to the heterogeneous structure in the upper crust. These
heterogeneities are shaped depending on the tectonics of the region. The high level of indicates that
heterogeneity is not lost with depth, and there is a complex structure that increases attenuation.
The data used in this study is collected for the period until the end of 2019. In other words, it covers the
period until Sivrice earthquake on January 24, 2020, and shows that the stress accumulation occurred on the
Caspian-Sincik segment where this earthquake occurred. Along the EAFZ, the value varies within the
range of ± 0.002 and the value within the range of ± 0.001. In general, positive attenuation values
refer to heterogeneous medium in the crust.
Adding the 2020 data to the existing data can be followed in which segment the stress accumulation
occurs on the EAFZ. Knowing the earthquake behavior of the EAFZ soon is of vital importance for the
reduction of earthquake damages in the region where many cities with a significant population and
significant facilities for the economy of the country are located.
Acknowledgements
The author thanks Wessel and Smith (1998), who prepared the GMT (Generic Mapping Tools) program
used in the preparation of the figures, to Prof. Dr. Orhan Polat (Dokuz Eylül University, Geophysical
Division) for her contribution in using the program, and to Dr. Luca De Siena who prepared MuRATv.2
used in determining the attenuation structure.
References
[1] AFAD, 2020. Report on 24 January 2020 Sivrice (Elazığ) Mw 6.8 Earthquake, Disasterand Emergency
Management Presidency of Turkey, Ministry of Interior, Ankara, Turkey, Open File Rep., 46 p.
[2] Aki, K.. 1980. Scattering and attenuation of shear waves in the litosphere. Journal of Geophysical
Research, 85, 6496-6504.
[3] Aki, K. Chouet, B. 1975. Origin of Coda wave: Source, attenuation and scattering effects, Journal of
Geophysical Research, 80, 21, 3322-3342.
[4] Aksoy, E. Incegöz, M. Kocyigit, A. 2007. Lake Hazar Basin: a negative flower structure on the East
Anatolian Fault System (EAFS), SE Turkey. Turk. J. Earth Sci. 16, 319–338.
[5] Allen, M. Jackson, J. Walker, R. 2004. Late Cenozoic reorganization of the Arabia–Eurasia collision and
the comparison of short-term and long-term deformation rates. Tectonics 23, 1, TC2008.
[6] Arpat, E. Şaroğlu, F. 1972. Doğu Anadolu Fayı ile ilgili bazı gözlemler, MTA dergisi, 78, 44-50.
34European International Journal of Science and Technology Vol. 9 No. 11 November 2020
[7] Aydın, U. Şahin, Ş. Kalkan, E. 2012. Yarbaşı, N., Aksoy, G., Kemaliye çevresinde Pg, Sg Soğurulması
ve yeni magnitüd fomülü, Fen Bilimleri Dergisi, 16, 1, 13-23.
[8] Aydın, U. Şahin, Ş. Salah, M.K. 2020. Upper crustal Poisson's ratio and coda-wave attenuation beneath
Eastern Anatolia, Earthq Eng & Eng Vib. 19, 335-347.
[9] Barka, A.A. Kadinsky-Cade, K. 1988. Strike-slip fault geometry in Turkey and its influence on
earthquake activity. Tectonophysics 7, 663–684
[10] Bulut, F. Bohnhoff, M. Eken, T. Janssen, C. Kılıc, T. Dresen, G. 2012. The East Anatolian Fault Zone:
Seismotectonic setting and spatiotemporal characteristics of seismicity based on precise earthquake
locations, J. Geophys. Res., 117, B07304, https://doi.org/10.1029/2011JB008966.
[11] Bulut, F. 2017. Doğu Anadolu Fayı boyunca Sismik ve A-sismik Tektonik Hareketler: Hazar Gölü
Doğu’sunda Sismik Boşluk mu yoksa Krip mi? AKÜ FEMÜBİD 17 015803 (257-263).
[12] Çırmık, AY. 2018. Examining the crustal structures of eastern Anatolia, using thermal gradient, heat
flow, radiogenic heat production and seismic velocities (Vp and Vs ) derived from Curie Point depth,
Examining the crustal structures of eastern Anatolia, 59, 2, 117-134.
[13] De Siena, L.Del Pezzo, E. Bianco, F. Tramelli, A.2009. Multiple resolution seismic attenuation imaging
at Mt. Vesuvius, Physics of the Earth and Planetary Interiors 173, 17–32.
[14] De Siena, L. Calvet, M. Watson, K.J. Jonkers A.R.T. Thomas, C. 2016. Seismic scattering and
absorption mapping of debris flows, feding paths, and tectonic units at Mount St. Helens volcano,
Earth and Planetary Science Letters, 442, 21-31.
[15] De Siena, L. Amoruso, A. Del Pezzo, E. Wakeford, Z. Castellano, M. Crescentini, L. 2017. Space-
weighted seismic attenuation mapping of the aseismic source of Campi Flegrei 1983–1984 unrest,
Geophys. Res. Lett., 44, 1740–1748, doi:10.1002/2017GL072507.
[16] Del Pezzo, E. Bianco, F. De Siena, L. Zollo, A., 2006. Small scale shallow attenuation structure at Mt.
Vesuvius. Phys. Earth Planet. Inter. 157, 257–268.
[17] Demirtaş, R. 2003. DAFZ’nda Deprem Üreten Diri Faylar; 1900-2003 Yılları Arasında Doğu Anadolu
Fay Zonunda Olmuş Hasar Yapıcı Depremler. Deprem ve Kentleşme. 23-24-25 Eylül 2003,
TMMOB Jeoloji Müh. Odası yayınları 78, Konferans serisi 3.
[18] Demirtaş, R. Erkmen, C. 2019. Doğu Anadolu Fay Sistemi Deprem Etkinliği, Gelecek Deprem
Potansiyeli, Researchgate DOI: 10.13140/RG.2.2.24235.49449.
[19] Demirsıkan, İ.H. Şahin, Ş. Öksüm, E. 2019. Orta Anadolu’da kabuğa ait sismik P ve S dalga hızı
yapısının belirlenmesi, Pamukkale Universitesi, Mühendislik Bilimleri Dergisi, 25, 6, 775-784,
[20] Dewey, J.F. Hempton, M.R. Kidd, W.S.F. Saroglu, F. Sengör, A.M.C. 1986. Shortening of continental
lithosphere: the neotectonics of eastern Anatolia: a young collision zone. In: Coward, M.P., Ries,
A.C. (Eds.), Collision Tectonics. Geol. Soc. Lond. Spec. Publ. 19, 3–36.
[21] Frenkal, A. Mcgarr, A. Bicknell, J. Mri, J, Seeber, L. Cranswick, E. 1990. Attenuation of high-
frequency shear waves in the crust: measurements from New York State, South Africa and Southern
California. Journal of Geophysical Research, 95, 17441-17457.
[22] Hempton, M.R. 1985. Structure and deformation history of the Bitlis sture near Lake Hazar, south
eastern Turkey. Geol.Soc.Am.Bull. 96, 233–243.
[23] Herece, E. 2003.Doğu Anadolu Fayı. Antakya ve Osmaniye’nin Depremselliği ve Kentleşmeye
Etkileri. 26-27 Haziran 2003, TMMOB Jeoloji Müh. Odası yayınları 76, Konferans serisi 1.
[24] Herece, E. Akay, E. (1992) Karlıova-Çelikhan arasında Doğu Anadolu Fayı, Türkiye 9. Petrol
Kongresi, 361-372.
[25] İmamoğlu, M.Ş. Çetin, E. 2007. Güneydoğu Anadolu Bölgesi ve yakın yöresinin depremselliği,
D.Ü.Ziya Gökalp Eğitim Fakültesi Dergisi 9, 93-103.
35European International Journal of Science and Technology ISSN: 2304-9693 www.eijst.org.uk
[26] Jamalreyhani, M. Büyükakpınar, P. Cesca, S. Dahm, T. Sudhaus, H, Rezapour, M. Isken, M.P.
Asayesh, B.M. Heimann, S. 2020. Seismicity related to the eastern sector of Anatolian escape
tectonic: the example of the 24 January 2020 Mw 6.77 Elazığ-Sivrice earthquake, Solid Earth,
https://doi.org/10.5194/se-2020-55.
[27] Jordan, T. Chen, Y. Gasparani, P. Madariaga, R. Main, I, Marzocchi, W. Papadopoulos, G. Sobolev, G.
Yamaoka, K.. Zcchau, J. 2011. Operational earthquake forecasting: State of knowledge and
guidelines for utilization, Annals of Geophysics, 54, 4, 2011; doi: 10.4401/ag-5350
[28] Kalafat, D. Gürbüz, C. Üçer, S.B. 1987. Batı Türkiye’de Kabuk ve Üst Manto Yapısının Araştırılması.
Deprem Araştırma Bülteni 59, 43–64.
[29] Kartal, R.F. Kadiroğlu, F.T. 2013. Doğu Anadolu Fayının sismotektoniği ve bu fay üzerindeki son beş
yıllık deprem aktivitesinin istatistiksel analizi, 66. Türkiye Jeoloji Kurultayı 01-05 Nisan 2013,
ODTÜ Kültür ve Kongre Merkezi, Ankara
[30] KRDAE-Kandilli Rasathanesi ve Deprem Araştırma Enstitüsü, Dataset/Seismic Network. doi:
10.7914/SN/KO, Çengelköy, İstanbul, http://www.koeri.boun.edu.tr. 30 Ocak 2020.
[31] Melgar, D. Ganas, A. Taymaz, T. Valkaniotis, S. Crowell, B. W. Kapetanidis, V. Tsironi, V. Yolsl-
Çevikbilen, S. Öcalan, T. 2020. Rupture Kinematics of January 24, 2020 Mw 6.7 Doğanyol-Sivrice,
Turkey Earthquake on the East Anatolian Fault Zone Imaged by Space Geodesy, Manuscript
submitted to, Earth and Planetary Science Letters, DOI: 10.31223/osf.io/xzg9c.
[32] Mc Kenzie, D.P. 1976. The East Anatolian Fault, a major structure in Eastern Turkey. Earth and
Planetory Sciences, 29, 189-193.
[33] MTA. 2013.Türkiye Diri Fay Haritası. Maden Tetkik Arama Genel Müdürlüğü, Ankara.
[34] Nalbant, S. McCloskey, J. Steacy, S. Barka, A. 2002. Stree accumulation and increased seismic risk in
eastern Turkey. Earth and Planetary Science Letters, 195, 291-298.
[35] Ozer C. Gok E. Polat O. 2018. Three-Dimensional Seismic Velocity Structure of the Aegean Region of
Turkey from Local Earthquake Tomography, Annals of Geophysics, 21 (61), 2018.
[36] Pulli, J.J. 1984. Attenuation of coda waves in New England, Bulletin of the Seismological Society of
America, 74, 4, 1149-1166
[37] Sato, H., 1977. Energy propagation including scattering effects single isotropic scattering
approximation. Journal of Geophysical Research, 25, 27-41.
[38] Sato, H. Fehler, M.C. 1998. Seismic Wave Propagation and Scattering in the Heterogenous Earth.
Springer.
[39] Salah M.K. Şahin, Ş. Aydin, U. 2011. Seismic Velocity and Poisson’s Ratio Tomography of the Crust
Beneath East Anatolia,Journal of Asia Earth Sciences, 40, 3, 746–761.
[40] Salah, MK., Şahin, Ş. 2019. 3D crustal velocity and VP /VS structures beneath Southeast Anatolia and
their geodynamic implications, Geofizicheskiy Zhurnal, 2 (41), 122-140.
[41] Şahin, Ş. Alptekin, Ö. 2003. Güneybatı Anadolu’da kabuk ve üst mantoda sismik dalgaların frekans
bağımlı soğurulması, Yerbilimleri, 27 (2), 53-62
[42] Şahin, Ş., Öksüm, E. (2020). Determination of Volcanic Structures in andaround Nevşehir by Seismic
Attenuation Method, Journal of the Faculty of Engineering and Architecture of Gazi University,
35:1, 181-191.
[43] Şaroğlu, F. Emre, Ö. Kuşçu, İ. 1992. The East Anatolian Fault Zone of Turkey. Annal.Tecn., 6, 99-125.
[44] Taymaz, T. Eyidogan, H., Jackson, J.A. 1991. Source Parameters of large earthquakes in the East
Anatolian Fault Zone (Turkey). Geophysical Journal International-Oxford, 106, 537-550.
[45] Yalcın, H. Gulen, L. Cağnan, Z. Kalafat, D. 2012. Kıbrıs ve Yakın Çevresinin Depremselliği. 65.
Jeoloji Kurultayı, Bildiri özetleri Kitabı, s 4-5. Ankara.
36You can also read