Evaluation of Renal Tissue Oxygenation Using Blood Oxygen Level-Dependent Magnetic Resonance Imaging in Chronic Kidney Disease
←
→
Page content transcription
If your browser does not render page correctly, please read the page content below
Research Article

                                                             Kidney Blood Press Res 2021;46:441–451                                        Received: November 25, 2020
                                                                                                                                           Accepted: March 8, 2021
                                                             DOI: 10.1159/000515709                                                        Published online: June 4, 2021

Evaluation of Renal Tissue Oxygenation Using
Blood Oxygen Level-Dependent Magnetic
Resonance Imaging in Chronic Kidney Disease
Fen Chen a, b Han Yan a, b Fan Yang a, b Li Cheng c Siwei Zhang c Shulin Li a
Caixia Liu a Kai Xu c Dong Sun a, b
aDepartment
              of Nephrology, Affiliated Hospital of Xuzhou Medical University, Xuzhou, China; bDepartment of
Internal Medicine and Diagnostics, Xuzhou Medical University, Xuzhou, China; cDepartment of Radiology, Affiliated
Hospital of Xuzhou Medical University, Xuzhou, China

Keywords                                                                                         ney R2* values were positively correlated with kidney func-
Blood oxygen level-dependent · Magnetic resonance                                                tion and inversely correlated with the estimated glomerular
imaging · Chronic kidney disease · Hypoxia · Methods                                             filtration rate and effective renal plasma flow. Whole-Kidney
                                                                                                 R2* value might effectively predict the progression of renal
                                                                                                 function in patients with CKD.          © 2021 The Author(s)
Abstract                                                                                                                                 Published by S. Karger AG, Basel

Background: Blood oxygen level-dependent magnetic reso-
nance imaging (BOLD-MRI) has been widely used to assess
renal oxygenation changes in different kidney diseases in re-                                       Introduction
cent years. This study was designed to evaluate and compare
renal tissue oxygenation using 2 BOLD-MRI analysis meth-                                            The kidney is a highly perfused organ, and the blood
ods, namely, the regional and whole-kidney region of inter-                                      flow in the kidney is mainly distributed in the cortex. The
est (ROI) selection methods. Methods: The study ended up                                         medulla has significantly lower oxygenation because of
with 10 healthy controls and 40 chronic kidney disease (CKD)                                     smaller blood supply and greater oxygen consumption.
patients without dialysis. Their renal BOLD-MRI data were                                        Constant oxygen consumption, microvascular injury,
analyzed using whole-kidney ROI selection method and                                             and inflammation in the renal parenchyma make the kid-
compared with regional ROI selection method. Results: We                                         ney vulnerable to low perfusion and hypoxic damage, re-
found the cortical, medullary, and whole-kidney R2* values                                       sulting in renal interstitial fibrosis and aggravating the
were significantly higher in CKD patients than those in con-                                     progression of kidney disease [1, 2]. Therefore, monitor-
trols. Compared with the regional ROI selection method, the                                      ing of renal oxygenation is helpful for early treatment of
whole-kidney ROI selection method yielded higher cortical                                        kidney disease [3, 4].
R2* values in both controls and CKD patients. The whole-                                            In the 1990s, blood oxygen level-dependent magnetic
kidney R2* values of deteriorating renal function group were                                     resonance imaging (BOLD-MRI) came into being as a
significantly higher than those in stable renal function group.
Conclusions: Cortical and medullary oxygenation was de-
creased significantly in CKD patients compared with the                                          Fen Chen, Han Yan and Fan Yang contributed equally to this work.
healthy controls, particularly in the medulla. The whole-kid-                                    Kai Xu and Dong Sun contributed equally to this work.

karger@karger.com      © 2021 The Author(s)                                                      Correspondence to:
www.karger.com/kbr     Published by S. Karger AG, Basel                                          Kai Xu, xukaixz @ 163.com
                       This is an Open Access article licensed under the Creative Commons
                                                                                                 Dong Sun, sundong126 @ yahoo.com
                       Attribution-NonCommercial-4.0 International License (CC BY-NC)
                       (http://www.karger.com/Services/OpenAccessLicense), applicable to
                       the online version of the article only. Usage and distribution for com-
                       mercial purposes requires written permission.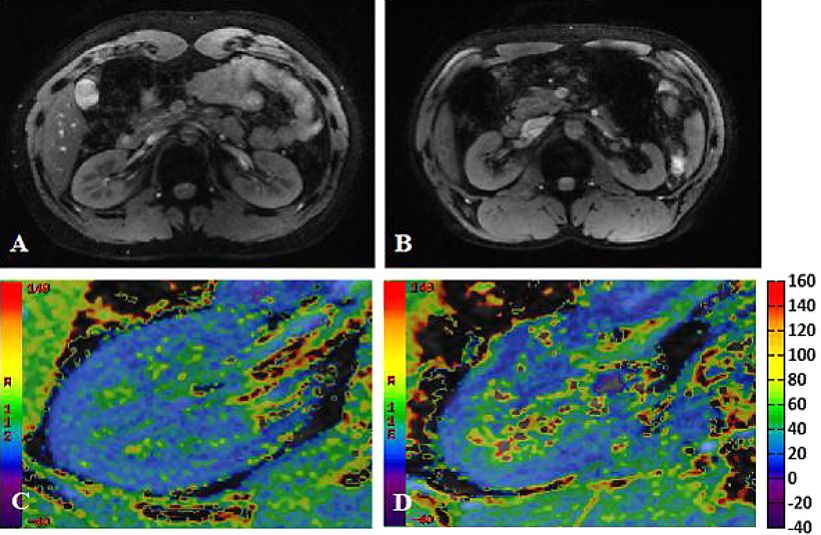
Fig. 1. Forty-two nondialysis patients with
CKD were enrolled in the study, the BOLD
images of 1 patient were lost and the BOLD
images of 1 patient did not conform to the
analysis standard. ECT was performed in
29 CKD patients to evaluate their ERPF.
Ten healthy volunteers were enrolled in the
study. Of the 40 CKD patients included, 29
patients had reexamination of renal func-
tion during 6 months to 1 year. The eGFR
increased or remained unchanged in 15 pa-
tients and decreased in 14 patients. eGFR,
estimated glomerular filtration rate; ERPF,
effective renal plasma flow; ECT, emission
computed tomography.

new technology for the noninvasive evaluation of tissue         threshold of R2* values above 30 s−1 is arbitrary, and this
oxygenation [5]. BOLD-MRI is based on paramagnetic              threshold may not be applicable to other kidney diseases.
deoxyhemoglobin. Deoxyhemoglobin is an endogenous                  In this study, 2 BOLD-MRI analysis methods, called
contrast agent that can affect the signal of T2*-weighted       the regional and whole-kidney ROI selection methods,
MRI scans. As the reciprocal of T2*, R2* is closely related     were used to evaluate renal tissue oxygenation in healthy
to the content of deoxyhemoglobin in tissues (R2* = 1/          persons and CKD patients. The correlations between the
T2*) [6]. An increase in the R2* value indicates a decrease     R2* values and renal function, estimated glomerular fil-
in the partial oxygen pressure, suggesting tissue hypoxia.      tration rate (eGFR), and effective renal plasma flow
   To date, BOLD-MRI has been widely used to assess             (ERPF) in CKD patients were studied to compare the ad-
renal oxygenation changes in different kidney diseases,         vantages and disadvantages of the 2 methods.
including ischemic kidney disease [7], hypertensive ne-
phropathy [8], diabetic nephropathy [9], chronic kidney
disease (CKD) [10], acute kidney injury [11], and renal            Methods
allograft rejection [12]. However, there are still no stan-
                                                                    Subjects
dardized BOLD image analysis methods. For decades, re-
                                                                    The study has been approved by the ethics review board and
searchers have been exploring accurate and reproducible         registered on the Clinical Trials.gov (NCT03321942). All healthy
analysis methods for BOLD-MRI, including regional re-           persons and CKD patients signed informed consent. Ten healthy
gion of interest (ROI) selection [13], compartmental [14],      volunteers at the Medical Examination Center of the Affiliated
fractional tissue hypoxia [15], concentric objects [16],        Hospital of Xuzhou Medical University were recruited from De-
                                                                cember 2015 to December 2017 as controls. At the same time, 42
and twelve-layer concentric objects [17, 18] methods. The
                                                                nondialysis patients with CKD in the Department of Nephrology
regional ROI selection method is a traditional BOLD-            of the Affiliated Hospital of Xuzhou Medical University were en-
MRI analysis method. In this method, an ROI is placed in        rolled in the CKD group. Among the CKD patients included in this
the upper, middle, and lower poles of the cortical and          study, the protopathy was chronic glomerulonephritis for 41 pa-
medullary regions, and then the oxygenation is evaluated        tients and hypertensive nephropathy for 1 patient. Most of the pa-
                                                                tients were in stage 1–3 CKD (n = 27). The patients maintained
by obtaining the mean R2* values. As the ROIs are drawn
                                                                their treatment and antihypertensive drugs.
manually, the shape and size of these ROIs vary and could           During the first week of this study, we measured the height,
contain cortico-medullary overlap zones, which may af-          weight, and blood pressure of the subjects. The serum glucose, he-
fect the accuracy and reproducibility of the R2* values.        moglobin, serum creatinine (Scr), blood urea nitrogen, uric acid,
Saad et al. [19] proposed a new analysis method, called         and cystatin C levels were measured by routine blood and kidney
                                                                function tests. The kidney volume in CKD patients was estimated
fractional tissue hypoxia, to evaluate the oxygenation
                                                                using measurements of MRI. The eGFR was calculated by CKD
changes in patients with atherosclerotic renal artery ste-      epidemiology collaboration formula. Emission computed tomog-
nosis. In this method, oxygenation is evaluated by mea-         raphy was performed in 29 CKD patients to evaluate their ERPF.
suring the percentage of R2* values above 30 s−1 in the         In the second week of this study, all the participants who had com-
cortex and renal parenchyma [7, 19, 20]. However, the           pleted the above examinations in the previous week were made

442                    Kidney Blood Press Res 2021;46:441–451                          Chen/Yan/Yang/Cheng/Zhang/Li/Liu/
                       DOI: 10.1159/000515709                                          Xu/Sun
Fig. 2. Regional ROI selection method: A the mean cortical and medullary R2* values are obtained by placing
ROIs in the cortex (ROIs 1–3) and the medulla (ROIs 4–6). Whole-kidney ROI selection method: B the cortical
R2* value is obtained by placing an ROI containing the wide cortical area. C The whole-kidney R2* value is ob-
tained by placing an ROI over the renal parenchyma (excluding the collection system, cysts, and hilar vessels).
ROI, region of interest.
complete BOLD-MRI examination in 1 day. On the day of exami- map showing a gradual transition from blue to green, yellow, and
nation, all participants ate the same food; CKD patients continued red from the cortex to the medulla. Blue represents high renal tis-
previous treatments, including angiotensin-converting enzyme sue oxygenation, and red represents significant hypoxia, with
inhibitor or angiotensin-receptor blocker drugs. changes from blue to green, yellow, and red indicating a gradual
In the CKD group, the BOLD images of 1 patient were lost, and increase in renal hypoxia.
the BOLD images of 1 patient did not conform to the analysis stan-
dard because of severe atrophy of the kidneys. Finally, 40 CKD BOLD-MRI Analysis Methods
patients were included in the analysis. Of the 40 CKD patients in- A T2*-weighted image with the clearest demarcation of the
cluded, 29 patients had reexamination of renal function after 6 cortex and the medulla was selected from among one of the 10
months to 1 year. The eGFR increased or remained unchanged in coronal slices. Two methods were used to analyze BOLD images
15 patients and decreased in 14 patients. They were divided into in this study.
stable renal function group and deteriorating renal function group
based on eGFR (Fig. 1). Regional ROI Selection Method
An ROI was placed in the upper, middle, and lower poles of the
BOLD-MRI Parameters cortex to measure the R2* values of these areas, and the average of
During the second week of this study, the controls and CKD the 3 R2* values was taken as the cortical R2* value. The medullary
patients underwent BOLD-MRI with a 3.0-T system (GE Medical R2* value was obtained by the same method (Fig. 2: A1, 2). We at-
Systems, Discovery MR 750w). BOLD images of coronal slices tempted to produce ROIs as similar as possible in shape and size.
were acquired through the renal hilum during breath-hold using a
multiple gradient echo sequence. The BOLD-MRI parameters Whole-Kidney ROI Selection Method
were as follows: echoes, 10; repetition time, 47.8 ms; echo time, The R2* values of the cortex were measured with 1 ROI including
1.9∼37.1 ms; flip angle, 20°; slice thickness, 5 mm; interval, 0 mm; most cortical areas (Fig. 2: B1, 2). One ROI was placed by tracing the
field of view, 40 × 32 cm2; matrix, 96 × 180; and number of excita- whole renal parenchyma (except the collection system, cysts, and hi-
tions, 2. The system automatically generated an R2* pseudocolor lar vessels) to measure the whole-kidney R2* value (Fig. 2: C1, 2).
Application of BOLD-MRI in Chronic Kidney Blood Press Res 2021;46:441–451 443
Kidney Disease DOI: 10.1159/000515709Table 1. Demographics and clinical characteristics of controls and CKD patients
Characteristic Controls (n = 10) CKD (n = 40) p value
Age, years 43.2±14.4 44.2±14.9 0.85
Age range, years 24–65 17–74
Sex (males/females) 5/5 24/16 0.57
Body mass index, kg/m2 24.8±3.8 24.4±3.5 0.78
Hypertension 0 33
Blood pressure, mm Hg
Systolic blood pressure 123.6±6.5 142.3±21.0(p > 0.05 for each). The medullary and whole-kidney R2* Table 2. Kidney volume and ERPF in CKD patients
values were higher than the cortical R2* values in the same
Measurement Left Right p
group (p < 0.001 for each). Compared with the regional kidney kidney value
ROI selection method, the whole-kidney ROI selection
method yielded higher cortical R2* values in both the con- MRI
trols and CKD patients (p < 0.01 for each) (Table 3). Kidney volume, cm3 (n = 40) 219.4±87.4 217.6±71.1 0.92
ECT
ERPF, mL/min (n = 29) 84.8±49.1 94.9±53.0 0.46
Correlation between R2* Values and Kidney Function
Parameters in CKD Patients The data are expressed as the mean ± standard deviation. MRI, mag-
The cortical and medullary R2* values measured by the netic resonance imaging; ECT, emission computed tomography; ERPF, ef-
fective renal plasma flow.
regional ROI selection method had no correlations with
age (p = 0.35, 0.30, respectively), systolic blood pressure
(p = 0.67, 0.80, respectively), diastolic blood pressure (p =
0.75, 0.43, respectively), hemoglobin (p = 0.07, 0.31, respec- medulla of the kidney was green and yellow, indicating
tively), Scr (p = 0.13, 0.38, respectively), blood urea nitro- that the medullary oxygenation level was lower than the
gen (p = 0.09, 0.23, respectively), uric acid (p = 0.48, 0.98, cortical oxygenation level. Although the renal cortex was
respectively), cystatin C (p = 0.20, 0.32, respectively), eGFR also blue in the CKD patients, the color distribution was
(p = 0.78, 0.34, respectively), kidney volume (p = 0.90, 0.92, uneven, and green and yellow were locally distributed in
respectively), or ERPF (p = 0.54, 0.18, respectively) in the the cortex. In addition, there were large green, yellow, and
CKD patients. The cortical R2* values measured by the red areas in the medulla in the CKD patients, particularly
whole-kidney ROI selection method were not correlated in the deep medulla. These color changes in the R2* maps
with age (p = 0.77), systolic blood pressure (p = 0.25), dia- of the kidneys of the CKD patients show that, compared
stolic blood pressure (p = 0.88), hemoglobin (p = 0.96), Scr with the controls, the cortical and medullary oxygenation
(p = 0.29), blood urea nitrogen (p = 0.28), uric acid (p = levels are decreased and the reduced oxygenation in the
0.90), cystatin C (p = 0.37), eGFR (p = 0.15), kidney volume medulla is more pronounced in the CKD patients (Fig. 4C,
(p = 0.12), or ERPF (p = 0.39) in the CKD patients. The D).
whole-kidney R2* values measured by the whole-kidney
ROI selection method were positively correlated with the Comparison of Kidney Function Parameters and
Scr (r = 0.312, p = 0.05), blood urea nitrogen (r = 0.421, p = Kidney R2* Values (s−1) Obtained by Whole-Kidney
0.007) and cystatin C (r = 0.31, p = 0.05) levels and inverse- ROI Selection Method in Stable Renal Function Group
ly correlated with the eGFR (r = −0.472, p = 0.01) and ERPF and Deteriorating Renal Function Group after 6–12
(r = −0.542, p = 0.002). However, the whole-kidney R2* Months
values showed no correlations with age (p = 0.99), systolic After 6–12 months, the Scr, uric acid, and eGFR levels
blood pressure (p = 0.52), diastolic blood pressure (p = in 2 groups were significantly different (p = 0.023, 0.038,
0.15), hemoglobin (p = 0.59), uric acid (p = 0.44), or kidney andTable 3. Kidney R2* values (s−1) obtained by 2 BOLD-MRI analysis methods in controls and CKD patients
Measurement Controls (n = 10) CKD patients (n = 40)
left kidney right kidney left kidney right kidney
Regional ROI selection
Cortical R2* 17.2±1.4 17.2±1.2 20.2±3.0* 20.2±3.0*
Medullary R2* 23.6±0.9# 23.8±1.1# 31.8±3.2*, # 31.8±3.5*, #
Whole-kidney ROI selection
Cortical R2* 21.8±0.8# 22.2±1.1# 25.9±3.5*, # 25.7±3.2*, #
Whole-kidney R2* 26.2±1.2& 27.1±1.4& 34.3±3.4*, & 34.2±3.4*, &
The data are expressed as the mean±standard deviation. CKD, chronic kidney disease; ROI, region of interest.
* p < 0.01 versus the ipsilateral kidney R2* values of the controls. # p < 0.001 versus the ipsilateral cortical R2*
values in the same group using regional ROI selection. & p < 0.001 versus the ipsilateral cortical R2* values in the
same group using whole-kidney ROI selection.
the cortical R2* values. Li et al. [21] also found that the and the cortico-medullary zones are unclear. ROIs in the
renal medulla R2* values were significantly higher than cortex easily include cortico-medullary overlap zones.
that of cortex in the healthy. It indicates that the cortical The ROI placed in the whole-kidney ROI selection meth-
oxygenation level was high, while the medullary oxygen- od contains more cortical and cortico-medullary zones,
ation level was relatively low in the physiological state, resulting in a higher cortical R2* value. Second, in CKD,
and the blood distribution of them was different. In our the areas of hypoxia in the cortex are scattered. This
study, the cortical, medullary, and whole-kidney oxygen- means that if the 3 ROIs selected in the regional ROI se-
ation levels were significantly decreased in the CKD pa- lection method do not contain hypoxic regions, the corti-
tients compared with the healthy volunteers. We also cal R2* value obtained by this method will be larger than
found that medullary oxygenation was higher than corti- that obtained by the whole-kidney ROI selection method,
cal oxygenation using the regional ROI selection method. in which most of the cortical area is included in the ROI.
The reasons for these results are related not only to the Similarly, the medullary R2* value measured by the re-
low perfusion and high oxygen consumption in the me- gional ROI selection method has high variability due to
dulla but also to the imaging characteristics of BOLD- observer bias. To overcome these shortcomings, in the
MRI. In renal tissue, the oxygen dissociation curve is flat whole-kidney ROI selection method, the medullary R2*
when the partial oxygen pressure is >60 mm Hg, while the value is not evaluated. Instead, 1 ROI is used to trace the
oxygen dissociation curve is steeper when the partial oxy- entire kidney region (excluding the collection system,
gen pressure is 60 mm Hg, whole kidney.
while the partial pressure of oxygen in medullary zones is In our study, there were no significant differences inTable 4. Relationships of R2* values (s−1) with age, SBP, DBP, hemoglobin, Scr, BUN, uric acid, cystatin C, eGFR,
kidney volume, and ERPF in CKD patients
Measurement Regional ROI selection Whole-kidney ROI selection
cortical R2* medullary R2* cortical R2* whole kidney R2*
Age
r 0.150 0.169 0.048 0.003
p 0.35 0.30 0.77 0.99
SBP/DBP
r −0.070/−0.052 0.041/0.128 −0.187/0.025 0.104/0.230
p 0.67/0.75 0.80/0.43 0.25/0.88 0.52/0.15
Hemoglobin
r −0.290 −0.165 −0.009 −0.088
p 0.07 0.31 0.96 0.59
Scr
r 0.244 0.142 0.173 0.312
p 0.13 0.38 0.29 0.05
BUN
r 0.274 0.200 0.175 0.421
p 0.09 0.22 0.28 0.007
Uric acid
r 0.115 −0.005 −0.022 0.125
p 0.48 0.98 0.89 0.44
Cystatin C
r 0.208 0.160 0.145 0.310
p 0.20 0.32 0.37 0.05
eGFR
r −0.055 −0.184 −0.276 −0.472
p 0.78 0.34 0.15 0.01
Kidney volume
r −0.024 0.018 −0.287 −0.332
p 0.90 0.92 0.11 0.06
ERPF
r 0.120 −0.255 −0.166 −0.542
p 0.54 0.18 0.39 0.002
SBP, systolic blood pressure; DBP, diastolic blood pressure; Scr, serum creatinine; BUN, blood urea nitrogen;
eGFR, estimated glomerular filtration rate; ERPF, effective renal plasma flow; ROI, region of interest. The whole-
kidney R2* values measured by the whole-kidney ROI selection method were positively correlated with the serum
creatinine (r = 0.312, p = 0.05), blood urea nitrogen (r = 0.421, p = 0.007) and cystatin C (r = 0.31, p = 0.05) levels
and inversely correlated with the eGFR (r = −0.472, p = 0.01) and ERPF (r = −0.542, p = 0.002).
lary R2* values measured using the regional ROI selection nificant relationship between the whole-kidney R2* value
method in CKD patients were not related to age or blood and kidney volume in CKD patients, but the correlation
pressure. However, it is interesting that the cortical R2* coefficient was high, which merits further study.
value was positively correlated with the level of uric acid The whole-kidney R2* value measured using the whole-
because hyperuricemia can constrict cortical blood ves- kidney ROI selection method was positively correlated with
sels, thereby reducing cortical oxygenation. Prasad et al. the Scr, blood urea nitrogen, and cystatin C levels and neg-
[25] found that the hemoglobin and cortical R2* values in atively correlated with the eGFR and ERPF in CKD patients
CKD patients were both higher than those in anemic pa- in this experiment. These results suggest that a reduction in
tients, indicating that hemoglobin had little effect on cor- whole-kidney oxygenation is closely related to reductions
tical oxygenation. Currently, there are few reports on the in kidney function and ERPF in CKD. Saad et al. [19] found
relationship between the kidney volume and renal tissue that the decrease in renal parenchyma oxygenation mea-
oxygenation in CKD patients. Our study found no sig- sured by fractional tissue hypoxia, compared with that mea-
Application of BOLD-MRI in Chronic Kidney Blood Press Res 2021;46:441–451 447
Kidney Disease DOI: 10.1159/000515709Fig. 3. The whole-kidney R2* values measured by the whole-kidney ROI selection method were positively cor-
related with the Scr, blood urea nitrogen, and cystatin C levels and inversely correlated with the eGFR and ERPF.
eGFR, estimated glomerular filtration rate; ROI, region of interest; ERPF, effective renal plasma flow; Scr, serum
creatinine.
sured by the regional ROI selection method, was closely ue measured by the regional ROI selection method among
related to decreases in the renal blood flow, tissue perfusion, healthy volunteers, participants with hypertension and
and GFR in atherosclerotic renal artery stenosis patients; CKD patients. This may be related to regional ROI selec-
diuretics could improve the medullary oxygenation level. tion method’s subjectivity and limitations. Therefore, the
Warner et al. [20] and Pruijm et al. [26] have also shown whole-kidney oxygenation level measured using the
that diuretics can rapidly reduce medullary oxygen con- whole-kidney ROI selection method is a more accurate
sumption by blocking sodium transport in the ascending and reliable evaluation and may have an early prediction
thick limb of Henle’s loop. However, clinical researchers of the progression of CKD.
usually pay more attention to decreases in kidney function
and ignore the effects of renal tubule dysfunction on the
progression of kidney disease. Conclusions
Recent studies have reported that the evaluation of ox-
ygenation in renal cortex by BOLD-MRI can predict the Compared with the healthy controls, the CKD patients
progression of renal function [17, 27]. Our experiment exhibited significantly decreased renal oxygenation in the
also found the whole-kidney R2* values obtained by cortex and the medulla, particularly in the medulla. The
whole-kidney ROI selection method can predict the pro- decrease in whole-kidney oxygenation was closely related
gression of CKD earlier than the hematology indicators. to decrease in kidney function, renal glomerular filtra-
However, Michaely et al. [23] found no correlation be- tion, and tubular function. The whole-kidney R2* value
tween the cortical and medullary R2* values and the GFR measured using the whole-kidney ROI selection method
in CKD patients at different stages. Pruijm et al. [24] may be a superior reflection and predictor of the progres-
found no differences in the cortical or medullary R2* val- sion of CKD.
448 Kidney Blood Press Res 2021;46:441–451 Chen/Yan/Yang/Cheng/Zhang/Li/Liu/
DOI: 10.1159/000515709 Xu/SunFig. 4. T2* maps: A Controls: the size and shape of the kidney were indicate decreased medullary oxygenation. D CKD patients: un-
normal, and the renal cortico-medullary zones were clear. B CKD even blue in the cortex indicates decreased cortical oxygenation.
patients: the size of the kidney was small, the shape of the kidney The large green, yellow, and red areas in the medulla indicate de-
was irregular, and the renal cortico-medullary zones were unclear. creased medullary oxygenation, which is more pronounced in the
R2* maps: C Controls: homogeneous blue in the cortex indicates deep medulla.
abundant cortical oxygenation. Green and yellow in the medulla
Table 5. Comparison of kidney function parameters in stable renal function group and deteriorating renal
function group after 6–12 months
Parameters Stable renal function Deteriorating renal p value
group (n = 15) function group (n = 14)
Hemoglobin, g/L 113.60±27.18 95.14±40.77 0.665
Scr, μmol/L 192.27±178.38 459.29±358.30 0.023
Blood urea nitrogen, mmol/L 11.41±8.14 20.01±14.23 0.169
Uric acid, μmol/L 388.53±138.17 412.07±131.83 0.038
Cystatin C, mg/L 1.67±1.10 2.71±1.31 0.877
eGFR, mL/min 64.34±44.28 24.96±17.85Table 6. Comparison of kidney function parameters and kidney R2* values (s−1) obtained by whole-kidney ROI
selection method in stable renal function group and deteriorating renal function group at baseline
Parameters Stable renal function Deteriorating renal p value
group (n = 15) function group (n = 14)
Hemoglobin, g/L 117.93±29.53 101.14±41.50 0.439
Scr, μmol/L 248.27±244.02 268.21±185.23 0.805
Blood urea nitrogen, mmol/L 10.96±5.78 15.72±9.98 0.135
Uric acid, μmol/L 451.27±161.45 417.57±119.83 0.315
Cystatin C, mg/L 1.68±1.01 2.01±0.74 0.527
eGFR, mL/min 55.76±43.53 33.20±23.84 0.095
Right whole-kidney R2*, s−1 32.1±3.7 34.9±3.0 0.033
Left whole-kidney R2*, s−1 32.6±3.4 35.3±3.4 0.042
The data are expressed as the mean ± standard deviation or as a numerical value. eGFR, estimated glomerular
filtration rate; ROI, region of interest; Scr, serum creatinine. The whole-kidney R2* values in deteriorating renal
function group were significantly higher than those instable renal function group at baseline (p = 0.033 and 0.042,
respectively).
fractional kidney hypoxia remains to be further studied. Conflict of Interest Statement
In addition, due to the limitation of experimental condi-
tions, creatinine of each participant was only measured The authors declare that there are no conflicts of interest.
twice which may limit the appreciation of the yearly eGFR
decline.
Funding Sources
This study was supported by funding from the National Natu-
Acknowledgements ral Science Foundation of China (81270769) and Jiangsu Provin-
cial Post Graduate Innovation Plan (KYCX17_1708, SJCX17_0560,
We gratefully acknowledge the work of past and present mem- KYCX18-2178, SJCX18_0715).
bers of our research group and hospital.
Author Contributions
Statement of Ethics
Methodology and writing-original draft preparation, Fen
The research was conducted in accordance with the World Chen; formal analysis and writing-review and editing, Han Yan
Medical Association Declaration of Helsinki and complies with and Fan Yang; performing BOLD-MRI, Li Cheng and Siwei Zhang;
the guidelines for human studies. Written informed consent was data curation, Shulin Li and Caixia Liu; supervision and project
obtained from all patients, and the Ethics Committee of Affiliated administration, Kai Xu and Dong Sun.
Hospital of Xuzhou Medical University approved this study (XY-
FY2016-KL031-01).
References
1 Neugarten J. Renal BOLD-MRI and assess- dysfunction. Clin Exp Pharmacol Physiol. gen level-dependent magnetic resonance im-
ment for renal hypoxia. Kidney Int. 2012; 2011;38(7):474–80. aging identifies cortical hypoxia in severe re-
81(7):613–4. 5 Ebrahimi B, Textor SC, Lerman LO. Renal rel- novascular disease. Hypertension. 2011;
2 Hirakawa Y, Tanaka T, Nangaku M. Renal hy- evant radiology: renal functional magnetic 58(6):1066–72.
poxia in CKD; pathophysiology and detecting resonance imaging. Clin J Am Soc Nephrol. 8 Gloviczki ML, Lerman LO, Textor SC. Blood
methods. Front Physiol. 2017;8:99. 2014;9(2):395–405. oxygen level-dependent (BOLD) MRI in re-
3 Nangaku M. Hypoxia and tubulointerstitial 6 Niles DJ, Gordon JW, Fain SB. Effect of anes- novascular hypertension. Curr Hypertens
injury: a final common pathway to end-stage thesia on renal R2* measured by blood oxy- Rep. 2011;13(5):370–7.
renal failure. Nephron Exp Nephrol. 2004; gen level-dependent MRI. NMR Biomed. 9 Yin WJ, Liu F, Li XM, Yang L, Zhao S, Huang
98(1):e8–12. 2015;28(7):811–7. ZX, et al. Noninvasive evaluation of renal ox-
4 Palm F, Nordquist L. Renal tubulointerstitial 7 Gloviczki ML, Glockner JF, Crane JA, McKu- ygenation in diabetic nephropathy by BOLD-
hypoxia: cause and consequence of kidney sick MA, Misra S, Grande JP, et al. Blood oxy- MRI. Eur J Radiol. 2012;81(7):1426–31.
450 Kidney Blood Press Res 2021;46:441–451 Chen/Yan/Yang/Cheng/Zhang/Li/Liu/
DOI: 10.1159/000515709 Xu/Sun10 Xin-Long P, Jing-Xia X, Jian-Yu L, Song W, 16 Piskunowicz M, Hofmann L, Zuercher E, Bas- 22 Djamali A, Sadowski EA, Samaniego-Picota
Xin-Kui T. A preliminary study of blood-ox- si I, Milani B, Stuber M, et al. A new technique M, Fain SB, Muehrer RJ, Alford SK, et al.
ygen-level-dependent MRI in patients with with high reproducibility to estimate renal Noninvasive assessment of early kidney al-
chronic kidney disease. Magn Reson Imaging. oxygenation using BOLD-MRI in chronic lograft dysfunction by blood oxygen level-de-
2012;30(3):330–5. kidney disease. Magn Reson Imaging. 2015; pendent magnetic resonance imaging. Trans-
11 Bauer F, Wald J, Bauer FJ, Dahlkamp LM, 33(3):253–61. plantation. 2006;82(5):621–8.
Seibert FS, Pagonas N, et al. Detection of acute 17 Pruijm M, Milani B, Pivin E, Podhajska A, 23 Michaely HJ, Metzger L, Haneder S, Hans-
tubular necrosis using blood oxygenation lev- Vogt B, Stuber M, et al. Reduced cortical oxy- mann J, Schoenberg SO, Attenberger UI. Re-
el-dependent (BOLD) MRI. Kidney Blood genation predicts a progressive decline of re- nal BOLD-MRI does not reflect renal func-
Press Res. 2017;42(6):1078–89. nal function in patients with chronic kidney tion in chronic kidney disease. Kidney Int.
12 Park SY, Kim CK, Park BK, Kim SJ, Lee S, disease. Kidney Int. 2018;93(4):932–40. 2012;81(7):684–9.
Huh W. Assessment of early renal allograft 18 Li LP, Milani B, Pruijm M, Kohn O, Sprague 24 Pruijm M, Hofmann L, Piskunowicz M,
dysfunction with blood oxygenation level-de- S, Hack B, et al. Renal BOLD MRI in patients Muller ME, Zweiacker C, Bassi I, et al. Deter-
pendent MRI and diffusion-weighted imag- with chronic kidney disease: comparison of minants of renal tissue oxygenation as mea-
ing. Eur J Radiol. 2014;83(12):2114–21. the semi-automated twelve layer concentric sured with BOLD-MRI in chronic kidney dis-
13 Khatir DS, Pedersen M, Jespersen B, Buus objects (TLCO) and manual ROI methods. ease and hypertension in humans. PLoS One.
NH. Evaluation of renal blood flow and oxy- MAGMA. 2020;33(1):113–20. 2014;9(4):e95895.
genation in CKD using magnetic resonance 19 Saad A, Crane J, Glockner JF, Herrmann SM, 25 Prasad PV, Thacker J, Li LP, Haque M, Li W,
imaging. Am J Kidney Dis. 2015; 66(3): 402– Friedman H, Ebrahimi B, et al. Human reno- Koenigs H, et al. Multi-parametric evaluation
11. vascular disease: estimating fractional tissue of chronic kidney disease by MRI: a Prelimi-
14 Ebrahimi B, Gloviczki M, Woollard JR, Crane hypoxia to analyze blood oxygen level-depen- nary Cross-Sectional Study. PLoS One. 2015;
JA, Textor SC, Lerman LO. Compartmental dent MR. Radiology. 2013;268(3):770–8. 10(10):e0139661.
analysis of renal BOLD MRI data: introduc- 20 Warner L, Glockner JF, Woollard J, Textor 26 Pruijm M, Hofmann L, Maillard M, Tremblay
tion and validation. Invest Radiol. 2012;47(3): SC, Romero JC, Lerman LO. Determinations S, Glatz N, Wuerzner G, et al. Effect of sodium
175–82. of renal cortical and medullary oxygenation loading/depletion on renal oxygenation in
15 Gloviczki ML, Saad A, Textor SC. Blood oxy- using blood oxygen level-dependent magnet- young normotensive and hypertensive men.
gen level-dependent (BOLD) MRI analysis in ic resonance imaging and selective diuretics. Hypertension. 2010;55(5):1116–22.
atherosclerotic renal artery stenosis. Curr Invest Radiol. 2011;46(1):41–7. 27 Zhou H, Yang M, Jiang Z, Ding J, Di J, Cui L.
Opin Nephrol Hypertens. 2013;22(5):519–24. 21 Li C, Liu H, Li X, Zhou L, Wang R, Zhang Y. Renal hypoxia: an important prognostic
Application of BOLD-MRI in the classifica- marker in patients with chronic kidney dis-
tion of renal function in chronic kidney dis- ease. Am J Nephrol. 2018;48(1):46–55.
ease. Abdom Radiol. 2019;44(2):604–11.
Application of BOLD-MRI in Chronic Kidney Blood Press Res 2021;46:441–451 451
Kidney Disease DOI: 10.1159/000515709You can also read