Wind tunnel comparison of four VAWT configurations to test load-limiting concept and CFD validation - WES
←
→
Page content transcription
If your browser does not render page correctly, please read the page content below
Wind Energ. Sci., 6, 287–294, 2021
https://doi.org/10.5194/wes-6-287-2021
© Author(s) 2021. This work is distributed under
the Creative Commons Attribution 4.0 License.

        Wind tunnel comparison of four VAWT configurations to
             test load-limiting concept and CFD validation
                    Jan Wiśniewski, Krzysztof Rogowski, Konrad Gumowski, and Jacek Szumbarski
                     Institute of Aeronautics and Applied Mechanics, Warsaw University of Technology,
                                                   Warsaw, 00-665, Poland
                             Correspondence: Jan Wiśniewski (jhwisniewski@meil.pw.edu.pl)

                                    Received: 31 January 2020 – Discussion started: 14 May 2020
                        Revised: 21 August 2020 – Accepted: 27 October 2020 – Published: 24 February 2021

       Abstract. The article describes results of experimental wind tunnel testing of four different straight-bladed
       vertical axis wind turbine model configurations. The experiment tested a novel concept of vertically dividing and
       azimuthally shifting a turbine rotor into two parts with a specific uneven height division in order to limit cycle
       amplitudes and average cycle values of bending moments at the bottom of the turbine shaft to increase product
       lifetime, especially for industrial-scale turbines. Testing reduction effects of simultaneously including a vertical
       gap between turbine rotor levels, increasing shaft length but also reducing aerodynamic interaction between rotor
       levels, has also been performed. Experiment results have shown very significant decreases of bending moment
       cycle amplitudes and average cycle values, for a wide range of measured wind speeds, for dual-level turbine
       configurations as compared to a single-level turbine configuration. The vertical spacing between levels equal to
       a blade’s single chord length has proven to be sufficient, on laboratory scale, to limit interaction between turbine
       levels in order to achieve optimal reductions of tested parameters through an operating cycle shift between two
       position-locked rotor levels during a turbine’s expected lifetime. CFD validation of maintaining the effect on
       industrial scale has been conducted, confirming the initial conclusions.

1   Introduction                                                   tor levels was also tested in order to limit interaction between
                                                                   separate rotor levels.
Vertical axis wind turbine (VAWT) blades, unlike horizon-             The topic of lift-based large-scale VAWTs, despite the
tal axis wind turbine blades, work in a high range of angles       aforementioned technological drawbacks – a solution to
of attack within each rotation cycle (Ahmadi-Balouaki et al.,      which can be seen tested below – has been met with resur-
2014). Resulting high amplitudes of bending moment val-            facing interest, due to their specific advantages. While factors
ues and high maximum moment values at the bottom of a              related to the blade tip not moving faster relative to the rest
wind turbine shaft in a rotation cycle (Galinos et al., 2016)      of the blade, allowing for lower noise emissions (Iida et al.,
are strong deterrents to development of economically feasi-        2004), lower bird death rates and no ice block launching, in
ble large-scale VAWTs. The proposed concept for limiting           areas where the risk exists, as compared to horizontal axis
those factors focuses on separating the rotor vertically into      wind turbines (HAWTs) are important advantages for cer-
two or more parts of different lengths, shifted azimuthally in     tain siting conditions, the key factor that keeps drawing re-
such a way as to maximally reduce maximum moment values            searchers to VAWTs is the high aerodynamic efficiency po-
and amplitudes at the bottom of the rotor shaft in a rotation      tential. A study by Simão Ferreira et al. (2014), comparing
cycle. The tested case had two rotor levels – a longer one,        six different methods for assessing power coefficients (Cp )
closer to the bottom of the shaft and a shorter one further        for a wide range of tip speed ratio and rotor solidity, has
from the bottom of the shaft – in order to achieve compa-          calculated large-scale VAWT Cp for advantageous configu-
rable values of bending moments at the bottom of the rotor         rations for each model to be between 0.54 and 0.6. Straight-
shaft from each rotor level. Additional spacing between ro-

Published by Copernicus Publications on behalf of the European Academy of Wind Energy e.V.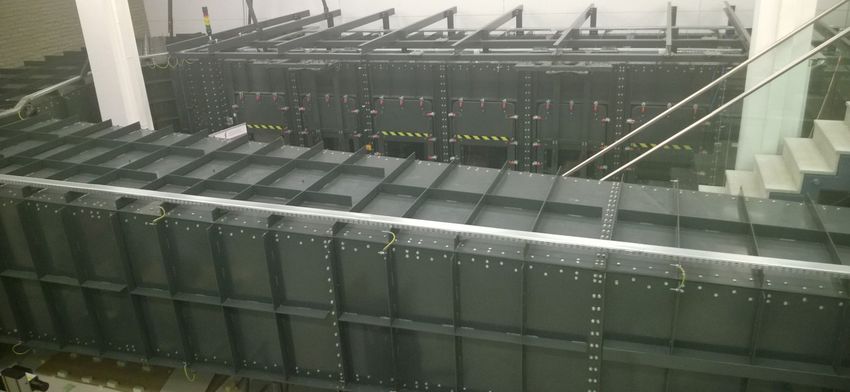
288 J. Wiśniewski et al.: Wind tunnel comparison of four VAWT configurations
bladed VAWTs specifically hold an additional advantage –
easier manufacturing of blades (Chinchilla et al., 2011) and
lower blade weight and material use compared to VAWTs
with spiraling blades.
Spiral-bladed wind turbines are described in the literature
as having lowered amplitude changes of their aerodynamics
(Guo et al., 2019) – specifically the time amplitude of the
sum of force values affecting the entire rotor is much lower
for a standard spiral VAWT compared to a straight-bladed
VAWT – as presented visually within the Journal of Power
and Technology (Scheurich et al., 2011). Another study gives Figure 1. WUT Variable Turbulence Tunnel.
this relationship an averaged numeric value – stating that by
replacing straight blades with helical ones in a VAWT rotor,
the total force fluctuation amplitude is reduced by about 50 % symmetrical airfoil, a classical VAWT airfoil used both in
(Marini et al., 2010). It is important to note that these avail- CFD-based studies (Rogowski et al., 2018) and experiments
able factors do not reflect directly towards a key parameter (Laneville and Vittecoq, 1986).
of this study – cycle amplitudes of bending moments at the The concept tested has, in the presented version, two lev-
bottom of the turbine shaft, proportional to element loading els of blades within a rotor. The lower level is equipped with
and therefore determined as a parameter directly influenc- longer blades in order to provide similar maximum and min-
ing turbine shaft reliability, expected lifetime and necessary imum values of bending moment at the bottom of the tur-
material use as per use in expected lifetime for cyclic load- bine shaft as the higher level, only shifted in cycle by az-
ing curves. Typical designs of spiral-bladed VAWTs are not imuthally displacing the upper and lower rotor level. In order
optimal in smoothing bending moments at the base of the to limit interference influencing the character of aerodynamic
turbine shaft – there is an effect, but as the upper sections loading on each three-blade rotor level, variants with vertical
have greater leverage than the lower ones the effect achieved spacing between rotor levels have also been tested – nega-
cannot be perfect. The solution to this, described in patent tively influencing shaft length but decreasing aerodynamic
application PCT/PL2020/000054 lies in a non-linear twist – interference between adjacent rotor levels. It is worthwhile
operating on a similar principle to the upper portion of the to note that applying construction solutions reducing blade
concept that is the target of the paper, the upper portion of chord near the end of a rotor level (Islam et al., 2008) should
the rotor being a specific different size than the lower portion. result in lower spacing needs between adjacent turbine levels.
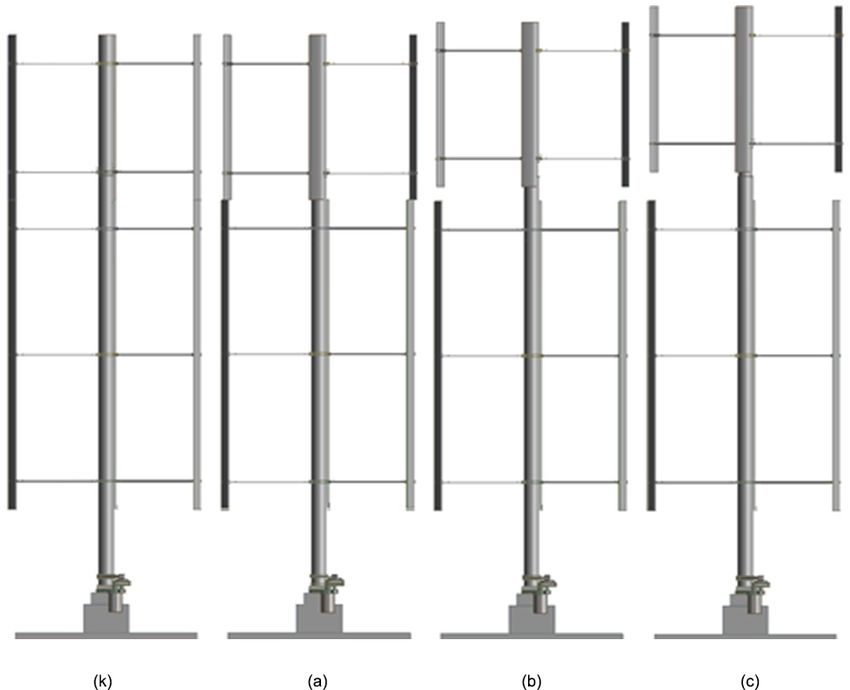
Finally, both structural concerns and increased weight of spi- Figure 2 displays the four configurations used for final
ral blades make the technology very interesting on small to wind tunnel testing. Configuration K is a standard single-
medium scales but less cost-efficient than the concept vali- level VAWT with blade length equal to the sum of the length
dated within this paper, on the scale referenced and above. of both levels in other scenarios. Configuration A is a dual-
level wind turbine, shifted azimuthally by 60◦ , with the sec-
ond level starting at the exact height at which the first level
2 Test case description ends. Configuration B is analogous to A, whereas there is a
vertical gap between adjacent levels equal to a single chord
The testing was conducted in the WUT Variable Turbulence length (3.75 cm). Configuration C has a vertical gap between
Tunnel in the 2.5 m wide and 2 m tall environmental test sec- levels equal to two chord lengths (7.5 cm).
tion of the tunnel. The reason for conducting the tests was to measure the
Shown in Fig. 1 the WUT Variable Turbulence Tunnel is bending moment values at the bottom of the turbine tower
a large-scale sub-sonic wind tunnel with two independent for a laboratory-scale model of the authors’ analyzed turbine
test sections allowing for testing in a range of speeds up to concept, within a few configurations. The values were be-
100 m/s. Air flow is generated by a 250 kW engine. Figure 1 ing measured for a range of inflow wind speeds between 4
shows a part of the Warsaw University of Technology includ- and 12 m/s while the turbine was rotating freely. Torque was
ing a section of the environmental part of the tunnel. not a measured parameter, as for the range of Reynolds num-
The model itself was 1.5 m high in the two shortest con- bers in the area of 10 000 to 50 000 within the experiment no
figurations, with a 57.5 cm turbine rotor diameter. The model airfoils are capable of providing characteristics comparable
was created with the upper level capable of shifting, in order to ones for industrial-scale blades. Each measurement con-
to enable testing of different configurations. A three-blade sisted of 10 000 data acquisitions within the period of 10 s.
rotor design was chosen, in addition to CFD simulations by For many combinations of inflow wind speeds and geom-
the authors. A comparative analysis by Parashivoiu shows etry configurations, up to six measurements were taken to
them to have better structural reliability than dual-blade de- ensure that a momentary effect did not influence the results.
signs (Parashivoiu, 2002). The model used the NACA 0018 To reduce noise within the measured signal, techniques from
Wind Energ. Sci., 6, 287–294, 2021 https://doi.org/10.5194/wes-6-287-2021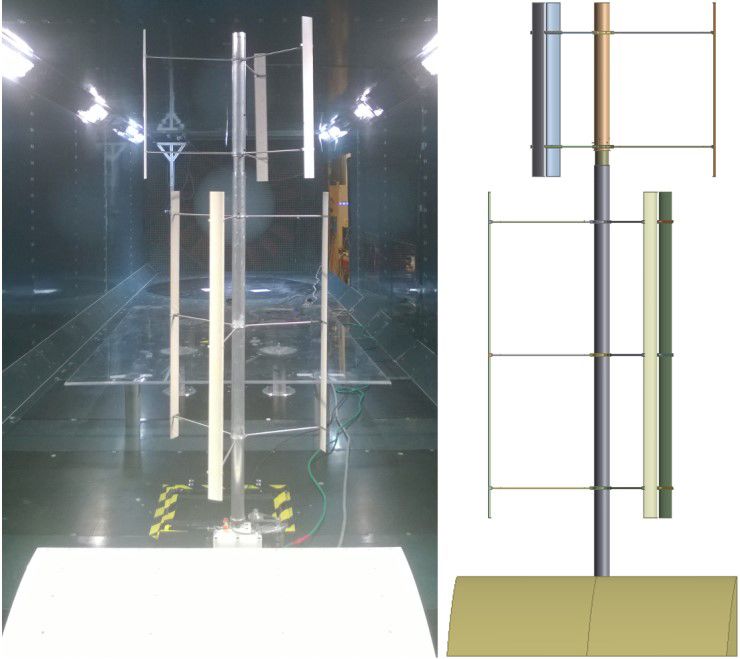
J. Wiśniewski et al.: Wind tunnel comparison of four VAWT configurations                                                      289

                                                                   Figure 3. Sample of raw and refined bending data values from con-
                                                                   figuration A.

Figure 2. Chosen VAWT configurations tested in the wind tunnel.

exploratory data analysis (EDA) were used (Oerlemans and
Migliore, 2004). Firstly a technique called hanning, or a run-
ning weighted mean, was implemented. Each data point was
replaced with the sum of half the data point and one-fourth
of the previous and next data points. This was used consec-
utively three times for better results, with 50-point median
smoothing used twice afterwards for a final smoothened data
set.                                                               Figure 4. Model set in configuration K.
   Figure 3 presents a 1 s sample of raw bending moment val-
ues recorded by the tensometric scale used in the experiment,
as well as the refined bending moment values achieved by a         figuration K. In general there is an increase in bending mo-
five-step smoothing process used in order to eliminate signal      ment values and amplitudes, accompanying the growth of in-
noise. The data are from a measurement in configuration A,         flow wind speeds. The value increase, while not exactly pro-
taken at the inflow wind speed of 11 m/s. The necessity of         portional to the second power of the inflow speed, is strongly
eliminating signal noise does, to a small extent, influence ex-    influenced by it, with two exceptions. It is noticeable from
periment results. The smoothing process, if done too subtly,       the values that, at 10 and 11 m/s, the turbine has started oscil-
maintains some artificial peak value increases. If the smooth-     lating by bending. It is especially evident for 10 m/s when the
ing process is too major, it leads to filtering out peak values    moment amplitude is several times larger than for many other
resulting from actual physical forces acting upon the rotor.       measurements. It is also visible that for 10 m/s the moment
Although the smoothing was done with care, it is important         amplitude is noticeably higher than the moment peak values,
to remember that, especially for comparison of tens of cycles      meaning that for a part of the loading cycle the turbine is
performed for four different geometries and a range of wind        being pushed forward against the direction of the wind. That
speeds, it introduces risk of slightly altering peak values. The   effect is, to a much smaller degree, visible at the inflow speed
smoothing process, while aiming to recreate the values with-       of 11 m/s.
out signal noise, may have some influence on the exact result         Figure 4 displays the model set in configuration K. It
values; however the possible scale of the effect is too small      shows a single-level turbine, with straight, prolonged blades.
to have an impact on the general nature of the experiment re-
sults or conclusions on validating the potential effectiveness     2.2   Configuration A
of the proposed solution.
                                                                   Figure 5 displays the model set in configuration A. It shows
                                                                   a basic dual-level turbine, shifted azimuthally between levels
2.1   Configuration K                                              by 60◦ . There is no vertical displacement between levels –
                                                                   the upper level of the rotor starts at the same height the lower
Table 1 shows results of measuring bending moments at the
                                                                   level ends.
bottom of the turbine tower for a range of wind speeds be-
tween 4 and 12 m/s for a freely rotating wind turbine in con-

https://doi.org/10.5194/wes-6-287-2021                                                     Wind Energ. Sci., 6, 287–294, 2021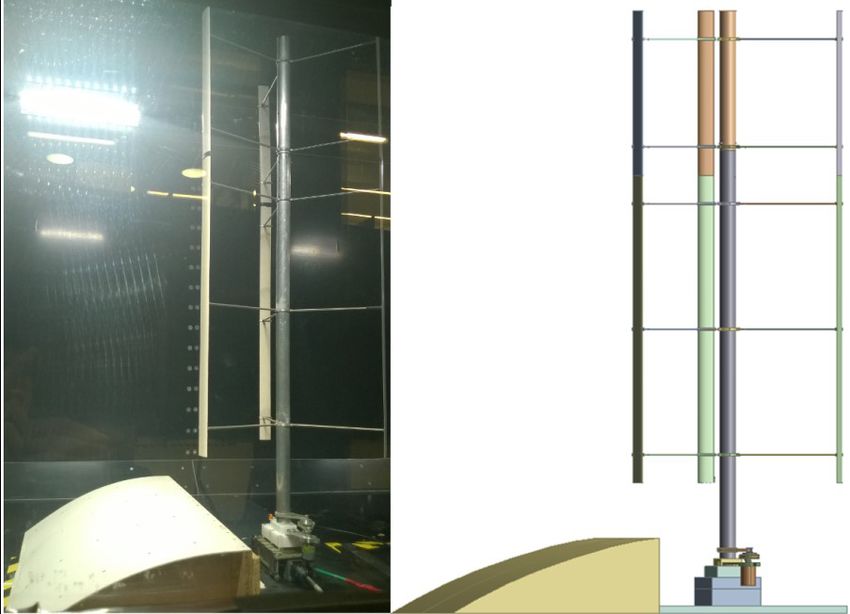
290                                                 J. Wiśniewski et al.: Wind tunnel comparison of four VAWT configurations

Table 1. Control case K testing parameters of bending moments for wind speed range.

            Wind speed [m/s]                       4        5        6         7       8        9      10       11     12
            Average moment amplitude [Nm]      0.077    0.102     0.243     0.358   0.522   1.193   7.799   3.316    1.672
            Max moment amplitude [Nm]          0.118    0.183     0.389     0.604   0.809   1.529   8.249   3.762    2.326
            Min moment amplitude [Nm]          0.025    0.021     0.036     0.168   0.157   0.833   7.211   2.701    1.066
            Average peak value [Nm]            0.254    0.413     0.643     0.886   1.221   1.817   5.647   3.505    3.047
            Max peak value [Nm]                0.270    0.509     0.753     0.994   1.363   1.976   5.941   3.727    3.414

Figure 5. Model set in configuration A.

                                                                      Figure 6. Model set in configuration B.
   Table 2 shows results of measuring bending moments at
the bottom of the turbine tower for a range of wind speeds
between 4 and 12 m/s for a freely rotating wind turbine in            much smaller than in the single-level configuration K and
configuration A. In general there is an increase in bending           also lower than for configuration A, which has no vertical
moment values and amplitudes, accompanying the growth of              spacing between levels.
inflow wind speeds. At the inflow speed of 11 m/s, the shape
of the bending moment data curve and the fact that both mo-
ment amplitudes and peak values are greater than for 12 m/s
suggest that for 11 m/s resonance occurs. The increase of val-        2.4     Configuration C
ues due to resonance is much smaller than in the single-level         Figure 7 displays the model set in configuration C. It shows a
configuration K.                                                      dual-level turbine, shifted azimuthally between levels by 60◦ .
                                                                      The height of the vertical gap between rotor levels is equal to
2.3   Configuration B                                                 7.5 cm – two chord lengths.
                                                                         Table 4 shows results of measuring bending moments at
Figure 6 displays the model set in configuration B. It shows a        the bottom of the turbine tower for a range of wind speeds
dual-level turbine, shifted azimuthally between levels by 60◦ .       between 4 and 12 m/s for a freely rotating wind turbine in
The height of the vertical gap between rotor levels is equal to       configuration C. At the inflow speed of 11 m/s, the shape
3.75 cm – one chord length.                                           of the curve and the fact that both moment amplitudes and
   Table 3 shows results of measuring bending moments at              peak values are greater than for 12 m/s suggest that for 11 m/s
the bottom of the turbine tower for a range of wind speeds            resonance occurs. The growth of values due to resonance is
between 4 and 12 m/s for a freely rotating wind turbine in            much smaller than in the single-level configuration K and
configuration B. At the inflow speed of 11 m/s, the shape             also lower than for configuration A or B. The growth of verti-
of the curve and the fact that both moment amplitudes and             cal spacing between rotor levels, tested to quantify the effects
peak values are greater than for 12 m/s suggest that for 11 m/s       of decreasing interaction between levels on bending moment
resonance occurs. The growth of values due to resonance is            values in addition to the azimuthal shift of rotor levels, helps

Wind Energ. Sci., 6, 287–294, 2021                                                          https://doi.org/10.5194/wes-6-287-2021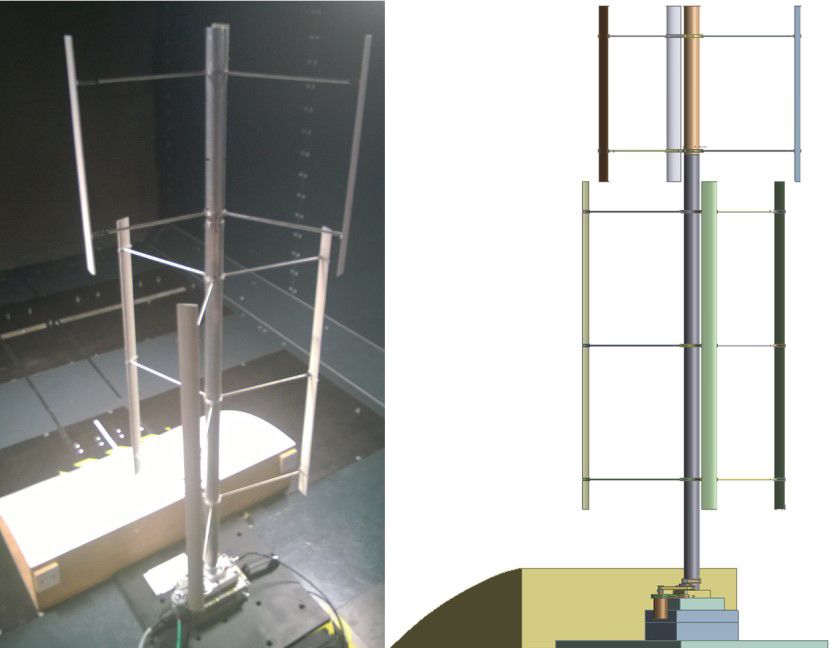
J. Wiśniewski et al.: Wind tunnel comparison of four VAWT configurations                                                      291

Table 2. Case A testing parameters of bending moments for wind speed range.

            Wind speed [m/s]                       4        5       6         7      8       9      10       11      12
            Average moment amplitude [Nm]      0.058   0.133    0.133    0.170    0.179   0.258   0.521   1.917   0.721
            Max moment amplitude [Nm]          0.098   0.199    0.235    0.262    0.336   0.508   0.898   2.132   1.390
            Min moment amplitude [Nm]          0.025   0.084    0.052    0.084    0.043   0.108   0.214   1.710   0.188
            Average peak value [Nm]            0.248   0.401    0.564    0.762    0.978   1.278   1.708   2.730   2.455
            Max peak value [Nm]                0.278   0.441    0.612    0.833    1.145   1.394   1.922   2.893   2.854

Table 3. Case B testing parameters of bending moments for wind speed range.

            Wind speed [m/s]                       4        5       6         7      8       9      10       11      12
            Average moment amplitude [Nm]      0.059   0.065    0.097    0.145    0.177   0.411   0.399   1.223   0.595
            Max moment amplitude [Nm]          0.088   0.113    0.157    0.259    0.274   0.645   0.664   1.480   0.891
            Min moment amplitude [Nm]          0.025   0.022    0.030    0.043    0.066   0.185   0.164   0.895   0.128
            Average peak value [Nm]            0.246   0.365    0.544    0.775    1.002   1.399   1.659   2.401   2.448
            Max peak value [Nm]                0.262   0.397    0.575    0.844    1.063   1.562   1.820   2.498   2.583

                                                                     tion levels to configuration B for 7 m/s and the range of 9–
                                                                     12 m/s. The vertical spacing between levels also increases the
                                                                     height of the structure as well as moves the model further
                                                                     from optimal level-length proportions, which were optimized
                                                                     for configuration A. The results show that growth of vertical
                                                                     spacing corresponded to a drop in average peak bending mo-
                                                                     ment value reduction for inflow speeds of below 10 m/s, at
                                                                     which point resonance begins to influence test results.
                                                                        For results presented in this paper, there can be several
                                                                     ways of assessing the average reduction in bending moment
                                                                     and bending moment amplitude values. The simplest way
                                                                     would be to take reduction percentage values from Table 5
                                                                     and make a simple average of them. For purposes relating to
                                                                     product lifetime, a more realistic approach would be to take
                                                                     an average but discard the values at low inflow speeds – too
                                                                     small to influence turbine lifetime, as compared to values at
                                                                     higher inflow speeds. For a range of relevant wind speeds set
                                                                     from 8 to 12 m/s, an average reduction of bending moment
                                                                     amplitude in configuration A was at 67 %, while the aver-
                                                                     age reduction of peak bending moment values was at 32 %.
Figure 7. Model set in configuration C.
                                                                     For configuration B, the reductions calculated thusly were
                                                                     likewise 71 % and 33 %; for configuration C they were 72 %
                                                                     and 31 %. Another simple approach would be to make an
limit the effects of the sudden moment and moment ampli-
                                                                     unweighted sum of all measured mean values for every con-
tude growth at certain wind speeds.
                                                                     figuration and quantify the reduction between those sums.
                                                                     A modification of this approach is weighing the results at
3   Experiment result comparison                                     all tested wind speeds, by probability of their occurrence.
                                                                     This has been done using the Weibull wind speed distribu-
Table 5 shows the reduction of average bending moment am-            tion curve for reasonable European wind farm siting condi-
plitude and average peak bending moment value results for            tions – a middle-of-rotor average wind speed of 5.7 m/s and k
each separate inflow speed for every test configuration as           shape factor equal to 2.1 (Kiss and Jánosi, 2008). For this av-
compared to configuration K. Except for 4 m/s, all average           eraging method, moment amplitudes in configuration A were
bending moment amplitude reduction levels for configura-             limited on average by 80 %, while the average reduction of
tion B are greater than for configuration A. Configuration C         peak bending moment values at the tower base was 42 %, as
shows superior average bending moment amplitude reduc-               compared to configuration K. For configuration B, the reduc-

https://doi.org/10.5194/wes-6-287-2021                                                       Wind Energ. Sci., 6, 287–294, 2021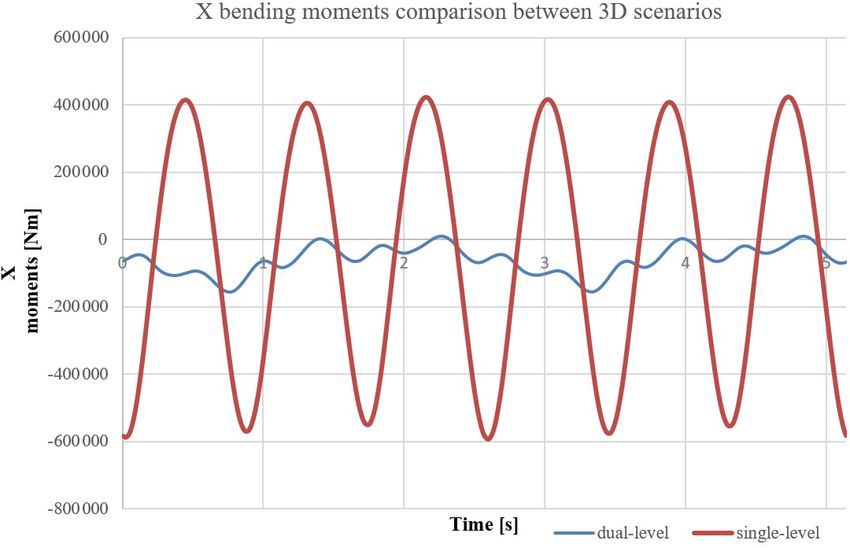
292 J. Wiśniewski et al.: Wind tunnel comparison of four VAWT configurations
Table 4. Case C testing parameters of bending moments for wind speed range.
Wind speed [m/s] 4 5 6 7 8 9 10 11 12
Average moment amplitude [Nm] 0.063 0.090 0.147 0.136 0.249 0.290 0.393 0.940 0.580
Max moment amplitude [Nm] 0.111 0.149 0.209 0.217 0.441 0.520 0.766 1.264 1.122
Min moment amplitude [Nm] 0.029 0.055 0.072 0.059 0.077 0.035 0.100 0.630 0.144
Average peak value [Nm] 0.261 0.407 0.594 0.797 1.087 1.399 1.723 2.340 2.529
Max peak value [Nm] 0.287 0.448 0.643 0.864 1.159 1.564 1.946 2.490 2.776
Table 5. Result comparison for different scenarios.
Inflow velocity [m/s] Average bending moment Average peak moment
amplitude reduction value reduction
K A B C K A B C
4 0% 25 % 23 % 18 % 0% 3% 3% −2 %
5 0% −31 % 37 % 12 % 0% 3% 12 % 1%
6 0% 45 % 60 % 40 % 0% 12 % 15 % 8%
7 0% 53 % 59 % 62 % 0% 14 % 12 % 10 %
8 0% 66 % 66 % 52 % 0% 20 % 18 % 11 %
9 0% 78 % 66 % 76 % 0% 30 % 23 % 23 %
10 0% 93 % 95 % 95 % 0% 70 % 71 % 69 %
11 0% 42 % 63 % 72 % 0% 22 % 32 % 33 %
12 0% 57 % 64 % 65 % 0% 19 % 20 % 17 %
tions were likewise 82 % and 42 %; for configuration C they
were 84 % and 40 %.
4 CFD validation
A validation of the load-limiting concept on industrial scale
has been performed using 3D CFD in ANSYS Fluent. Com-
pared was a dual-level straight-bladed wind turbine with the
vertical spacing between levels equal to one blade chord
length, based on experimental configuration B – 1.5 m and a
single-level straight-bladed turbine with identical chord, ro-
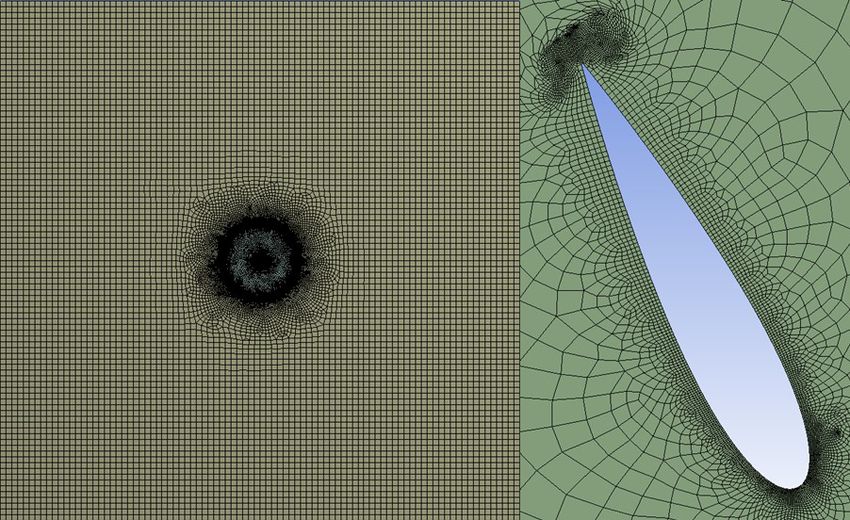
tor length and diameter. Figure 8. Computational domain geometry for dual-level scenario.
Figure 8 shows a side view of the geometry used for the
computational domain for the dual-level scenario. For both
scenarios the blade chord, total rotor length and diameter are turbulence parameters and surface roughness, a 9 m/s inflow
exactly 40 times that of the experimental cases. The blades speed, a rotational speed of 140 degree/s and 0.01 s time step.
were set 3◦ to the outside of the rotor, relative to the blades’ Figure 10 shows the Y -bending moments, according to
motion path. This parameter and others such as the chord-to- Fluent’s default coordinate system, at the bottom of the rotor
diameter ratio were chosen as a result of 2D CFD production shaft, analogous to the moments measured during the experi-
optimization. The airfoil used, after testing the influence of mental comparison in the first part of the paper. Compared to
airfoil thickness for a range of angles of blade attachment the single-level scenario, in the dual-level scenario the maxi-
with 2D simulations, was once again NACA0018. mum Y -moment values within a cycle are limited by 19.7 %,
Figure 9 displays a bottom side view of the mesh for the while the Y -moment amplitude is limited by 87.5 %.
entire domain as well as the sweepable mesh on one of the Figure 11 shows the X-bending moments at the bottom of
blades. The trailing edge was divided into two parts, the rest the rotor shaft, generated due to lift. Compared to the single-
of the blade into 550 parts. Automatic boundary layer cre- level scenario, in the dual-level scenario the maximum pos-
ation – as incompatible with the sweep method used – was itive X-moment values within a cycle are limited by 97.5 %
not implemented. The simulation was conducted with the and the maximum negative X-moment values within a cy-
k-ω shear stress transport (SST) turbulence method, default cle are limited by 73.6 %, while the X-moment amplitude
Wind Energ. Sci., 6, 287–294, 2021 https://doi.org/10.5194/wes-6-287-2021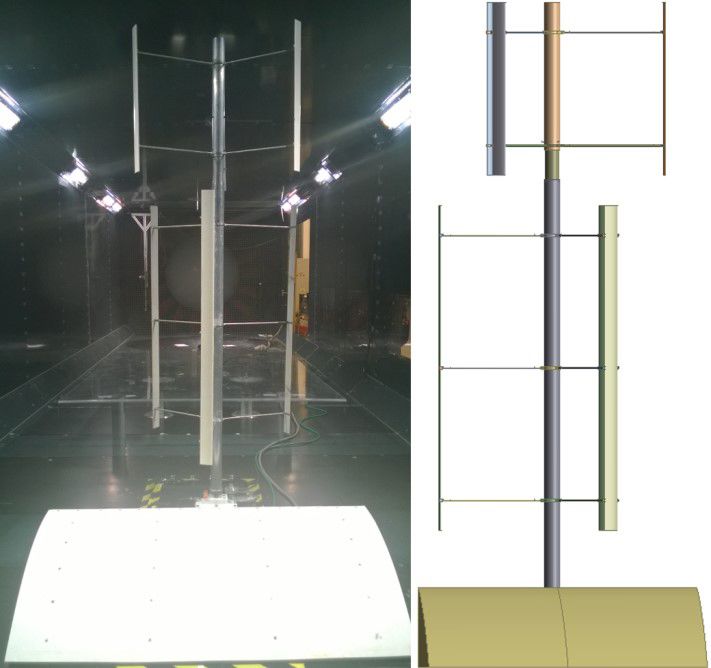
J. Wiśniewski et al.: Wind tunnel comparison of four VAWT configurations                                                            293

Figure 9. Bottom side view of select mesh parts.
                                                                    Figure 11. X-bending moments comparison between 3D scenarios.

                                                                    moments at the bottom of the turbine shaft, proportional to
                                                                    cyclic loading values. The obtained results, along with prior
                                                                    tests, yield a high probability of the concept being applicable
                                                                    in creating reliable, sleeker and more cost-efficient designs
                                                                    than previously exploited. Further validating those assump-
                                                                    tions with mid-scale environmental testing and a mechanical
                                                                    analysis of all relevant turbine elements is planned as the next
                                                                    research step within the topic.

                                                                    Data availability. The data are not publicly accessible as a part of
                                                                    the technology know-how is property of Vertical Axis Wind Tech-
                                                                    nologies LLC.
Figure 10. Y -bending moments comparison between 3D scenarios.

                                                                    Author contributions. JW was responsible for concept creation,
                                                                    authorship of basic methodology, experiments and simulation. KR
is limited by 83.6 %. Finally, in the dual-level scenario, the
                                                                    helped with article writing and methodology validation. KG set up
maximum total moments at the bottom of the rotor shaft are          the experiment and helped with the experiment methodology, data
limited by 20.6 %, while the total moment amplitude is lim-         acquisition and problem solving. JS was responsible for the method-
ited by 87.4 %.                                                     ology aid and validation, as well as quality control.

5   Conclusions
                                                                    Competing interests. Author Jan Wiśniewski has filed for IP
                                                                    protection of solutions related to the presented concept prior to con-
In the laboratory-scale model the lift-based bending moment
                                                                    ducting validation presented in the article and has shared ownership
component at the bottom of the turbine shaft became lost and        within a wind-industry-related company – Vertical Axis Wind Tech-
unmeasurable among the measurement noise and a very un-             nologies LLC.
favorable lift-to-drag ratio of the NACA0018 airfoil at low
Reynolds numbers. Within the simulations, the 2.4 million to
4 million Reynolds numbers were much more advantageous              Special issue statement. This article is part of the special issue
in terms of airfoil lift-to-drag ratios, resulting in a lift com-   “Wind Energy Science Conference 2019”. It is a result of the Wind
ponent taking a more distinct role in total bending moment          Energy Science Conference 2019, Cork, Ireland, 17–20 June 2019.
values at the bottom of the rotor shaft. The influence of the
lift-based component on total moments is much lower than
the Y component even in the large-scale simulation, resulting       Acknowledgements. We acknowledge members of the WUT Di-
in a small increase of maximum total moment value limiting          vision of Aerodynamics, for their constant insight and helpfulness.
and a slight decrease in limiting the total amplitude within
a cycle. Both the experimental testing and large-scale CFD
validation offered very high levels of reduction of bending

https://doi.org/10.5194/wes-6-287-2021                                                        Wind Energ. Sci., 6, 287–294, 2021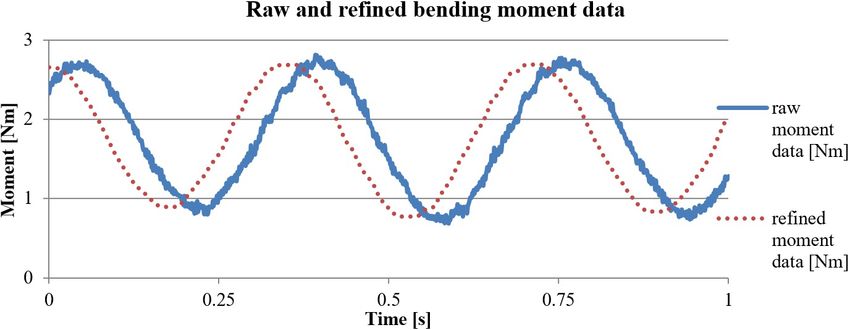
294                                                  J. Wiśniewski et al.: Wind tunnel comparison of four VAWT configurations

Review statement. This paper was edited by Raúl Bayoán Cal           Kiss, P. and Janosi, I. M.: Comprehensive empirical anal-
and reviewed by Peter Jamieson and one anonymous referee.              ysis of ERA-40 surface wind speed distribution over
                                                                       Europe, Energ. Convers. Manag., 49, 2142–2151,
                                                                       https://doi.org/10.1016/j.enconman.2008.02.003, 2008.
                                                                     Laneville, A. and Vittecoq, P.: Dynamic Stall: The Case of the Ver-
References
                                                                       tical Axis Wind Turbine, J. Sol. Energy Eng., 108, 140–145,
Ahmadi-Baloutaki, M., Carriveau, R., and Ting, D. S.-K.:               https://doi.org/10.1115/1.3268081, 1986.
   Straight-bladed vertical axis wind turbine rotor design           Marini, M., Gazzano, R., and Satta, A.: Semi-Empirical Methods
   guide based on aerodynamic performance and load-                    for the Analysis of Vertical Axis Wind Turbines With Helical
   ing analysis, Journal of Power and Energy, 228, 742,                Blades, ASME Turbo Expo 2010: Power for Land, Sea, and Air
   https://doi.org/10.1177/0957650914538631, 2014.                     conference paper, https://doi.org/10.1115/GT2010-23460, 2010.
Chinchilla, R., Guccione, S., and Tillman, J.: Wind Power Tech-      Oerlemans, S. and Migliore, P.: Aeroacoustic Wind Tunnel Tests
   nologies: A Need for Researchand Development in Improving           of Wind Turbine Airfoils, 10th AIAA/CEAS Aeroacoustics
   VAWT’s Airfoil Characteristics, J. Indust. Technol., 27, 1–13,      Conference, 10–12 May 2004, Manchester, Great Britain,
   https://doi.org/10.1155/2018/8350243, 2011.                         https://doi.org/10.2514/6.2004-3042, 2004.
Galinos, C., Larsen, T., Aagaard Madsen, H., and Schmidt             Parashivoiu, I.: Wind Turbine Design: With Emphasis on Darrieus
   Paulsen, U.: Vertical Axis Wind Turbine Design Load                 Concept, PIP, 438 pp., ISBN-10 2553009313, ISBN-13 978-
   Cases Investigation and Comparison with Horizon-                    2553009310, 2002.
   tal Axis Wind Turbine, Energy Procedia, 94, 319–328,              Rogowski, K., Hansen, M., and Maroński, R.: Steady and unsteady
   https://doi.org/10.1016/j.egypro.2016.09.190, 2016.                 analysis of NACA 0018 airfoil in vertical-axis wind turbine, J.
Guo, J., Liu, L., Lv, X., and Tang, Y.: The Aerodynamic Analysis       Theor. Appl. Mech., 56, 203–212, https://doi.org/10.15632/jtam-
   of Helical-Type VAWT With Semi Empirical and CFD Method,            pl.56.1.203, 2018.
   proceedings of the International Conference on Ocean, Offshore,   Scheurich, F., Fletcher, T. M., and Brown, R. E.: Effect of blade
   and Arctic Engineering, OMAE2019-95207, V010T09A046,                geometry on the aerodynamic loadsproduced by vertical-axis
   https://doi.org/10.1115/OMAE2019-95207, 2019                        wind turbines, Proceedings of the Institution of Mechanical En-
Iida, A., Mizuno, A., and Fukudome, K.: Numerical Simulation of        gineers, Part A: Journal of Power and Energy, 225, 327–341,
   Aerodynamic Noise Radiated form Vertical Axis Wind Turbines,        https://doi.org/10.1177/2041296710394248, 2011.
   Proceedings of the 18th International Congress on Acoustics,      Simão Ferreira, C., Aagaard Madsen, H., Barone, M., Roscher,
   Kyoto, Japan, 2004.                                                 B., Deglaire, P., and Arduin, I.: Comparison of aerodynamic
Islam, M., Fartaj, J., and Carriveau, R.: Analysis of the De-          models for Vertical Axis Wind Turbines, Journal of Physics:
   sign Parameters Related to a Fixed-Pitch Straight-Bladed Ver-       Conference Series, 524, 012125, https://doi.org/10.1088/1742-
   tical 240 Axis Wind Turbine, Wind Engineering, 32, 491–507,         6596/524/1/012125, 2014.
   https://doi.org/10.1260/030952408786411903, 2008.

Wind Energ. Sci., 6, 287–294, 2021                                                        https://doi.org/10.5194/wes-6-287-2021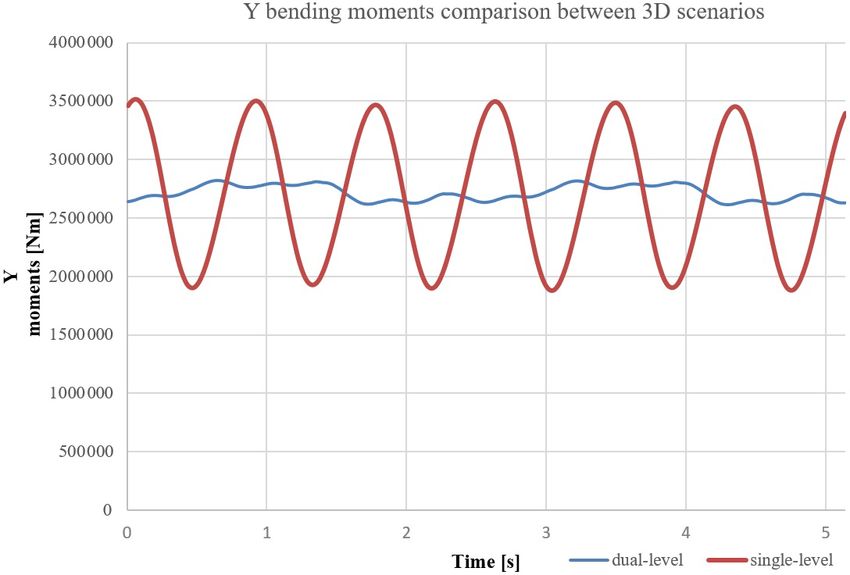
You can also read