Enigmatic Gravity Effects Observed during Solar Eclipses. Their Analyse by Quantum Model of Inertia and Gravitation
←
→
Page content transcription
If your browser does not render page correctly, please read the page content below
Applied Physics Research; Vol. 13, No. 2; 2021
                                                                              ISSN 1916-9639      E-ISSN 1916-9647
                                                               Published by Canadian Center of Science and Education

           Enigmatic Gravity Effects Observed during Solar Eclipses.
          Their Analyse by Quantum Model of Inertia and Gravitation
                                                  Claude Poher1
1
    Laboratoire Aurora - 33 Chemin de la Bourdette - F31400 - Toulouse, France
Correspondence: Claude Poher, Laboratoire Aurora - 33 Chemin de la Bourdette - F31400 - Toulouse, France.
Tel: (33) (0) 562 177 896. E-mail: claude.poher@wanadoo.fr

Received: May 19, 2020             Accepted: September 30, 2020             Online Published: June 30, 2021
doi:10.5539/apr.v13n2p1                  URL: http://dx.doi.org/10.5539/apr.v13n2p1

Abstract
Foucault long pendulums, with spherical suspended mass, show Earth rotation by the constant velocity drift of
their oscillation plane. Maurice Allais used a short, 84 centimeters pendulum, with a suspended bronze disc mass.
He recorded its oscillation plane drift velocity, during solar eclipses, in 1954 and 1959. Both times, he noticed an
anomalous drift of the oscillation plane. Several authors confirmed the effect, during next solar eclipses, with
other types of pendulums. Then a group of Geophysicists, from the Science Academy of China, used an accurate
digital gravimeter to measure Earth Gravity acceleration during March 09, 1997 solar eclipse. Their gravimeter
recorded two drops of Earth Gravity acceleration (respectively 5.02 and 7.7 µ Gals) before and during first and
last contacts of the Moon disc. However there was no acceleration drop during eclipse totality. Same phenomena
were confirmed later, during next solar eclipses, with the same gravimeter. No classical causes for these facts
were found, since modern gravimeters take care of temperature and atmospheric pressure variations. We analyse
the effect of Moon rotation, and of solar Corona mass, in the frame of our Quantum model of Inertia and of
Gravitation. The model predicts that Moon / Earth Gravity acceleration changes, when the Moon direction is
close to the Sun one, as observed from the gravimeter place. That phenomenon should be tied to Quantum
fluctuations dispersion by matter. Recorded measurements confirm that interpretation.
Keywords: Gravitation, Solar Eclipses, Allais Effect, Gravity Drop during Solar Eclipses
1. Introduction
1.1 Background
First known from Toricelli in 1647, then better from Huygens in 1659, small amplitude oscillations periods T of
pendulums of length L are isochronous, and tied to Earth Gravity acceleration g: T = 2π (L/g) ½. That was the
first instrument used to measure Earth Gravity acceleration g.
Leon Foucault demonstrated that a pendulum, made of a spherical mass, suspended by a long length L wire,
oscillates with a constant drift velocity of the pendulum oscillation plane. The plane rotates clockwise in the
North Earth hemisphere. A full turn is observed in 23 hours, 56 minutes and 4 seconds at North Pole. No plane
rotation is observed at Earth equator, and anti-clockwise rotation is seen in the South Earth hemisphere. Foucault
installed a 64 meters long demonstration pendulum, into the Pantheon monument in Paris, (Foucault, 1851),
where the oscillation plane rotates a full turn in about 1.4 days.

                        Figure 1. Leon Foucault and the Pantheon pendulum demonstration

                                                         1
apr.ccsenet.org Applied Physics Research Vol. 13, No. 2; 2021
Similar “pedagogical” pendulums were installed in Belgium, Burundi, Canada, Czechoslovakia, Germany, Italy,
Japan, Liechtenstein, Luxembourg, Norway, Poland, Spain, Switzerland, Tunisia, United Kingdom, and USA.
Such long and slow pendulums were however not used for observations during solar eclipses.
1.2 Maurice ALLAIS Observations
Maurice Allais (1911 - 2010), engineer and contemporary physicist, Nobel economy laureate in 1988, was
interested by Gravitation during his career. He observed the behaviour of a “paraconical” pendulum during solar
eclipses of 1954 and 1959.
Figure 2. Maurice Allais and his 84 cm long pendulum
Maurice Allais experiments consisted to leave the pendulum disc oscillating, while recording carefully its
clockwise azimuth drift, versus time. Oscillations were damped by air drag, so the pendulum oscillation had to
be reset every 20 minutes approximately. Allais took great care not to perturb the pendulum from wind or
personal movements. During 1954 and 1959 solar eclipses, visible from France, Allais observed strong
modifications of the pendulum oscillation plane drift velocity.
The anomalous effects were intense (10 Grads azimuth change during short time eclipses), so Allais informed the
French Science Academy (Allais 1954 & 1959).
Figure 3. Allais pendulum oscillation plane drift, (Grades, Hours), during 1954 solar eclipse
Figure 4. Allais pendulum oscillation plane drift (Grades, Hours), during 1959 solar eclipse
2apr.ccsenet.org Applied Physics Research Vol. 13, No. 2; 2021
1.3 Other Similar Allais’ Observations during Subsequent Eclipses
Maurice Allais was not the only observer of these enigmatic phenomena during solar eclipses. For example,
Mishra & al (Mishra, 1995) observed the behaviour of a gravimeter with ± 0.01 µ Gal resolution at slow time
scale, during October 24, 1995 solar eclipse in India. (One µ Gal = 10 — 8 m/s 2).
Figure 5. Mishra et al., gravimeter signal, during October 24, 1995 solar eclipse.
Top, signal without Earth tidal correction. Bottom, with Earth tidal correction.
Figure 6. Comparison of Mishra’s et al., (Left), and Allais’ observations (Right) expressed similarly
Several authors replicated Maurice Allais’ work, and observed similar facts, with different kinds of pendulums or
gravimeters (Saxl et al., 1964, 1965, 1970, 1971), (Latham et al., 1980), (Jun et al., 1991), (Kuusela, 1991, 1992),
(Brenes & al; 1993), (Savrov, 1997), (Mihaila et al., 2003).
Observations with pendulums had a too low time resolution, for being exploited with our quantum model.
There were similar attempts, with superconducting gravimeters, during the 1999 total solar eclipse, visible from
the north of France, but with not enough gravity sensitivity, and too much noise, for our exploitation.
Figure 7. Gravity accelerations during 1999 total solar eclipse with ± 10 — 3 m/s 2 sensitivity
These attempts were a pity, because of inadequate choice of gravimeters sensitivity, and inadequate time
resolution, despite the fact that 1999 eclipse was ideally situated.
3apr.ccsenet.org Applied Physics Research Vol. 13, No. 2; 2021
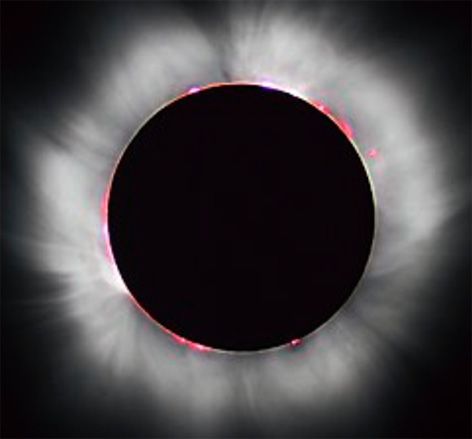
Figure 8. Personal picture of the 1999 solar eclipse with hot gas Corona.
See that angular thickness of solar corona was about 25 % the Moon angular diameter in 1999.
1.4 Observations with a High Resolution LaCoste-Romberg Gravimeter
Fortunately a group of Geophysicists from Sciences Academy of Beijing (China), used the best available digital
gravimeter, to measure Earth Gravity acceleration during several solar eclipses, for example the one of March 09,
1997 (Wang & al, 2000, 2002, 2003). Their gravimeter had a sensitivity of about one µ Gal, and could record
acceleration values at one sample per second rate. The gravimeter output signal was recorded on a portable
computer and corrected automatically from Earth tidal effects.
Figure 9. LaCoste-Romberg Gravimeter, the kind used by Wang et al., during solar eclipse of 1997
Figure 10. Gravity acceleration measured along seven days (1997 Solar eclipse in the middle).
Random output noise of instrument = ± 0.5 µ Gal, Eclipse signal > — 5 µGal.
4apr.ccsenet.org Applied Physics Research Vol. 13, No. 2; 2021
Figure 11. The two gravity drops, during the 1997 solar eclipse. We added Moon shadow displacements
onto Earth surface, during that eclipse. Acceleration drops observed before and after first and last contacts.
Figure 12. The gravimeter measures the relative length of a spring charged by a known mass.
Therefore only the vertical component of Gravity is measured this way.
LaCoste-Romberg gravimeters are based on the displacement of a mass suspended by a spring.
In order to avoid effects of temperature change and of atmospheric pressure change, LaCoste-Romberg
gravimeters sensors are enclosed into a vacuum chamber, with accurately piloted temperature.
Figure 13. Part of the patented internal diagram of a LaCoste-Romberg type gravimeter.
On the left side is the temperature controlled vacuum chamber with acceleration sensor.
5apr.ccsenet.org Applied Physics Research Vol. 13, No. 2; 2021
Such precautions are required, as atmospheric pressure and external temperature change during a solar eclipse.
Figure 14. Example of atmospheric pressure change during the 1999 Solar Eclipse
Professional gravimeters make automatic corrections for the modelled Earth tides, Figures 10 & 11 were
corrected automatically this way.
Figure 15. Example of tidal corrections from a LaCoste-Romberg gravimeter.
These tidal accelerations are quite slow as compared to the eclipse anomaly.
The Wang et al., group of Geophysicists measured Gravity, during several other eclipses, with similar results. Let
us quote what they published about that:
“To further study the gravity effects related to solar eclipses, our scientific team took more observations during
Zambia total solar eclipse of June 2001 and Australia total solar eclipse of December 2002. After data
corrections, we found respectively two gravity anomalies, with 3 to 4 μ Gal for Zambia eclipse and 1.5 μ Gal for
Australia eclipse”.
The effect of external temperature change, onto gravimeter signal, is known from manufacturer calibration:
Figure 16. Upper curve is the gravimeter vacuum chamber temperature change (right scale) when external air
temperature varies from + 45 ° C to + 22 ° C. Time scale in hours, along a full day.
Lower curve is the gravimeter output signal, with tidal effect (left scale, with noise = ± 0.5 µGal).
6apr.ccsenet.org Applied Physics Research Vol. 13, No. 2; 2021
2. Discussion
2.1 There Was No Gravitation Absorption by the Moon Mass during the Solar Eclipse
Several authors expressed their intention to verify if there is Gravitation absorption by the Moon mass. For
example, Wang et al., (2000) wrote: “The present work was thus motivated to test the possible effect of
gravitational shielding during a total solar eclipse”. Or Ruymbeke et al., (2003): “Search for the gravitational
absorption effect”. However, real gravimeter signal shows (Figures 10 & 11) that Earth Gravity acceleration
value is the same, long before, during, and long after, the eclipse totality. The two Gravity acceleration drops are
only momentary phenomena, occurring before first contact and after last contact, not during eclipse totality.
2.2 There Were No Instrumental or Environmental Artefacts
A physicist (Van Flanders, 2003), among others, suspected a Gravity drop caused by action, on the gravimeter, of
local atmospheric pressure variation, or temperature variation, during solar eclipse. This hypothesis ignores the
fact that LaCoste-Romberg gravimeters sensors are enclosed into a thermally controlled vacuum chamber.
Therefore such instrumental or environmental causes are ruled out, particularly when looking at time scale of
atmospheric pressure, and of local temperature, during an eclipse, versus the fast signal variation of Figure 11.
The Wang group refutes such possible causes itself:
“As many scientists have pointed out that pressure-gravity factor is lower than 0.3 μ Gal / hPa, it means that any
gravity anomaly greater than 0.5 μ Gal could not be inferred as the results of atmospheric pressure change. The
two more gravity anomalies recorded during the solar eclipses provided us strong evidence that some gravity
anomalies could not simply be inferred as atmospheric pressure change.”
Therefore, clearly, there was not any artefact, into that enigmatic phenomenon. Figure 10 is particularly clear.
2.3 The Anomaly Amplitude Is Tied to the Moon Height Over the Horizon
According to Figure 11 time scale, in minutes, first contact of Moon disc occurred at time 483.7 minutes, and
last contact occurred at time 622.9 minutes.
However, the two minima of Gravity acceleration drops occurred respectively at 458.33 minutes and 633.33
minutes, this means 25.37 minutes before first contact, and 10.43 minutes after last contact.
From the latitude, and from eclipse timing, we calculate the Moon height over the local horizon at different
instants. It was 7.725 ° during the minimum of first acceleration drop, of 5.02 ± 1.64 µ Gal. And it was 30.251 °
during the minimum of second acceleration drop, of 7.7 ± 1.77 µ Gal.
Therefore the largest acceleration drop occurred while the Moon was much higher into the sky.
So we propose the hypothesis that the gravimeter measured the vertical component of an acceleration, tied to the
Moon position in the sky. In this case, there should be more acceleration drop when the moon direction is closer
to the zenith direction. This is effectively what was measured.
However, the gravimeter did not measured an acceleration drop proportional to a constant value, times the sinus
of the Moon height, over the horizon. Effectively, Ratio [sin(30.251 °) / sin(7.725 )] = 0.267, and Ratio (5.02 µ
Gal / 7.7 µ Gal) = 0.652, this means the acceleration drops were relatively smaller by a factor 2.44 times, than
the Moon relative height change. This means that the acceleration drop real cause was not constant along the full
eclipse. Nevertheless, there is apparently an effect of the acceleration drop projection along the vertical axis.
2.4 The Two Gravity Drop Durations Were Tied to the Moon Diameter
Onto Figure 11, we added the displacement of Moon shadow, on Earth surface, during the eclipse, from the
eclipse timing and Astronomical movements. We see that the first Gravity acceleration drop corresponds to a
Moon shadow displacement of 3517 km (from timing measured along the horizontal doted line, which is the
average acceleration value before eclipse). And the second Gravity acceleration drop corresponds to a Moon
shadow displacement of 3297 km. We know that the Moon diameter is 3476 km. Therefore the two Gravity
drops durations corresponded respectively to 101.17 % and 94.85 % the Moon diameter displacement. So when
taking into account errors margins, into evaluation of these durations, from noisy Figure 11 gravimeter signal, we
can really consider that the two drops were exactly caused by Moon direction change, relative to the Sun
direction.
2.5 There Are Three Accelerations Involved during a Solar Eclipse
Three astronomical masses are acting onto the gravimeter sensor mass: The Earth mass, the Moon mass, and the
Sun mass. We can calculate the three Gravitational accelerations, according to Newton’s Law:
7apr.ccsenet.org Applied Physics Research Vol. 13, No. 2; 2021
Acceleration = G M* / D 2 (1)
—11 3 —1 2
Where G = 6,6725985 . 10 m . kg . s , M* is the distant mass, and D is the distance expressed in meters.
We need:
Mass of Sun: 1.9891 .10 30 Kg
Average distance Earth / Sun: 1.49597870 .10 11 m
Mass of Earth: 5.977 .10 24 Kg
Average Earth radius: 6.378 .10 6m
Mass of Moon: 7,3 .10 22 Kg
Average diameter of Moon: 3.476 .10 6 m
Average Distance Earth - Moon: 3.84400 .10 8 m
Here are the three gravitational accelerations “seen” from the gravimeter position:
— Acceleration from Earth: 9.8 .10 8 μ Gals
— Acceleration from Moon: 3.297 .10 3 μ Gals
— Acceleration from Sun: 5.93 .10 5 μ Gals These accelerations are not oriented in the same space direction. The
gravimeter measures only their vertical component, which varies with the sinus of Moon height, and with the
sinus of Sun height, over the local horizon:
— Acceleration measured by gravimeter from Earth: 9.8 .10 8 μ Gals.
— Acceleration measured by gravimeter from Moon: 3.297 .10 3 μ Gals, times sin (Moon height).
— Acceleration measured by gravimeter from Sun: 5.93 .10 5 μ Gals, times sin (Sun height).
During eclipse, height of Sun, and height of Moon, are almost equal, but both vary along the eclipse, from 7.725 °
to 30.251 °, with 21° common height at totality.
Therefore at totality only the gravimeter “sees”:
— Vertical Acceleration from Earth: 9.8 .10 8 μ Gals.
— Vertical Acceleration from Moon: 1.1815 .10 3 μ Gals.
— Vertical Acceleration from Sun: 2.125 .10 5 μ Gals.
Therefore if we make the hypothesis of a variation of the Moon Gravity acceleration, we see that 5.02 µ Gal drop
corresponds to 1.13 % of the Moon Gravity acceleration before first contact, and that 7.7 µ Gal drop corresponds
to 0.46 % of the Moon Gravity acceleration after last contact.
2.6 What Is Gravitation Cause into Our Quantum Model?
In order to be able to analyse gravimeter observations during solar eclipses in the frame of our Quantum model
of Gravitation (Poher, 2020), we must first recall what is Gravitation cause into that model.
The model predicts that Gravitation is an effect of Quantum Fluctuations of a general Quantum flux. This flux,
(confirmed by laboratory experiments, Poher, 2011), is made of Quanta (Universons), propagating at light speed,
and bearing each a same momentum (2.83 .10 — 29 kg.m/s). That natural Universons flux is isotropic, with a
tremendous intensity (6.3 .10 80 Universons / s . m 2 into the 4π steradians).
There is a permanent interaction of these Quanta with elementary matter particles. Each interaction develops
during constant time (7.8 .10 — 14 second), and is made without final energy exchange.
However, when the matter particle is accelerated, Universons quit the interaction with a trajectory direction
change, proportional to the matter particle acceleration value. There is however no absorption of Universons by
matter.
The main natural isotropic flux of these Quanta contains permanent random fluctuations, of its intensity and of
its flow direction. These fluctuations have an average very large intensity (2.5 .10 40 Universons / s.m 2 into the
4π steradians). They are quite brief (average duration each of 4 .10 — 41 second) and each of their own variable
direction of propagation is fully random, but with a global average isotropy.
An isolated matter particle, situated far away, in Space, is not perturbed by these fluctuations for two reasons:
— They are isotropically distributed on average, even if their occurrence is fully random.
— They are much too brief as compared to relatively slow interactions of matter with Universons.
Effectively, the interaction duration is 2 .10 27 times longer than an average fluctuation duration.
2.6.1 Let Us Take an Example to Illustrate This
Let us consider a Neutron of mass 1.67 .10 — 27 kg, interacting with the main Universons flux. The
average number of Universons into the permanent process of interaction with that Neutron is quite
large (1.7735 .10 10 Universons). Among these 17.7 billions of Universons, the vast majority comes
8apr.ccsenet.org Applied Physics Research Vol. 13, No. 2; 2021
from the isotropic main flux. Only one Universon over 133000 comes from a fluctuation. So there are,
on average, only 7.5 .10 — 6 of the interacting Universons, that are coming from fluctuations of the
main flux. These are really a minority.
Therefore, when the interaction of each of these 17.7 billions of Universons is finished, after 7.8 .10 —
14
second has elapsed, the direction of re-emission of the minority of Universons, coming from
fluctuations, is governed by the average acceleration of the matter particle, not by the initial direction
of the incoming fluctuation.
This means that matter is a kind of “filter” for fluctuations. The incident interacting flux contains
fluctuations, but the emergent flux contains much less fluctuations (there remains only Universons
from fluctuation that have not interacted). This is also true for macroscopic matter of course.
End of Neutron example.
This phenomenon of “partial transmission of fluctuations” occurs also of course for masses of matter of the Sun,
of the Moon and of the Earth.
For the gravimeter, installed onto the Earth surface, there are incoming Universons (Gravitational Quanta) from
all directions of Space. However, the Earth mass disperses a part of the Universons from fluctuations, coming
from the NADIR direction. And there is no such dispersion from the Zenith direction.
This is the reason why the sensor mass of the gravimeter is accelerated towards the Nadir direction, as the
Universons average flux intensity is larger from the Zenith than from the Nadir. This is Gravity acceleration
from Earth mass.
The same phenomena apply for the Moon mass and for the Sun mass. There are LESS Universons, going
towards the accelerometer, from the directions of the mass center of these astronomical bodies, exactly as it is
the case for Earth mass.
3. Solar Eclipse Interpretation from Universons Model
During solar eclipse, the Sun mass and the Moon mass get progressively aligned, as seen from the gravimeter
installed on Earth surface. So there are FIVE Universons fluxes to consider for the gravimeter sensor. The
sensor reacts proportionally to the sum of these five fluxes.
Figure 17. .Instant of first contact during a solar eclipse. On Earth surface two Universons fluxes are flowing
The main flux comes from deep space through the Sun mass. The secondary flux comes from deep space through
.the Moon mass. But before the first contact, part of the secondary flux comes also through the sun Mass
Flux #1 is coming from deep space, though Earth mass, in the nadir direction (really from 2π steradians under
the gravimeter). This flux is “amputated” of a part of its fluctuations (proportionally to Earth mass). This flux is
not illustrated onto Figure 17, it would come from the right side of Figure 17.
Flux #2 is coming from deep space, all around the Sun and Moon directions, (from 2 π steradians minus the Sun
and Moon solid angles directions). This flux contains ALL fluctuations coming from these directions. This flux
is not illustrated onto Figure 17.
Flux #3 is coming from deep space, through the SUN mass. This flux is “amputated” of a part of its fluctuations
(proportionally to Sun mass). This flux is shown as deep grey onto Figure 17.
Flux # 4 is coming from deep space, through the MOON mass. This flux is “amputated” of a part of its
9apr.ccsenet.org Applied Physics Research Vol. 13, No. 2; 2021
fluctuations (proportionally to MOON mass). This flux is not illustrated onto Figure 17.
Flux #5 is part of Flux #4, but is coming also through the surrounding SUN mass (Corona) before going
through the MOON mass. This flux is illustrated in pale grey onto Figure 17. This flux is more “amputated” of a
part of its fluctuations (proportionally to SOLAR CORONA plus MOON masses).
We should effectively not forget that there is a lot of matter mass, around the Sun disc, as seen from the
gravimeter (see solar Corona on Figure 8 for example). Therefore Flux #5 “shape and thickness” are tied to solar
Corona shape and dimension behind the Moon direction, as seen from the gravimeter position.
The Moon rotates (one turn in 29.53 days), so its matter particles are all accelerated. If they were not accelerated
they would propagate in straight trajectories instead of following the Moon rotation.
Therefore according to Universons Inertia model, the moon particles deviate Universons trajectories interacting
with them. The deviation angle is small, because matter Moon particles acceleration A is small:
= 2 π A /c (2)
— 22
Moreover ratio /c (interaction duration / speed of light) is equal to 2.6 .10 , but the number of matter
particles involved, as well as the number of Universons involved, each second, are huge numbers. So the
Universons trajectory deviation, into Flux # 5, can be measured by the Gravimeter. This is equivalent to a
momentary change of the Moon-Earth Gravitation acceleration of a few µ Gals when projected onto the vertical
direction of gravimeter sensitivity.
When the Moon is far away from the Sun direction, there is no Flux #5 at all. There is of course Moon rotation,
but Flux # 4 is deviated symmetrically, by Moon rotation, (Universons coming from the left side of Moon are
deviated in one direction, and Universons coming from the right side of Moon are deviated in the opposed
direction, therefore the global effect is nil), so that the gravimeter does not receive a modified total Flux # 4 from
the moon direction when the Moon is not eclipsing the sun.
Therefore it is only close to the Sun direction, during an eclipse, that Flux #5 exists, acting more on one half of
the Moon, than on the other half, because of solar Corona “thickness”. And in this case the Moon rotation
decreases the Moon Universons flux # 5, towards the gravimeter, causing acceleration drop measurement.
This means that there are less Universons (Flux # 4 + Flux #5) coming from Moon direction towards the
gravimeter. This is the cause of a reduction of Earth Gravity acceleration (less Universons coming from the 2 π
steradians of sky).
When the Moon and the Sun are aligned during totality, there is no more dissymmetric Flux #5, so there is no
more Gravity anomaly.
And Flux #5 exists again after totality, away from last contact, for the same reasons, with the same results.
4. Only a PUSHING Gravitational Quanta Model Can Explain Gravimeter Behaviour
Gravimeter sensor mass is pushed down, towards Earth center, because it is pushed by temporary interactions of
Gravitational Quanta (Universons) bearing each a momentum. The incident flux onto that mass is not
isotropically distributed. The flux of these quanta, coming from the upper 2π steradians is larger than the flux
coming from the lower 2π steradians.
During the two drops of Gravity acceleration, before and after the eclipse, there is less push onto the sensor mass,
from the upper 2π steradians, not because there is absorption (there is no acceleration drop during totality), but
because Quanta (Flux # 5) coming through the Moon mass are deviated (dispersed). That deviation occurs only
when the Moon comes close to the sun direction, and receives a modified dissymmetric Universons flux by solar
Corona and Moon rotation.
That effect could not be explained by a reduction of Earth mass, or an increase of Moon mass, at these instants.
So it cannot be explained by an “Attractive” model of Gravitation (such as Newton’s model). Nor could it be
explained by a General Relativity distortion of Space-time, caused by masses, which are constant.
Only a Quantum Model, with pushing Quanta, and no absorption, can explain the observed facts, into their
details. Our Universons model of Gravitation has these properties (Poher, 2020).
5. Conclusion
These gravitational phenomena are quite difficult to calculate exactly. Effectively, solar Corona mass density,
and total thickness, are changing, from one eclipse to the next one. And also because the effect of Moon rotation
depends on the density of matter inside the Moon, which is not well known.
10apr.ccsenet.org Applied Physics Research Vol. 13, No. 2; 2021
Nevertheless, finally, it appears that our Quantum model of Gravitation gives a plausible explanation, for this
enigmatic behaviour of gravimeters, or of pendulums, during solar eclipses. To our knowledge, there is not any
other pushing model considering Moon rotation and solar Corona effects.
And gravimeters bring, this way, a new experimental confirmation of our Quantum model.
Acknowledgements
Our work was not supported by any institutional organization from our country, or from Europe. We detain full
copyright for it. Our acknowledgements are therefore mainly for the members of our family and a few “hidden”
friends for their long patience and consensus.
Conflict of interests
The authors declare that there is no conflict of interests regarding the publication of this paper.
References
Allais, M. (1957). Anomalies des Mouvements du Pendule Paraconique. Comptes rendus de l’Académie des
sciences, 245, 2001-2003.
Allais, M. (1959). French Academy of Sciences. C.R.A.S. (1959) 245, 1875; 245, 2001; 244, 2469; 245,
2467;245;2170; in English in Aero/Space Engineering, September and October, 1959 (18, (9) and (10).
Allais, M. (2001). Mouvement du pendule paraconique et éclipse totale de Soleil du 30 juin 1954. C.R. Acad. Sci.,
245(1957), 2001.
B. Hofmann-Wellenhorf et H. Moritz, Physical geodesy, Springer. (2005). (ISBN 978-3-211-33544-4). Gphonex
gravity meter Technical manual. Retrieved from http://microglacoste.com/product-category/rentals/
Brenes, J., Leonardo, G., & Fernandez, W. (1993). Variation of the geomagnetic-field in Costa-Rica during the
total solar eclipse of July 11, 1991. Earth, Moon and Planets, 63(1993), 105.
https://doi.org/10.1007/BF00575100
Foucault. (1851). Démonstration physique du mouvement de rotation de la Terre au moyen du pendule. Comptes
Rendus des Séances de l’Académie des Sciences (1851), Paris, 32, 135-138. Retrieved from
https://gallica.bnf.fr/ark:/12148/bpt6k2989j/f135
Jun, L., Jianguo, L., Xuerong, Z., Liakhovets, V., M.Lomonosov, M., & Ragyn, A. (1991). Observation of 1990
solar eclipse by a torsion pendulum. Phys. Rev. D, 44(8), 2611-2613.
https://doi.org/10.1103/PhysRevD.44.2611
Kuusela, T. (1991). Effect of the solar eclipse on the period of a torsion pendulum. Phys. Rev. D, 43(6), 2041-2043.
https://doi.org/10.1103/PhysRevD.43.2041
Kuusela, T. (1992). New measurements with a torsion pendulum during the solar eclipse. Gen. Relativ. and
Gravitation, 24(1992), 543. https://doi.org/10.1007/BF00760136
Latham, R. (1980). An Interim Report on a repeat of the Allais Experiment – the measurement of the rate of
increase of the minor axis of a Foucault pendulum – using automatic apparatus. I.C. Report G28, Imperial
College, London (p. 70).
Mansinha, L., Ducarme, B., Hinderer, J., Meurers, B., & van Ruymbeke, M. (2001). Search for the gravitational
absorption effect using superconducting gravimeters during the eclipse of August 11, 1999. J. Geodetic
Society of Japan, 47(2001), 387.
Meurers, B. (2000). Gravity observations during the eclipse 1999 in Vienna. Website Inst. Meteorology and
Geophys., Univ. Vienna.
Mihaila, I., Marcov, N., Pambuccian, V., & Agop, M. (2003). Observation de l’effet d’Allais lors de l’eclipse de
Soleil du 11 Août 1999. Proc. Romanian Academy A, 4(2003), 1.
Mishra, D. C., & Rao, M. B. S. (1997). Temporal variations in gravity field during solar eclipse on 24 October.
Current Science, 72(1997), 783.
Poher, C. (2006). European Patent publication WO 2007/093 699 A2, PCT FR 2007/000249. Retrieved from
https://www.epo.org/searching-for-patents.html
Poher, C. (2012). Theoretical hypotheses about Inertia and the gravitation interaction. Retrieved from
http://www.universons.org/site_publication/Textes_Publication/Suppl_material_3.pdf
11apr.ccsenet.org Applied Physics Research Vol. 13, No. 2; 2021
Poher, C., & Marquet, P. (2012). General Relativity and Universons. Applied Physics Research, 4(1).
https://doi.org/10.5539/apr.v4n1p120
Poher, C., & Modanese, G. (2017). Enhanced induction into distant coils by YBCO and silicon-graphte electrodes
under large current pulses. Physics Essays, 30, 4. https://doi.org/10.4006/0836-1398-30.4.435
Poher, C., & Poher, D. (2011). Physical phenomena observed during strong electric discharges into layered Y123
superconducting devices at 77 K. Applied Physics Research, 3(2), 51. https://doi.org/10.5539/apr.v3n2p51
Poher, C., & Poher, D. (2020). Gravity & matter Quantum behaviour, from accelerations, during electric
discharges into Graphite-based superconductor. https://doi.org/10.5539/apr.v12n3p48
Poher, C., & Poher, D. (2020). Quantum model of Inertia – Predictions - Confirmations, Consequences for
Gravitation into galaxies, and CDM Cosmology models. https://doi.org/10.5539/apr.v12n4p8
Savrov, L. A. (1997). Experiment with paraconic pendulums during the November 3, 1994 solar eclipse in Brazil.
Measurement Techniques, 40(1997), 511. https://doi.org/10.1007/BF02504372
Saxl, E. J. (1964). Nature London, 203, 136. https://doi.org/10.1038/203136a0
Saxl, E. J., & Allen, M (1971). 1970 solar eclipse as ‘seen’ by a torsion pendulum. Phys. Rev. D, 3, 823-825.
https://doi.org/10.1103/PhysRevD.3.823
Saxl, E., & Allen, M. (1965). Phys. Rev. D3, 823. In L. B. Slichter, M. Caputo, & C. L. Hager (Eds.), J. Geophys.
REs.(Vol. 70, No. 6, pp. 1541-1551). https://doi.org/10.1029/JZ070i006p01541
Tang, K., Wang, Q., Zhang, H., Hua, C., Peng, F., & Hu, K. (2003). Gravity effects of solar eclipse and inducted
gravitational field. Am. Geophys. Union, Fall Meeting 2003, Abstract #G32A-0735.
Universons Gravitation Quantum model in Suppl. (2012). Material append to C. Poher and P. Marquet. Appl. Phys.
Res., 4, 1.
Unnikrishnan, C. S., Mohapatra, A. K., & Gillies, G. T. (2001). Anomalous gravity data during the 1997 total
solar eclipse do not support the hypothesis of gravitational shielding. Phys. Rev. D, 63(2001), 062002.
https://doi.org/10.1103/PhysRevD.63.062002
Van Flandern, T. V., & Yang, X. S. (2003). «Allais Gravity and pendulum effects during solar eclipses explained».
Phys Rev, D 67, 022062. https://doi.org/10.1103/PhysRevD.67.022002
van Ruymbeke, M., Shaoming, L., Mansinha, L., & Meurers, B. (2003). Search for the gravitational absorption
effect using spring and super-conducting gravimeters during the total solar eclipse of August 11, 1999. Bull.
d’Information de Marées Terrestres (BIM), 138(2003), 10967.
Wang, Q. S., Yang, X. S., Wu, C. Z., Guo, H. G., Liu, H. C., & Hua, C. C. (2000). Precise measurement of
gravity variations during a total solar eclipse. Phys. Rev. D, 62(2000), 041101.
https://doi.org/10.1103/PhysRevD.62.041101
Yang, X. S., & Wang, Q. S. (2002). Gravity anomaly during the Mohe total solar eclipse and new constraint on
gravitational shielding parameter. Astrophys. Space Sci., 282(2002), 245.
https://doi.org/10.1023/A:1021119023985
Copyrights
Copyright for this article is retained by the author(s), with first publication rights granted to the journal.
This is an open-access article distributed under the terms and conditions of the Creative Commons Attribution
license (http://creativecommons.org/licenses/by/4.0/).
12You can also read