Methods and Challenges of Using the Greater Wax Moth (Galleria mellonella) as a Model Organism in Antimicrobial Compound Discovery - MDPI
←
→
Page content transcription
If your browser does not render page correctly, please read the page content below
microorganisms
Article
Methods and Challenges of Using the Greater Wax
Moth (Galleria mellonella) as a Model Organism in
Antimicrobial Compound Discovery
Athina Andrea 1 , Karen Angeliki Krogfelt 1,2                   and Håvard Jenssen 1, *
 1   Department of Science and Environment, Roskilde University, 4000 Roskilde, Denmark; atan@ruc.dk (A.A.);
     kak@ssi.dk (K.A.K.)
 2   Virus and Microbiological Special Diagnostics, Statens Serum Institut, 2300 Copenhagen, Denmark
 *   Correspondence: jenssen@ruc.dk

 Received: 22 February 2019; Accepted: 14 March 2019; Published: 19 March 2019

 Abstract: Among non-mammalian infection model organisms, the larvae of the greater wax moth
 Galleria mellonella have seen increasing popularity in recent years. Unlike other invertebrate models,
 these larvae can be incubated at 37 ◦ C and can be dosed relatively precisely. Despite the increasing
 number of publications describing the use of this model organism, there is a high variability with
 regard to how the model is produced in different laboratories, with respect to larva size, age,
 origin, storage, and rest periods, as well as dosing for infection and treatment. Here, we provide
 suggestions regarding how some of these factors can be approached, to facilitate the comparability of
 studies between different laboratories. We introduce a linear regression curve correlating the total
 larva weight to the liquid volume in order to estimate the in vivo concentration of pathogens and
 the administered drug concentration. Finally, we discuss several other aspects, including in vivo
 antibiotic stability in larvae, the infection doses for different pathogens and suggest guidelines for
 larvae selection.

 Keywords: invertebrate model; Galleria mellonella; infection model; antimicrobial compound

1. Introduction
      In order to study infectious diseases, as well as the in vivo potential of novel antimicrobials,
developing reliable animal models that mimic clinical manifestations in humans is essential.
Mammalian models are popular and often unanimously irreplaceable due to their similar physiology
to humans. Nevertheless, high cost and ethical issues complicate their use, especially when it comes
to large-scale settings. Invertebrate models offer a real possibility as early-stage in vivo screening
models, in an attempt to lower the number of candidate compounds proceeding to further evaluation
in mammalian models [1]. Invertebrates are excluded from the Animals Act 1986; therefore, ethical
constraints are relatively limited. Even though insects lack an adaptive immune system, they have an
innate immune system similar to that of mammals [2–4].
      Among insect models, the caterpillar larva of the greater wax moth Galleria mellonella (order
Lepidoptera, family Pyralidae) offers several attractive advantages, including the ability to incubate at
37 ◦ C, short life span, a size that is convenient for handling, and relatively precise dosing. The wax
moth’s popularity has remarkably increased in the last decade, with a plethora of studies providing
evidence that the Galleria mellonella (G. mellonella) is a reliable model to test pathogenicity of bacteria,
fungi, and viruses, as well as testing the effectiveness and toxicity of antimicrobial compounds [5–7].
When comparing different studies, it is apparent that there is a profound discrepancy from laboratory
to laboratory, with respect to how the larva infection model is performed (Table 1). Variability is

Microorganisms 2019, 7, 85; doi:10.3390/microorganisms7030085                  www.mdpi.com/journal/microorganisms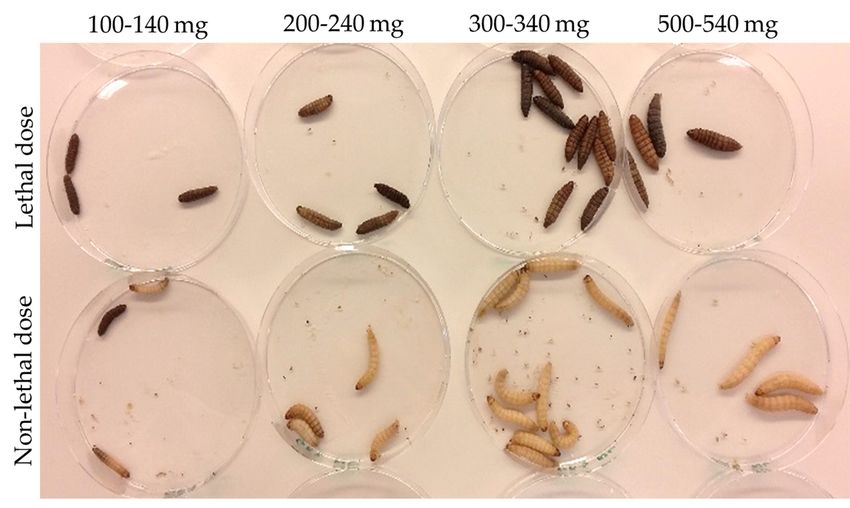
Microorganisms 2019, 7, 85                                                                                       2 of 9

due to several factors, including, among others, larvae sizes, origin, storage, dosing of infection, and
treatment. The aim of the present work is to propose practices in an attempt to unify larvae infection
protocols so that it will become easier to compare data across different studies in the future.

      Table 1. Comparison of experimental aspects of the G. mellonella model infection protocol, as performed
      in different laboratories, for two bacterial pathogens (Acinetobacter baumannii, Staphylococcus aureus).

                                                                                 Infection      Antimicrobial
 Experimental                                       Larva         Injection
                   Larva Size    Larva Origin                                      Dose             Dose,       Ref.
   Aspect                                          Storage           Site
                                                                                 CFU/larva      Expressed as
                   250–350 mg      P-China       4 ◦ C, 7 days        LP          1 × 10⁵       mg/larva kg      [8]
                    Not given       P-UK             15   ◦C      Left proleg     1×   104      Not relevant     [9]
     A.
                   250–350 mg       P-USA           7 days            LP          5×   105      mg/larva kg     [10]
  baumannii
                                                                                  1 × 10⁵ ,
                    Not given       P-UK         RT, 14 days          FP                        Not relevant    [11]
                                                                                  1 × 10⁴
                  250 ± 25 mg       P-UK             15 ◦ C       Not given       1 × 10⁵       mg/larva kg     [12]
                   150–200 mg       Reared           30   ◦C      Not given       1×   106      Not relevant    [13]
                                                                  Between
                    Not given       P-UK             4 ◦C                        ~1.3 × 10⁶     mg/larva kg     [14]
                                                                  segments
                 15–25 mm long      P-UK            7 days            LP        0.8–2.6 × 10⁶   Not relevant    [15]
                    ~250 mg        P-China        Not given           LP          ~1 ×   106    mg/larva kg     [16]
   S. aureus
                   300–700 mg    P-Netherlands    Not given           LP          1 × 10⁶       Not relevant    [17]
                                                                                                 µg/100 mg
                    ~200 mg       Not given       Not given           LP          1 × 10³                       [18]
                                                                                                   larva
                   200–300 mg       P-USA        4 ◦ C, 14 days       LP          5 × 10⁶       mg/larva kg     [19]
                    Not given       Reared           28   ◦C      Not given      Not given      Not relevant    [20]
      P = purchased, RT = room temperature, LP = last proleg, FP = front proleg, CFU = colony forming units,
      Ref. = Reference, A. baumannii = Acinetobacter baumannii, S. aureus = Staphylococcus aureus.

2. Materials and Methods

2.1. Galleria mellonella Larvae Liquid Volume Determination
     Last instar larvae were purchased from a local vendor (MiniZoo, Copenhagen, Denmark).
Individual healthy larvae of different sizes (n = 66) were weighed and placed in 1.5 mL eppendorf
tubes with a hole drilled on their lid. The weight of each individual tube containing a single larva
was also determined. Larvae were allowed to freeze at −80 ◦ C overnight and were subsequently
freeze–dried for three days (Alpha 1-2 LDplus, Martin Christ Gefriertrocknungsanlagen GmbH) using
a vacuum pump (RV12, Edwards). The weight of the tubes containing the larvae was measured, and
the weight of the liquid was determined by subtracting the weight of the tube before and after drying.
The haemolymph weight to volume ratio was found to be approximately one; therefore, we accepted
that the liquid weight of a single larva approximated its volume. The larva weight in milligrams was
plotted against the larva liquid volume in microliters. The regression line and R square values were
calculated using Excel.

2.2. Bacteria and Growth Conditions
     For G. mellonella infection experiments, the following bacterial strains were used: Pseudomonas
aeruginosa ATCC27853 (P. aeruginosa), S. aureus ATCC29213, Escherichia coli ATCC25922 (E. coli),
Staphylococcus epidermidis (S. epidermidis) clinical strain (HJ056) [21], and a methicillin–resistant S. aureus
(WKZ-2) [22]. All strains were cultivated in Mueller–Hinton broth (MHB) (BD Difco, DF0757-07-8) or
agar (MHB with 1.5% agar). Cultures were incubated at 37 ◦ C with shaking at 180 rpm.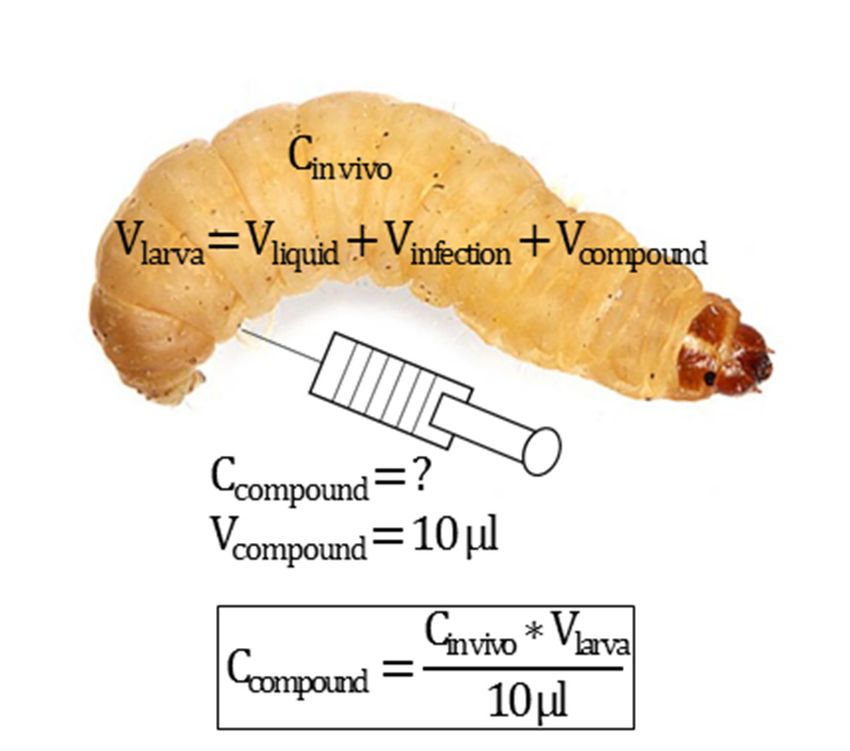
Microorganisms 2019, 7, 85                                                                           3 of 9

2.3. Galleria mellonella Infection
     Last instar larvae were purchased from a local vendor (MiniZoo, Copenhagen, Denmark). Upon
arrival, healthy larvae of 200 to 300 mg were selected (larva selection guidelines are reported in Text
S1) for the experiments and were stored at 13 ◦ C for up to 2 weeks, without food. Larvae were
allowed to acclimatize at 37 ◦ C one day before the experiment. Overnight cultures of bacteria were
prepared in 5 mL MHB. One milliliter of each culture was centrifuged for 7 min at room temperature at
6700× g. Supernatants were discarded, and the pellet was re-suspended in 1 mL of phosphate buffered
saline (PBS). The bacterial suspension was diluted in PBS to an OD600nm of 1, which corresponded to
approximately 1 × 10⁹ colony forming units per mL (CFU/mL). Inocula were always confirmed by
viable counts. Groups of 10 larvae were topically disinfected at the last left proleg with 70% ethanol
using a cotton swab and were injected with 10 µL bacterial suspension appropriately diluted in PBS,
using an Insumed syringe (0.3 mL, 31 G, Pic solutions). For each experiment, larvae injected with
10 µL PBS served as a control group to ensure that the injection procedure was not causing death.
Larvae were incubated at 37 ◦ C in the dark, without food, and were considered dead when they were
unresponsive to touch and dark brown to black in color. Survival was monitored every 24 h for up to
four days.

2.4. Bacterial Load in the Haemolymph
     Infected larvae were collected, and their surfaces were disinfected with 96% ethanol. The larvae
were placed on ice until no movement was observed. The haemolymph was collected individually
from each larva in eppendorf tubes by holding the larva with tweezers and puncturing the cuticle with
a sterile 18 G needle behind the head. The haemolymph was allowed to drain in the eppendorf tube.
Immediately after, serial 10-fold dilutions of the haemolymph were prepared in PBS. Ten microliters of
each dilution were plated on MH agar, in triplicates, and were allowed to dry. Colonies were counted
manually the next day after an overnight incubation at 37 ◦ C, and the CFU/mL haemolymph was
calculated. No colonies were obtained from control, non–infected larvae.

2.5. In Vivo Stability of the Antibiotic
     To investigate the in vivo stability of the antibiotic, healthy larvae of 350–400 mg were injected
with 490 µg/mL ciprofloxacin (Sigma, 17850). Larvae injected with PBS served as a control. Larvae
were incubated at 37 ◦ C, and at different time points (10 min, 1, 3, and 24 h), the haemolymph was
extracted (individually for each larva), as described in Section 2.4. Ten microliters of the freshly
extracted haemolymph of ciprofloxacin- or PBS-injected larvae were placed on MH agar, for each time
point, and were allowed to dry. One hundred microliters of an overnight E. coli culture were spread
over the agar to create a layer of bacteria. The plates were incubated overnight at 37 ◦ C, and inhibition
zones were observed the next day. The experiment was repeated twice, and representative plates
are presented.

3. Results

3.1. A Linear Regression Curve for G. mellonella Larvae Liquid Volume Determination
      Estimating the liquid volume of a larva can be important for dosing calculations. Often treatment
doses are expressed as milligrams of a compound per larva kilogram (mg/kg), following the human
dosing recommendations (Table 1). However, for compounds for which the minimum inhibitory
concentration (MIC) value is available, it can be relevant to express the treatment as Y× MIC in vivo.
Moreover, estimating the in vivo concentration of pathogens (CFU/mL of larva liquid volume) can
provide valuable information in infection experiments and allow for comparison between studies
where larvae of different sizes are employed. In order to correlate the total weight of a larva to its
liquid volume, we used 66 larvae of various sizes (weight range 100–740 mg). Larvae were dried, and
the liquid volume was plotted against the larva total weight (Figure 1). The liquid volume was found
Microorganisms 2019, 7, 85 4 of 9
to have a good correlation with the total larva weight, and the regression line gave an R square value
of 0.995. Nutrients 2019, 11, x FOR PEER REVIEW 6 of 13
Figure 1. G. mellonella larva total weight versus the liquid volume curve. Healthy larvae of different
sizes (n = 66)Table
were3.weighed
Effects of curtailed sleep on self-reported
and freeze-dried. sleepiness, tiredness,
The wet-minus-dry quality
weight wasofthe
sleeplarva
and hunger.
liquid weight,
which was found to be almost identical to theNormal liquidNightvolume. EachNight
Curtailed triangle represents data from a single
p-Value
Sleepiness 1 2.8 (1.3) 4.9 (1.9)Microorganisms 2019, 7, 85 5 of 9
indicates that
Microorganisms 2019,the
7, xlarva liquid
FOR PEER volume,
REVIEWas calculated from the curve, approximated reality. Control
5 of 9
larvae injected with PBS had no bacteria in their haemolymph, as proved by plating.
Figure 2. Lethal and non-lethal infection doses for different sizes of larvae. Larvae of different
Figure 2. Lethal
weights and non-lethal
were infected with ainfection doses and
known lethal for different
a knownsizes of larvae.
non-lethal Larvae of different
concentration weights
of E. coli. These
were infected with
concentrations wereaobtained
known in lethal
vivo and
baseda onknown non-lethal
the liquid volumeconcentration of E. coli.
calculation equation Thesein
presented
concentrations
Figure 1. The were obtained
theoretical in vivo based
concentrations on the
of the liquid
lethal and volume
non-lethalcalculation equation
cultures were presented
confirmed in
to have
Figure 1. The theoretical concentrations of the lethal and non-lethal cultures were confirmed
the correct number of bacteria based on standard CFU counts. Larvae of different weights receiving a to have
the correct
lethal dosenumber
had 0%ofsurvival
bacteriaafter
based
24 on standard
h, while CFU counts.
the larvae Larvae
receiving of different
a non-lethal doseweights receiving
survived.
a lethal dose had 0% survival after 24 h, while the larvae receiving a non-lethal dose survived.
1.0 × 10⁸
For the second experiment, larvae (n = 4) were infected with a known concentration of E. coli-
(confirmed by viable counts) and were sacrificed immediately after infection. The in vivo bacterial
load was determined in the haemolymph by viable counts and was compared to the theoretical
CFU/mL larva liquid as calculated from the curve. The theoretical versus the measured in vivo
CFU/mL larva liquid 1.0 was× 10
very
7 similar for all four tested larva weight ranges (Figure 3), which
indicates that the larva liquid volume, as calculated from the curve, approximated reality. Control
larvae injected with PBS had no bacteria in their haemolymph, as proved by plating.
1.0 × 10⁶
Figure 3. In vivo bacterial load in G. mellonella larvae. Larvae were infected with a known concentration
of E. coli equal to 1.3 × 10⁷ CFU/larva, as confirmed by plate counting. The theoretical in vivo bacterial
concentration was calculated based on larva liquid volume calculated from the curve. Immediately
after infection, larvae were sacrificed and bacterial load was determined in their haemolymph by
viable counts. The theoretically calculated (#) in vivo concentration was very similar to the measured
(∆) concentration.
Figure 3. In vivo bacterial load in G. mellonella larvae. Larvae were infected with a known
concentration of E. coli equal to 1.3 × 10⁷ CFU/larva, as confirmed by plate counting. The theoretical
in vivo bacterial concentration was calculated based on larva liquid volume calculated from the curve.
Immediately after infection, larvae were sacrificed and bacterial load was determined in their
haemolymph by viable counts. The theoretically calculated (○) in vivo concentration was very similar
to the measured (∆) concentration.Microorganisms 2019, 7, 85 6 of 9
Microorganisms 2019, 7, x FOR PEER REVIEW 6 of 9
3.2. Infection and Treatment Dose Must Be Tuned
3.2. Infection and Treatment Dose Must Be Tuned
Infection and treatment doses can be tuned using the larva liquid volume equation presented
in FigureInfection and treatment
1. Different bacterialdoses candemonstrated
strains be tuned using the larva liquid
different volume equation
pathogenicity presented in
in G. mellonella larvae.
Figure 1. Different bacterial strains demonstrated different pathogenicity in G. mellonella larvae. For
For example, for the P. aeruginosa strain used in the present study, the lethal dose after 24 h was only
example, for the P. aeruginosa strain used in the present study, the lethal dose after 24 h was only 50
50 CFU/larva, while for the E. coli strain, the lethal dose was in the magnitude of a million CFU/larva
CFU/larva, while for the E. coli strain, the lethal dose was in the magnitude of a million CFU/larva
(Figure 4). Therefore,
(Figure the infection
4). Therefore, dose must
the infection dose be tuned
must for each
be tuned forpathogen. For antimicrobial
each pathogen. compound
For antimicrobial
efficacy studies,efficacy
compound we believe that
studies, welarvae
believeshould be infected
that larvae should bewith the with
infected minimum lethal dose
the minimum lethal after
dose 24 h.
A higher
after infection dose infection
24 h. A higher might lower
dose the chances
might of achances
lower the candidate
of a antimicrobial compound
candidate antimicrobial to work, and
compound
24 h gives
to work,a relatively fast ascreening.
and 24 h gives Anscreening.
relatively fast example An of how to prepare
example of how tothe injected
prepare thesolution to achieve a
injected solution
to achieve a specific in vivo concentration is
specific in vivo concentration is presented in Figure 5. presented in Figure 5.
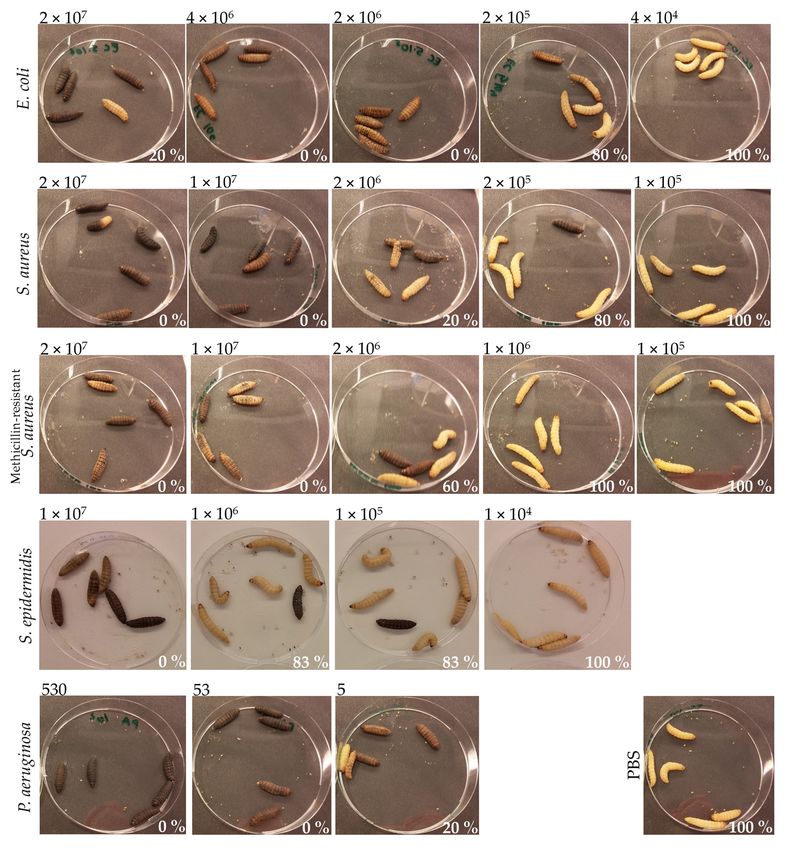
Figure 4. Pathogenicity of different bacterial species in G. mellonella larvae at 24 h post-infection.
Figure 4. Pathogenicity of different bacterial species in G. mellonella larvae at 24 h post-infection.
Larvae (n =(n5–6)
Larvae were
= 5–6) wereinfected
infectedwith decreasingconcentrations
with decreasing concentrations of each
of each of theoffollowing
the following pathogens:
pathogens: E.
E. coli, S. aureus, methicillin–resistant S. aureus, S. epidermidis, and P. aeruginosa.
coli, S. aureus, methicillin–resistant S. aureus, S. epidermidis, and P. aeruginosa. Larvae injected with PBS with
Larvae injected
PBS served
served as as aa control and showed
control and showed100%100%survival
survival(bottom
(bottom right
right corner).
corner). TheThe bacterial
bacterial inoculum
inoculum
(CFU/larva),
(CFU/larva), for each infection group, is presented on top of each picture. The survival (%) of theof the
for each infection group, is presented on top of each picture. The survival (%)
different
different infection
infection groups
groups 24 24 h post-infectionis
h post-infection is presented
presented in inthe
thebottom
bottom right
rightpart of each
part picture.
of each picture.Microorganisms 2019, 7, x FOR PEER REVIEW 7 of 9
Microorganisms 2019, 7, x FOR PEER REVIEW 7 of 9
Microorganisms 2019, 7, 85 7 of 9
Figure 5. Example of the calculation of the concentration of the injected compound solution. In cases
where a specific in vivo concentration is required (Cin vivo), the concentration of the injected compound
Figure
solution5.(CExample of the calculation of the concentration of the injected compound solution. In cases
compound) can be calculated, for a specific volume of injection (Vcompound, typically 10 µL) and
Figure
where 5.specific
Example of the calculation ofisthe concentration ),ofthe
theconcentration
injected compound solution. In cases
for any larva volume (Vconcentration
a in vivo required (C the
larva). The Vlarva is the sum of in vivo
larva liquid volume (V ofliquid
the),injected compound
as calculated from
where a specific
solution in vivo
(Ccompound ) can concentration
be calculated, is for
required (Cin vivo
a specific ), the concentration
volume of injection (Vof the
compound
injected
, compound
typically 10 µL)
the curve presented in Figure 1 and the injection volumes (typically two injections, one for the
solution (Ccompound
and for any ) can be(V
larva volume calculated,
larva ). Thefor a specific
Vlarva volume
is the sum of theoflarva
injection
liquid(Vvolume
compound,(V typically 10 µL) and
liquid ), as calculated
infection Vinfection and one for the treatment, 10 µL each).
for any
from larva
the volume
curve presented ). The
(Vlarvain Vlarva
Figure 1 is
andthethe
sum of the larva
injection volumesliquid volume (V
(typically two ), as calculated
injections,
liquid one forfrom
the
the curveVpresented
infection and in Figure
one for 1
the and the
treatment, injection
10 µL volumes
each). (typically two injections, one for the
Another parameter
infection for consideration when it comes to treatment doses is the lifetime of each test
infection Vinfection and one for the treatment, 10 µL each).
compound in vivo. To find evidence about how long the antibiotic is active in vivo, G. mellonella
Another parameter for consideration when it comes to treatment doses is the lifetime of each test
larvae 350–390 mg were injected with 490 µg/mL ciprofloxacin solution. At different time points (10
Another
compound in parameter forevidence
vivo. To find consideration
aboutwhen it comes
how long to treatment
the antibiotic dosesinisvivo,
is active G. mellonella
the lifetime of each test
larvae
min, 1, 3, and 24 h), the haemolymph was collected from individual larvae. Haemolymph drops were
compound
350–390 mginwere vivo. To find
injected evidence
with aboutciprofloxacin
490 µg/mL how long the antibiotic
solution. is active time
At different in vivo, G. (10
points mellonella
min, 1,
plated on agar plates, and a loan of fresh E. coli culture was deposited on top. The next day, inhibition
larvae
3, and 350–390
24 h), themg were injected
haemolymph waswith 490 µg/mL
collected ciprofloxacin
from individual solution.
larvae. At different
Haemolymph timewere
drops points (10
plated
zones were evaluated, and interestingly there were no inhibition zones at 24 h post-administration
min, 1, 3,plates,
on agar and 24andh), the haemolymph
a loan wasculture
of fresh E. coli collected
was from individual
deposited larvae.
on top. TheHaemolymph drops zones
next day, inhibition were
(Figure 6). This finding might suggest that larvae-specific parameters inactivate ciprofloxacin in vivo
plated on agar plates,
were evaluated, and a loan ofthere
and interestingly freshwere
E. coli
noculture waszones
inhibition deposited
at 24 on top. The next day, inhibition
h post-administration (Figure 6).
after 24 h. Therefore, re-administration of tested compounds has to be considered for longer
zones were evaluated,
This finding and interestingly
might suggest there were
that larvae-specific no inhibition
parameters zones
inactivate at 24 h post-administration
ciprofloxacin in vivo after 24 h.
experiments.
(Figure
Therefore,6). This finding mightofsuggest
re-administration tested that larvae-specific
compounds has to beparameters
considered inactivate
for longerciprofloxacin
experiments. in vivo
after 24 h. Therefore, re-administration of tested compounds has to be considered for longer
experiments.
Figure 6. Antibiotic stability in vivo in G. mellonella larvae haemolymph. Ciprofloxacin (cip) at
Figure 6. Antibiotic stability in vivo in G. mellonella larvae haemolymph. Ciprofloxacin (cip) at 490
490 µg/mL was injected in healthy larvae and after 10 min, 1, 3, and 24 h; the haemolymph was
µg/mL was injected in healthy larvae and after 10 min, 1, 3, and 24 h; the haemolymph was collected
collected from one larva. Drops of 10 µL haemolymph were plated on agar and left to dry, after
from one larva. Drops of 10 µL haemolymph were plated on agar and left to dry, after which a loan
which a6. loan
Figure of E. coli
Antibiotic was streaked
stability onG.top.
in vivo in Inhibition
mellonella zones
larvae were observed
haemolymph. the next day.
Ciprofloxacin (cip) Larvae
at 490
of E. coli was streaked on top. Inhibition zones were observed the next day. Larvae injected with PBS
injected with PBS served as a control. Inhibition zones formed around the haemolymph
µg/mL was injected in healthy larvae and after 10 min, 1, 3, and 24 h; the haemolymph was collected spot from the
served as a control. Inhibition zones formed around the haemolymph spot from the antibiotic-injected
antibiotic-injected
from one larva. Dropslarvae at 10
of 10 µLmin, 1 and 3 h post-injection,
haemolymph were plated onbutagarwere
andnot
leftpresent
to dry,at 24 h.
after The control
which a loan
larvae at 10 min,
haemolymph from 1 and 3 h post-injection,
theon
PBS-injected larvaebut
didwere not present
not form at 24zones.
inhibition h. The control haemolymph from
of E. coli was streaked top. Inhibition zones were observed the next day. Larvae injected with PBS
the PBS-injected larvae did not form inhibition zones.
served as a control. Inhibition zones formed around the haemolymph spot from the antibiotic-injected
4. Conclusions
larvae at 10 min, 1 and 3 h post-injection, but were not present at 24 h. The control haemolymph from
4. Conclusion
G. mellonella
the larvae
PBS-injected larvaeare a reliable,
did not form cheap, andzones.
inhibition immunologically complex model for the preliminary
G. investigation
in vivo mellonella larvae
of theare a reliable,
therapeutic cheap,ofand
potential novelimmunologically complex model
antimicrobial compounds, for the
which precede
4. Conclusion
preliminary models.
mammalian in vivo However,
investigation of the therapeutic
the outcomes potential
of this model of novel
are highly antimicrobial
influenced compounds,
by the methodology
whichand
used precede
the mammalian
larva’s age; models.
therefore, an However,
attempt the outcomes
should be made of
to this model are
standardize the highly influenced
research practices by
for
G. mellonella larvae are a reliable, cheap, and immunologically complex model for the
this model. In this work, we presented a linear regression curve that correlates the larva
preliminary in vivo investigation of the therapeutic potential of novel antimicrobial compounds, total weight
with the
which liquid mammalian
precede volume. Thismodels.
curve can be used the
However, tool by G.of
as aoutcomes mellonella model
this model areresearchers in orderby
highly influenced toMicroorganisms 2019, 7, 85 8 of 9
estimate the in vivo concentration of pathogens and administered compounds and will facilitate the
comparison of results across different studies.
Supplementary Materials: The following are available online at http://www.mdpi.com/2076-2607/7/3/85/s1.
Text S1: Selection of appropriate-for-testing larvae. Figure S1: Selection of G. mellonella larvae. Figure S2: Size
variability in a larva batch.
Author Contributions: All authors conceived the study. A.A. performed the experiments and analyzed the data.
All authors interpreted the data, drafted, and approved the manuscript.
Funding: This project was supported by the Danish Council for Independent Research, Technology and
Production, grant #4005-00029.
Acknowledgments: Leif Borregaard is acknowledged for his support towards this work.
Conflicts of Interest: The authors declare no conflict of interest.
References
1. Freires, I.A.; Sardi, J.C.; de Castro, R.D.; Rosalen, P.L. Alternative animal and non-animal models for drug
discovery and development: Bonus or burden? Pharm. Res. 2017, 34, 681–686. [CrossRef] [PubMed]
2. Schmidt, O.; Theopold, U.; Beckage, N.E. Insect and vertebrate immunity: Key similarities versus differences.
In Insect Immunology; Beckage, N.E., Ed.; Elsevier: Amsterdam, The Netherlands, 2008; pp. 1–23. [CrossRef]
3. Müller, U.; Vogel, P.; Alber, G.; Schaub, G. The innate immune system of mammals and insects. Contrib. Microbiol.
2008, 15, 21–44.
4. Kavanagh, K.; Reeves, E.P. Insect and mammalian innate immune responses are much alike. Microbe 2007, 2,
596–599. [CrossRef]
5. Jander, G.; Rahme, L.G.; Ausubel, F.M. Positive correlation between virulence of Pseudomonas aeruginosa
mutants in mice and insects. J. Bacteriol. 2000, 182, 3843–3845. [CrossRef]
6. Jønsson, R.; Struve, C.; Jenssen, H.; Krogfelt, K.A. The wax moth Galleria mellonella as a novel model system
to study Enteroaggregative Escherichia coli pathogenesis. Virulence 2017, 8, 1894–1899. [CrossRef] [PubMed]
7. Tsai, C.J.Y.; Loh, J.M.S.; Proft, T. Galleria mellonella infection models for the study of bacterial diseases and for
antimicrobial drug testing. Virulence 2016, 7, 214–229. [CrossRef] [PubMed]
8. Zhou, W.; Feng, Y.; Zong, Z. Two new lytic bacteriophages of the Myoviridae family against carbapenem-resistant
Acinetobacter baumannii. Front. Microbiol. 2018, 9, 850. [CrossRef]
9. Hornsey, M.; Wareham, D.W. Effects of in vivo emergent tigecycline resistance on the pathogenic potential
of Acinetobacter baumannii. Sci. Rep. 2018, 8. [CrossRef]
10. Peleg, A.Y.; Jara, S.; Monga, D.; Eliopoulos, G.M.; Moellering, R.C., Jr.; Mylonakis, E. Galleria mellonella as a
model system to study Acinetobacter baumannii pathogenesis and therapeutics. Antimicrob. Agents Chemother.
2009, 53, 2605–2609. [CrossRef]
11. Wand, M.E.; Bock, L.J.; Turton, J.F.; Nugent, P.G.; Mark Sutton, J. Acinetobacter baumannii virulence is
enhanced in Galleria mellonella following biofilm adaptation. J. Med. Microbiol. 2012, 61, 470–477. [CrossRef]
12. Hornsey, M.; Phee, L.; Longshaw, C.; Wareham, D.W. In vivo efficacy of telavancin/colistin combination
therapy in a Galleria mellonella model of Acinetobacter baumannii infection. Int. J. Antimicrob. Agents 2013, 41,
285–287. [CrossRef]
13. Mannala, G.K.; Koettnitz, J.; Mohamed, W.; Sommer, U.; Lips, K.S.; Spröer, C.; Bunk, B.; Overmann, J.;
Hain, T.; Heiss, C.; et al. Whole-genome comparison of high and low virulent Staphylococcus aureus isolates
inducing implant-associated bone infections. Int. J. Med. Microbiol. 2018, 308, 505–513. [CrossRef]
14. Ba, X.; Harrison, E.M.; Lovering, A.L.; Gleadall, N.; Zadoks, R.; Parkhill, J.; Peacock, S.J.; Holden, M.T.G.;
Paterson, G.K.; Holmes, M.A. Old drugs to treat resistant bugs: Methicillin-resistant Staphylococcus aureus isolates
with mecC are susceptible to a combination of penicillin and clavulanic acid. Antimicrob. Agents Chemother. 2015,
59, 7396–7404. [CrossRef] [PubMed]
15. Bazaid, A.S.; Forbes, S.; Humphreys, G.J.; Ledder, R.G.; O’Cualain, R.; McBain, A.J. Fatty acid
supplementation reverses the small colony variant phenotype in triclosan-adapted Staphylococcus aureus:
Genetic, proteomic and phenotypic analyses. Sci. Rep. 2018, 8, 3876. [CrossRef]Microorganisms 2019, 7, 85 9 of 9
16. Dong, C.L.; Li, L.X.; Cui, Z.H.; Chen, S.W.; Xiong, Y.Q.; Lu, J.Q.; Liao, X.P.; Gao, Y.; Sun, J.; Liu, Y.H.
Synergistic effect of pleuromutilins with other antimicrobial agents against Staphylococcus aureus in vitro and
in an experimental Galleria mellonella model. Front. Pharmacol. 2017, 8, 553. [CrossRef] [PubMed]
17. Ebner, P.; Rinker, J.; Nguyen, M.T.; Popella, P.; Nega, M.; Luqman, A.; Schittek, B.; Di Marco, M.; Stevanovic, S.;
Götza, F. Excreted cytoplasmic proteins contribute to pathogenicity in Staphylococcus aureus. Infect. Immun.
2016, 84, 1672–1681. [CrossRef] [PubMed]
18. Ferro, T.A.F.; Araújo, J.M.M.; Pinto, B.L.S.; dos Santos, J.S.; Souza, E.B.; da Silva, B.L.R.; Colares, V.L.;
Novais, T.M.G.; Filho, C.M.B.; Struve, C.; et al. Cinnamaldehyde inhibits Staphylococcus aureus virulence
factors and protects against infection in a Galleria mellonella model. Front. Microbiol. 2016, 7, 2052. [CrossRef]
[PubMed]
19. Jacobs, A.C.; DiDone, L.; Jobson, J.; Sofia, M.K.; Krysan, D.; Dunman, P.M. Adenylate kinase release as a
high-throughput-screening-compatible reporter of bacterial lysis for identification of antibacterial agents.
Antimicrob. Agents Chemother. 2013, 57, 26–36. [CrossRef]
20. Jorjão, A.L.; Oliveira, L.D.; Scorzoni, L.; Figueiredo-Godoi, L.M.A.; Prata, M.C.A.; Jorge, A.O.C.;
Junqueira, J.C. From moths to caterpillars: Ideal conditions for Galleria mellonella rearing for in vivo
microbiological studies. Virulence 2018, 9, 383–389. [CrossRef]
21. Saporito, P.; Mouritzen, M.V.; Lobner-Olesen, A.; Jenssen, H. LL-37 fragments have antimicrobial activity
against Staphylococcus epidermidis biofilms and wound healing potential in HaCaT cell line. J. Pept. Sci. 2018,
24, e3080. [CrossRef]
22. Gaglione, R.; Dell’Olmo, E.; Bosso, A.; Chino, M.; Pane, K.; Ascione, F.; Itri, F.; Caserta, S.; Amoresano, A.;
Lombardi, A.; et al. Novel human bioactive peptides identified in Apolipoprotein B: Evaluation of their
therapeutic potential. Biochem. Pharmacol. 2017, 130, 34–50. [CrossRef] [PubMed]
© 2019 by the authors. Licensee MDPI, Basel, Switzerland. This article is an open access
article distributed under the terms and conditions of the Creative Commons Attribution
(CC BY) license (http://creativecommons.org/licenses/by/4.0/).You can also read