Numerical Modelling of CFS Three-Story Strap-Braced Building under Shaking-Table Excitations - MDPI
←
→
Page content transcription
If your browser does not render page correctly, please read the page content below
materials
Article
Numerical Modelling of CFS Three-Story Strap-Braced Building
under Shaking-Table Excitations
Alessia Campiche

                                           Department of Structures for Engineering and Architecture, University of Naples “Federico II”, Via Forno Vecchio 36,
                                           80134 Naples, Italy; alessia.campiche@unina.it; Tel.: +39-081-2538982

                                           Abstract: In recent research activities, shake-table tests were revealed to be useful to investigate
                                           the seismic behavior of cold-formed steel (CFS) buildings. However, testing full-scale buildings
                                           or reduced-scale prototypes is not always possible; indeed, predicting tools and numerical models
                                           could help designers to evaluate earthquake response. For this reason, numerical modelling of two
                                           strap-braced prototype buildings, recently tested on shake-table at University of Naples Federico
                                           II in cooperation with Lamieredil S.p.A. company, was developed. The models were validated
                                           trough the comparison between experimental and numerical results, in term of dynamic properties
                                           (fundamental period of vibration and modal shapes), peak roof drift ratios and peak inter-story drift
                                           ratios. Although dynamic properties of mock-ups were captured with accuracy by the developed
                                           models, the comparison highlighted the need to consider accumulation of damage and rocking
                                           phenomenon in the modelling to capture with good accuracy the seismic behavior of CFS strap-
                                           braced building, subjected to high intensity records.

                                           Keywords: CFS structures; seismic design; strap-braced buildings; shake-table tests; numerical
                                           modelling; dynamic behavior


                                           1. Introduction
Citation: Campiche, A. Numerical
                                                Seismic behavior of structures has been a key topic in the last decades and still
Modelling of CFS Three-Story
                                           under investigation. The University of Naples “Federico II” carried out research devoted
Strap-Braced Building under
Shaking-Table Excitations. Materials
                                           to the evaluation of dynamic properties and seismic response of both traditional steel
2021, 14, 118. https://doi.org/
                                           structures [1–21] and lightweight steel systems [22–26]. In this framework, an important
10.3390/ma14010118                         research project funded by Lamieredil S.p.A. company, recently finished, which the main
                                           goal was the investigation of seismic behavior of lightweight steel (LWS) constructions and
Received: 12 October 2020                  in particular cold-formed steel (CFS) strap-braced wall buildings. The structural part of
Accepted: 18 December 2020                 these systems consists of CFS members’ frame braced by thin steel straps in X configuration,
Published: 29 December 2020                which the main task is the resistance to lateral loads. Although high performances and
                                           advantages of LWS constructions are now worldwide recognized, high-fidelity modelling
Publisher’s Note: MDPI stays neu-          tools easy-to-use for engineers have not been amply studied and widespread. Commonly,
tral with regard to jurisdictional clai-   in the state of the art only the main lateral force resisting system (LFRS), i.e., strap-braced
ms in published maps and institutio-       wall, is considered and two modelling approaches are employed: (i) A simplified approach
nal affiliations.                          in which the nonlinear behavior of steel straps is represented by a spring or a truss
                                           element [27–30]; (ii) detailed FE model using shell or frame elements [31–34] concerning
                                           different geometrical and material details. In the literature, few cases of CFS strap-braced
Copyright: © 2020 by the author. Li-
                                           wall buildings have been modelled [35–37], but there is no case in which experimentally
censee MDPI, Basel, Switzerland.
                                           tested buildings have been modelled and numerical results have been compared with
This article is an open access article
                                           experimental results.
distributed under the terms and con-            To overcome this lack, starting from the experimental results, a specific task of the
ditions of the Creative Commons At-        above-mentioned project was devoted to the development of 3D numerical models with
tribution (CC BY) license (https://        OpenSees [38] software. In particular, monotonic and cyclic tests on full scale strap-braced
creativecommons.org/licenses/by/           walls and shake table tests on two reduced-scale (1:3) three-storiy CFS mock-ups, carried
4.0/).                                     out at the lab of the Department for Structures and Engineering, were considered and

Materials 2021, 14, 118. https://doi.org/10.3390/ma14010118                                                     https://www.mdpi.com/journal/materials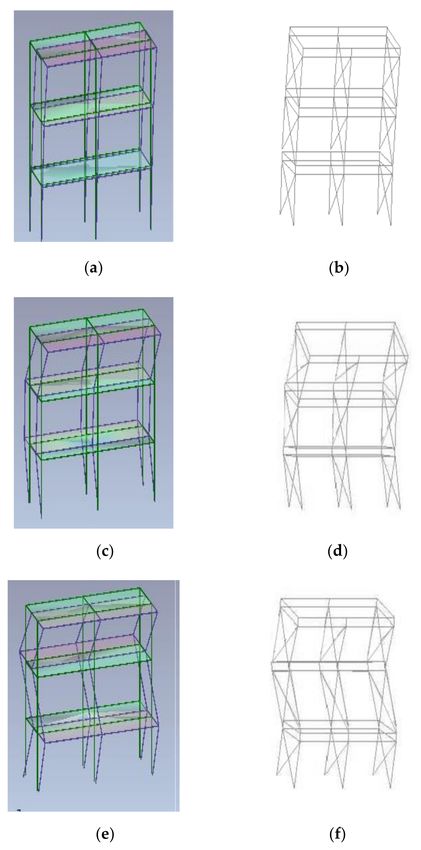
Materials 2021, 14, 118                                                                                          2 of 12

                          used for the calibration and the validation of modelling choices. Firstly, the calibration of
                          numerical models of CFS strap-braced stud walls was done on the base of the available
                          results of quasi-static cyclic tests on single walls [39], then numerical models of whole
                          mock-ups were developed in order to simulate the non-linear dynamic response.
                               After a brief introduction of mock-up geometries and shake-table tests, the paper
                          provides the description of numerical modelling of the two tested mock-ups and the
                          validation through the comparison with experimental results.

                          2. Mock-Up Description
                               The two tested mock-ups were reduced scale three-story and two bay CFS buildings
                          (Figure 1) with a rectangular plan of 0.95 m × 2.95 m and a total height of about 3.10 m.
                          The mock-ups were representative of two residential buildings designed and selected as
                          case studies and they were scaled considering a scaling factor equal to 1:3. To scale the
                          mock-ups, three independent scaling factors were fixed, length (SL = 1/3), stress (Sσ = 1)
                          and acceleration (SA = 1), while scaling factors of other parameters (dependent parameters)
                          are defined according to the similitude laws [40]. More details about case study design and
                          scaling procedure are available in Fiorino et al. [41].

                          Figure 1. Reduced scale tested mock-ups [42].

                                Both mock-ups were designed for gravity and seismic loads as “all-steel” solutions,
                          neglecting the contribution of panels to the resistance, and they were mainly composed
                          of strap-braced stud walls, as lateral force resisting systems (LFRSs), and floors. The only
                          difference between the two mock-ups consisted of floor typology: (i) The first building,
                          named Type 1 mock-up, had composite steel-concrete floors; (ii) the second building,
                          named Type 2 mock-up, had wood-based panel floors. Strap-braced stud walls, having
                          dimension 0.80 m × 0.90 m (length × height), were placed only in the short direction and
                          were built with C studs, U tracks, and X diagonal flat straps with different dimensions for
                          each story. For all the components as screws were used 2.2 mm × 9.5 mm self-piercing
                          screws. All the elements used in the mock-ups are summarized in Table 1.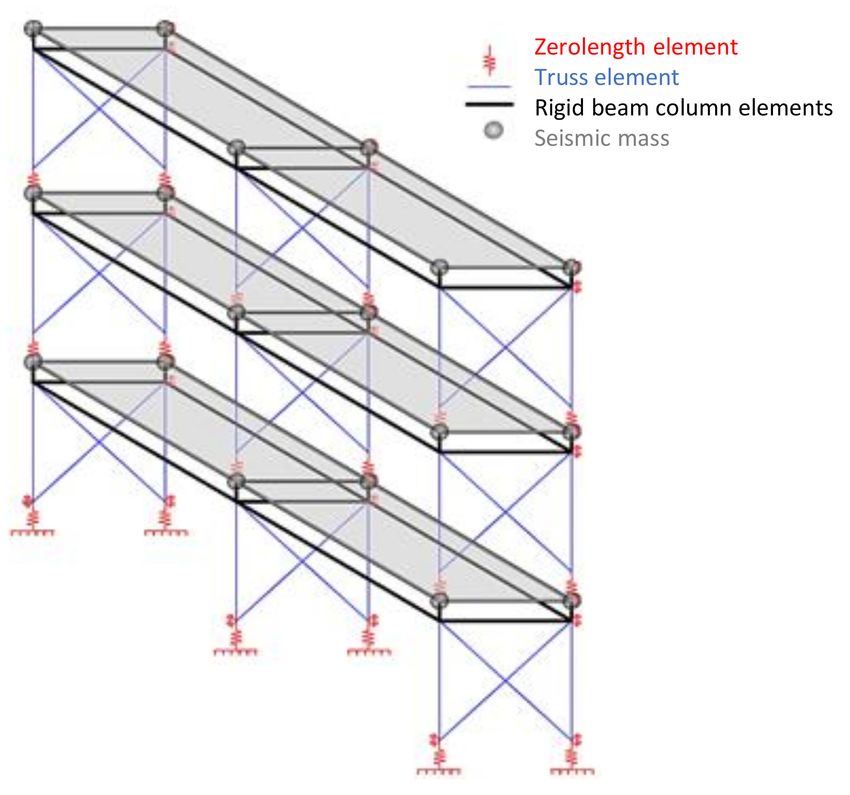
Materials 2021, 14, 118                                                                                                3 of 12

                                              Table 1. Structural element properties (lengths in mm).

                                Component                       Element                            Properties
                                                                  Stud                        C50 × 20 × 10 × 0.7
                                                                 Track                         U51.4 × 20 × 0.7
                                                             Diagonal strap                         80 × 0.7
                                                             Gusset plates                      130 × 130 × 0.7
                                      1st story           Track reinforcement                 C50 × 20 × 10 × 0.7
                                                                                              C50 × 20 × 10 × 0.7
                                                                Blocking
                                                                                               U51.4 × 20 × 0.7
                                                               Flat strap                           20 × 0.7
                                                   Hold-down to chord stud fasteners        no. 4 M6 bolts Class 8.8
                                                   Hold-down to steel beam fasteners          no. 1 M8 Class 10.9
                                                                  Stud                        C50 × 20 × 10 × 0.7
                                                                 Track                         U51.4 × 20 × 0.7
                                                             Diagonal strap                         53 × 0.7
                                                             Gusset plates                      117 × 117 × 0.7
                            Wall      2nd story           Track reinforcement                 C50 × 20 × 10 × 0.7
                                                                                              C50 × 20 × 10 × 0.7
                                                                Blocking
                                                                                               U51.4 × 20 × 0.7
                                                               Flat strap                           20 × 0.7
                                                   Hold-down to chord stud fasteners        no. 4 M6 bolts Class 8.8
                                                         Wall to wall fasteners               no. 1 M8 Class 10.9
                                                                  Stud                        C50 × 20 × 10 × 0.5
                                                                 Track                          U51 × 20 × 0.5
                                                             Diagonal strap                         55 × 0.5
                                                             Gusset plates                      100 × 100 × 0.5

                                      3rd story           Track reinforcement                 C50 × 20 × 10 × 0.5
                                                                                              C50 × 20 × 10 × 0.5
                                                                Blocking
                                                                                                U51 × 20 × 0.5
                                                               Flat strap                           20 × 0.5
                                                   Hold-down to chord stud fasteners        No. 4 M5 bolts Class 8.8
                                                         Wall to wall fasteners               no. 1 M8 Class 10.9
                                                                  Joist                       C85 × 20 × 10 × 0.7
                                      composite
                                                      Corrugated sheet (thickness)                      0.04
                            Floor
                                                                  Joist                       C85 × 20 × 10 × 0.7
                                     wood-based
                                                               OSB panel                         760 × 400 × 9

                          3. Shake-Table Tests
                               Dynamic and seismic response of the mock-ups were evaluated through a series of
                          shake-table tests carried out at the lab of the Department of Structures for Engineering and
                          Architecture of University of Naples “Federico II”.
                               White noise signals were used for the evaluation of dynamic properties (random test)
                          of mock-ups in shorter direction, i.e., fundamental period of vibration and damping ratio.
                          To analyze experimental data obtained, experimental modal analysis technique was used,
                          thanks to ARTeMIS Modal software [43].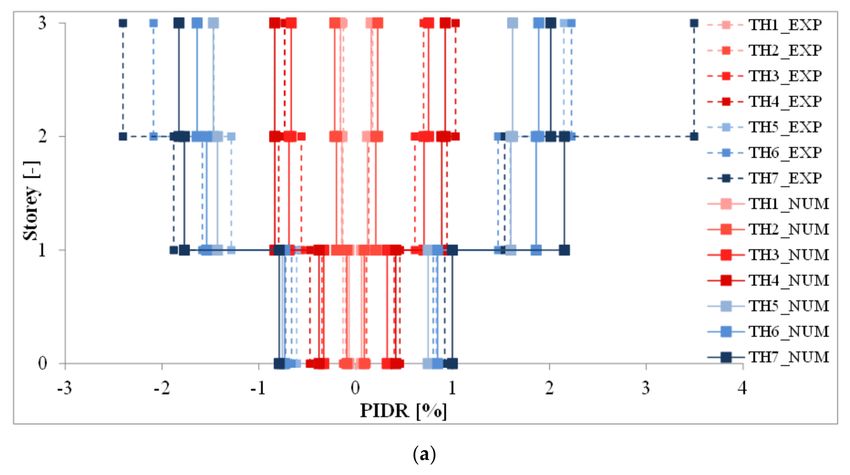
Materials 2021, 14, 118                                                                                                4 of 12

                               The natural ground motion record east–west acceleration component recorded by the
                          Norcia (NRC) Station with a PGA of 4.76 m/s2 (0.49 g) opportunely scaled was used to
                          evaluate the seismic response (earthquake test). Different earthquake record scaling factors
                          were used to reproduce various ground motion hazard levels.
                               To track the spreading of damage through the variation in dynamic properties, earth-
                          quake tests were always preceded and followed by random tests. Table 2 shows the scaling
                          factors used for earthquake records for both mock-ups.

                          Table 2. Scaling factors for earthquake records for both mock-ups.

                             Mock-Up                     Test Label                      Time History Scaling Factor
                               Type 1       TH1, TH2, TH3, TH4, TH5, TH6, TH7       9%, 12%, 38%, 49%, 100%, 120%, 150%
                               Type 2       TH1, TH2, TH3, TH4, TH5, TH6, TH7       11%, 16%, 48%, 62%, 100%, 120%, 150%

                               Further details about shake-table tests are available in Fiorino et al. [41].

                          4. Numerical Modelling
                                To simulate the response of shake-table tests and provide a useful tool for next ap-
                          plications, three-dimensional finite element models of mock-ups were developed, using
                          OpenSees software [38].
                                First of all, the LFRS modelling plays a key role to capture with accuracy the behavior
                          of whole buildings. In the specific case, following the same approach adopted in [29], a pair
                          of diagonal truss elements were used to model the LFRSs of the mock-ups, i.e., strap-braced
                          stud walls, in which Pinching4 material, calibrated on the basis of cyclic test data [39], was
                          used to simulate their hysteretic response. In particular, test data were used to calibrate
                          the backbone envelope curves and the 23 parameters governing the cyclic behavior in
                          Pinching4 material rule.
                                The first point (1) of the backbone envelope curves was located at 50% of the experi-
                          mental yielding strength; the second point (2) corresponded to the elastic limit observed in
                          experiments; the third point (3) represented the experimental peak strength; the fourth point
                          (4) of numerical backbone curve corresponded to the maximum experimental displacement
                          and the corresponding force, selected with an energy balance. In this way, the area under the
                          numerical backbone curve between points (3) and (4) was equal to the corresponding area
                          of the experimental envelope curve. The comparison between experimental and numerical
                          envelope curves for the wall located at third floor is shown in Figure 2.

                          Figure 2. Comparison between experimental and numerical envelope curves for the wall located at
                          third floor.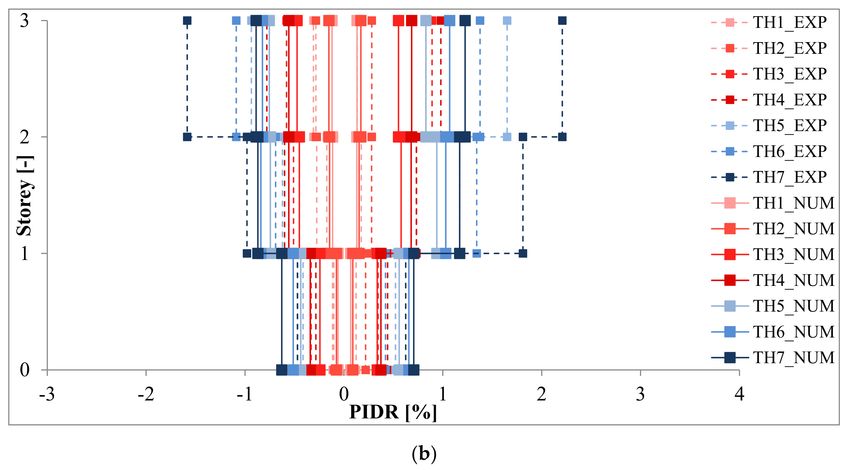
80
                                                                          Numerical backbone
                    60
   Materials 2021, 14, 118                                                                                                            5 of 12
                    40         1

                    20                       To define Pinching4 material many parameters need to control cyclic behavior. The
                                       parameter rDisp, governing ratio between the displacement of the reloading point and
                                       maximum positive displacement of preceding cycles,Drift     was angle   [%]to 0.01, 0.05 and 0.1
                                                                                                        set equal
                     0                 for walls at first, second and third story, respectively. The parameter rForce was set equal
                         0.0               0.5 for all the walls.
                                       to 0.01               1.0 Rest of the parameters
                                                                              1.5               2.0 were set equal
                                                                                          required                2.5to 0. Wall models
                                       were validated by comparing the experimental [39] and numerical responses in term of
                                       force-displacement
                                   Figure                     response
                                           2. Comparison between        (Figure 3a)
                                                                   experimental  andand cumulative
                                                                                     numerical       energy
                                                                                               envelope curves(Figure   3b). located
                                                                                                                for the wall Since cyclic
                                       testsfloor.
                                   at third   were carried out for all the wall configurations, each wall model was compared with
                                       the corresponding test. The comparison is shown in Figure 2 for the wall at third story.

                                                          (a)                                              (b)

                                   Figure  3. Modelling
                                       Figure            options
                                               3. Modelling      and and
                                                             options parameters  usedused
                                                                         parameters    [42].[42].
                                                                                             (a)Force‐Displacement  response
                                                                                                  (a) Force-Displacement     of wall
                                                                                                                         response of at
                                                                                                                                     wall at
                                   third floor; (b) Cumulative  energy dissipation of wall at third  floor.
                                       third floor; (b) Cumulative energy dissipation of wall at third floor.

                                             Since the hold-down offers different stiffness in tension and compression, the approach
                                        suggested by Leng et al. [44] was employed; indeed, hold-downs were modelled with two
                                        parallel Zerolength elements (Figure 4), in which the first element used uniaxial elastic
                                        material representing the stiffness of hold-down
Materials 2020, 13, x; doi: FOR PEER REVIEW                                               connection only, while the second element
                                                                                   www.mdpi.com/journal/materials
                                        used elastic-perfectly plastic gap material with a zero-gap, representing the stiffness in
                                        compression offered by foundation or floor. Uniaxial elastic material in case of the Type
                                        1 mock-up had a stiffness of 20, 10, and 7.5 kN/mm for the walls at first, second and
                                        third story, respectively, whereas in case of Type 2 mock-up it had a stiffness of 20, 20,
                                        and 15 kN/mm for the walls at first, second and third story, respectively. Elastic-perfectly
                                        plastic gap material had stiffness of 20 kN/mm for foundation, whereas for floors a very
                                        low value was used. The yield strength used for Elastic-perfectly plastic gap material was
                                        also calibrated experimentally [39].

                                      Figure 4. A two-node parallel spring element used for hold-downs [42].

                                          Infinite rigid truss elements were used to model the tracks, whereas truss elements
                                      with the uniaxialMaterial Elastic having the same properties of the profiles used in the
                                      mock-ups was employed for the chord studs. Buckling mechanisms and tensile rupture
                                      were explicitly considered in modelling.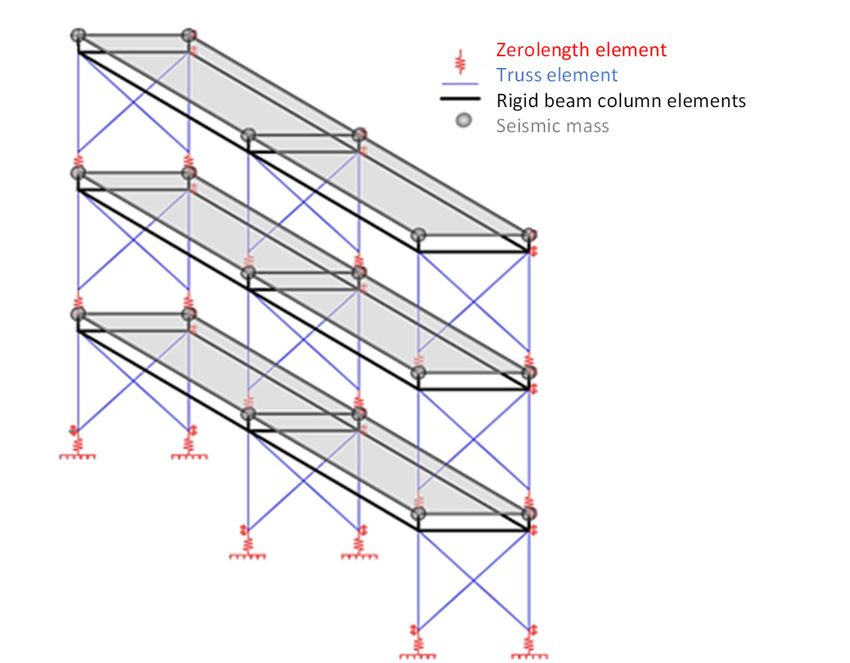
Materials 2021, 14, 118                                                                                                      6 of 12

Materials 2020, 13, x FOR PEER REVIEW   According to the prescriptions provided in ASCE 7 [45], during the tests,6 floors   of 12
                                  behaved rigidly in their plane; indeed, the diaphragm model employed infinite rigid
                                  vertical and horizontal beam column elements. Moreover, since the motion of shake table
                                  was unidirectional, the motion in the other degree of freedom was restrained in the model.
                                        Seismic mass of the buildings was concentrated at the top end nodes of walls at each
                                  floor. Damping was simulated by utilizing the Rayleigh damping. With regard to damping
                                  ratio, the experimental tests showed that it ranged from 2.4% (before Earthquake tests) to
                                  13% for Type 1 mock-up, with an increasing of 5.4 times, and from 3.7% to 5.6% for the
                                  Type 2 mock-up, with an increasing of 1.5 times (Figure 5). For each model, a sensitivity
                                  analysis was carried out to select the best match for damping, which was selected equal
                                  to 5%. Figure 5 shows the experimental damping ratios measured during the random
                                  tests and the value of 5% chosen for the models; it is clear that 5% value matches the
                                  average experimental value obtained. The models were subjected to modal analysis and
                                 Figure  4. A two-node
                                  time history         parallel
                                                 analysis with spring element
                                                                the inputs    used forat
                                                                           measured    hold-downs
                                                                                         the base of[42].
                                                                                                      shake-table during the tests.
                                  Figure 6 shows a schematic drawing of the models developed.

                                                        (a)                                             (b)
                                 Figure
                                  Figure5.5.Experimental
                                             Experimentaldamping
                                                          damping range
                                                                  range for (a) Type
                                                                        for (a) Type11and
                                                                                       and(b)
                                                                                           (b)Type
                                                                                               Type2 2mock-ups
                                                                                                       mock-ups  and
                                                                                                               and   Rayleigh
                                                                                                                   Rayleigh damping
                                 damping value selected for the model.
                                  value selected for the model.

                                 Figure 6. Schematic drawing of models developed.
                                  Figure 6. Schematic drawing of models developed.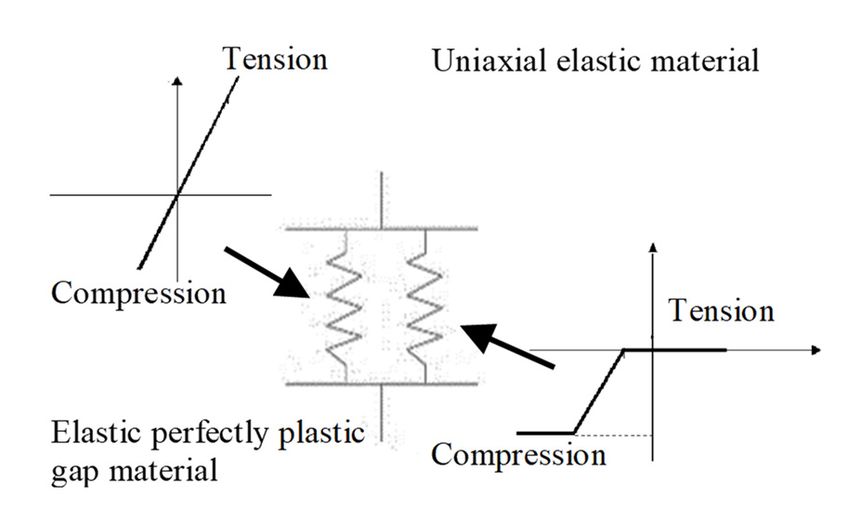
Materials 2021, 14, 118 7 of 12
5. Experimental vs. Numerical Results
In order to validate the models, a comparison among experimental and numerical
results was conducted. In particular, dynamic identification results were compared in
term of fundamental period of vibration and modal shapes, whereas the earthquake test
results were compared in term of peak roof drift ratio (PRDR) and peak inter-story drift
ratio (PIDR).
PRDR was defined as the ratio between the maximum top displacement and the height
of the structure, whereas PIDR was defined as the ratio between the relative translational
displacement difference between two consecutive floors and the story height.
The interpretation of experimental dynamic identification was performed through
experimental modal analysis with ARTeMIS Modal software [43], whereas numerical
dynamic identification consisted of modal analysis of models. The experimental results
showed that the first period of vibration before Earthquake tests was 0.43 s and 0.50 s for
the Type 1 and Type 2 mock-ups, respectively, whereas the numerical fundamental periods
were 0.40 s and 0.50 s for Type 1 and Type 2 mock-ups, respectively (experimental-to-
numerical ratio of 1.08 and 1.00 for Type 1 and Type 2 mock-ups, respectively). The periods
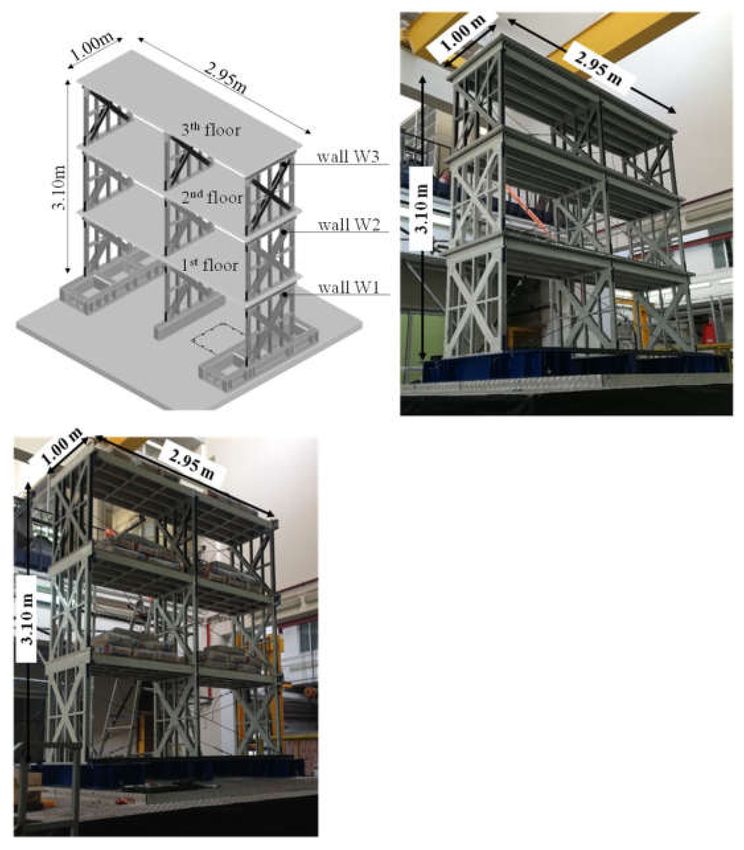
of vibration corresponding to the second and third mode were also evaluated and compared.
Comparison between experimental and numerical values are summarized in Table 3. The
vibration modes obtained are shown in Figure 7. As a result, numerical models give a good
prediction of dynamic properties of mock-ups for the first period of vibration, whereas
they underestimate the second and third periods of vibration (experimental-to-numerical
ratio in the range 1.25 to 1.43). This result could be mainly attributed to the presence of
rocking phenomenon, which increases the actual deformability of the structures and the
second and third modes of vibration are more sensitive than the first, since they have more
inversions (Figure 7). Although rocking was experimentally observed in the shake-table
tests, it was not well measured because ad-hoc instrumentation was not installed, since it
has never happened before in previous experimental tests on strap-braced walls [23,29,39]
or whole building [35].
Table 3. Comparison in term of fundamental periods of vibration.
Type 1 Mock-Up Type 2 Mock-Up
Exp Num Exp/Num Exp Num Exp/Num
T1 [s] 0.43 0.40 1.08 0.50 0.50 1.00
T2 [s] 0.15 0.12 1.25 0.18 0.13 1.38
T3 [s] 0.10 0.07 1.43 0.11 0.08 1.38
Non-linear time history analyses were performed to evaluate the numerical seismic
response of mock-ups, that was compared with the experimental results to proof the
goodness of models. As happened in the shake-table tests, the earthquakes were applied in
sequence to the numerical models with increasing scale factors. In this way experimental
and numerical results are more comparable. Numerical models also included the signal
distortion, differences between signal really reproduced and signal imposed to shake-table.
As concern the seismic response, PIDRs were reached for the input with maximum intensity
(scaling factor of 150%) at the 3rd story: 3.49% for Type 1 mock-up and 2.21% for type 2
mock-up, whereas the PIDRs were 1.78% at 2nd level for Type 1 mock-up and 1.33% for
Type 2 mock-up at 3rd level. A comparison between experimental and numerical results in
terms of PIDR is given in Table 4. Figure 8 shows minimum and maximum inter-story drift
ratios (IDRs) along the height of both mock-ups. The experimental to numerical ratio is
in the range 0.80 to 2.08 for Type 1 mock-up and 0.65 to 2.06 for Type 2 mock-up. Models
can capture PIDR for low inputs (until scaling factor of 100%), whereas they do not show
good predictions for higher inputs (scaling factors of 120% and 150%). The reason behind
the inaccurate response at high intensity earthquakes could be due to the high rocking
phenomenon, which represents an adding source of deformability of the system and it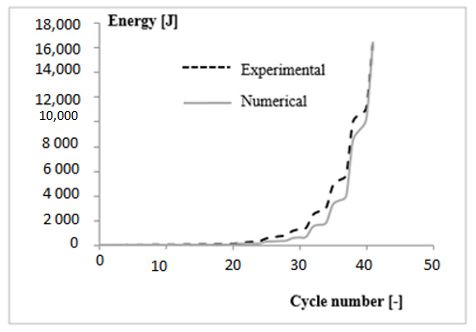
Materials 2021, 14, 118                                                                                              8 of 12

                          increases with the earthquake intensity. Unlikely, this phenomenon could not be properly
                          captured by numerical models, because it was not properly measured in the tests and has
                          never been happened in the previous research.

                          Figure 7. Comparison of experimental (Artemis) and numerical (OpenSees) modal shapes [42].
                          (a) First experimental modal shape; (b) First numerical modal shape; (c) Second experimental modal
                          shape; (d) Second numerical modal shape; (e) Third experimental modal shape; (f) Third numerical
                          modal shape.
Materials 2021, 14, 118 9 of 12
Table 4. Comparison in term of fundamental periods of vibration.
Peak Inter-Story Drift [%]
Test 1st Level 2nd Level 3rd Level
Label Type 1 Type 2 Type 1 Type 2 Type 1 Type 2
EXP NUM EXP NUM EXP NUM EXP NUM EXP NUM EXP NUM
TH1 0.10 0.07 0.12 0.07 0.13 0.14 0.17 0.13 0.18 0.16 0.31 0.13
TH2 0.13 0.09 0.22 0.09 0.15 0.21 0.28 0.15 0.16 0.23 0.28 0.17
TH3 0.40 0.33 0.35 0.34 0.61 0.71 0.73 0.58 0.75 0.73 0.89 0.55
TH4 0.47 0.41 0.44 0.37 0.94 0.89 0.73 0.68 1.03 0.92 0.98 0.68
TH5 0.83 0.76 0.52 0.56 1.59 1.60 1.17 0.94 2.15 1.62 1.65 0.83
TH6 0.80 0.84 0.47 0.66 1.58 1.86 1.34 1.03 2.23 1.89 1.38 1.07
TH7 0.92 1.00 0.62 0.71 1.88 2.15 1.81 1.17 3.49 2.01 2.21 1.23
Figure 8. Comparison between experimental and numerical peak inter-story drift ratio (PIDR) [42]. (a) Type 1, (b) Type 2.Storey [-
TH7_EXP
TH1_NUM
TH2_NUM
1 TH3_NUM
Materials 2021, 14, 118 TH4_NUM 10 of 12
TH5_NUM
TH6_NUM
TH7_NUM
0 Moreover, a comparison between experimental and numerical results in terms of
-3 -2 -1PRDR 0 is shown 1 in Figure2 9. The experimental
3 4to numerical ratio is in the range 0.99
PIDR
to 1.27 [%] 1 mock-up and 0.92 to 1.41 for Type 2 mock-up. It can be noticed that
for Type
globally models are able to capture experimental behavior in term of roof drift ratio (RDR),
(b) Type 2
but the PRDRs are not captured very accurately. The inaccuracy of the prediction could
Figure 8. Comparison between experimental
be attributed to the fact and
thatnumerical peak predict
models well inter-story
thedrift
firstratio (PIDR)
mode, but with less accuracy
[42]. the others.
Numerical PRDR 1.47 Numerical PRDR
1.41 1.39
1.30 1.45
Experimental PRDR 1.30 Experimental PRDR 1.16
0.94 1.02
PRDR [%]
1.11
0.93
PRDR [%]
0.79 0.64 0.90
0.60
0.54 0.62 0.59
0.52
0.50
0.24
0.12 0.15 0.16 0.17
0.11 0.12 0.13
11 16 48 62 100 120 150 9 12 38 49 100 120 150
Scaling factor [%] Scaling factor [%]
(a) (b)
Figure 9. Comparison between experimental and numerical peak roof drift ratio (PRDR). (a) Type
Figure 9. Comparison between experimental and numerical peak roof drift ratio (PRDR). (a) Type 1 mock-up; (b) Type 2
1 mock-up; (b) Type 2 mock-up.
mock-up.
6. Conclusions
6. Conclusions
The paper describes the numerical modelling developed to reproduce the dynamic
and seismic behaviorThe of two
paper CFS strap-braced
describes building,modelling
the numerical tested at developed
University to of reproduce
Naples the dynamic
“Federico II”, asand
a part of a research
seismic behaviorproject
of twoinCFScooperation
strap-braced withbuilding,
Lamieredil S.p.A.
tested com-
at University of Naples
pany. In particular, two three-story
“Federico mock-ups
II”, as a part in reduced
of a research projectscale (1:3), which
in cooperation withdiffered only S.p.A. company.
Lamieredil
for the type of floors (composite
In particular, twosteel-concrete and wood-based
three-story mock-ups in reduced panels), werewhich
scale (1:3), testeddiffered
on only for the
shake-table. Thetype
two ofmock-ups were designed and opportunely scaled to be compatible
floors (composite steel-concrete and wood-based panels), were tested on shake-
with the available shake-table.
table. The two Two types were
mock-ups of signals wereand
designed used for the dynamic
opportunely scaledidentifica-
to be compatible with the
tion and the seismic response
available evaluation:
shake-table. TwoWhite
typesnoise signalwere
of signals and used
earthquake
for the records,
dynamicre- identification and
spectively. the seismic response evaluation: White noise signal and earthquake records, respectively.
Three-dimensional numerical models
Three-dimensional for bothmodels
numerical mock-ups were
for both developed
mock-ups werein developed
Open- in OpenSees
Sees software to software
reproduce to the experimental
reproduce response. The
the experimental models
response. Thewere calibrated
models on the on the base of
were calibrated
base of availableavailable
experimental data and
experimental validated
data throughthrough
and validated the comparison
the comparisonbetween ex- experimental
between
and numerical
perimental and numerical results
results obtained.
obtained. In particular,
In particular, the comparison
the comparison between
between exper-experimental and
numerical
imental and numerical dynamic
dynamic properties
properties waswas
donedone in term
in term of fundamental
of fundamental periods
periods and modal shapes,
and
whereas the
modal shapes, whereas the seismic behavior
behaviorwas wascompared
comparedininterm termof of
peakpeakinter-story
inter-storydrift and peak roof
drift.
drift and peak roof Developed
drift. Developed models captured
models capturedwith enough
with enoughaccuracy
accuracyfundamental
fundamental period of vibration
(experimental-to-numerical
period of vibration (experimental-to-numerical ratio equal
ratio to to
equal 1.08 and
1.08 and1.00 forfor
1.00 Type
Type 1 and
1 andType 2 mock-ups,
respectively) and modal shapes of mock-ups. Experimental and numerical peak inter-story
drift ratios and roof drift ratios were compared, exhibiting experimental to numerical ratios
in the range 0.80 to 2.08 and 0.80 to 1.27 for Type 1 mock-up and 0.65 to 2.06 and 0.91 to
1.41 for Type 2 mock-up. Models were able to capture peak inter-story drift ratios for low
2020, 13, x; doi: FOR PEER REVIEW inputs, whereas they did not show good predictions for higher inputs. The reason behind
www.mdpi.com/journal/materials
the inaccurate response at high intensity earthquakes could be found in the adding source
of deformability due to the rocking phenomenon observed experimentally. Unfortunately,
since this phenomenon never happened in previous experimental campaigns, no ad-hoc
instrumentation was installed for the monitoring and this makes very difficult the rocking
modelling, which would be the focus of future studies.
Funding: This research received no external funding.
Institutional Review Board Statement: Not applicable.
Informed Consent Statement: Not applicable.Materials 2021, 14, 118 11 of 12
Data Availability Statement: Data sharing is not applicable to this article.
Acknowledgments: The study presented in this paper is part of wider research program coordinated
by Raffaele Landolfo with technical support of Lamieredil S.p.A. Landolfo and Lamieredil S.p.A. are
gratefully acknowledged by the Author for the consent to publish scientific results presented in this
paper and in agreement with their common research scope.
Conflicts of Interest: The author declares no conflict of interest.
References
1. Tartaglia, R.; D’Aniello, M.; De Martino, A. Ultimate performance of external end-plate bolted joints under column loss scenario
accounting for the influence of the transverse beam. Open Constr. Build. Technol. J. 2017, 12, 132–139. [CrossRef]
2. Tartaglia, R.; D’Aniello, M.; Zimbru, M. Experimental and numerical study on the T-Stub behaviour with preloaded bolts under
large deformations. Structures 2020, 27, 2137–2155. [CrossRef]
3. D’Aniello, M.; Tartaglia, R.; Cassiano, D. Experimental investigation of the inelastic tensile behaviour of non-preloadable grade
8.8 bolts. Ingegneria Sismica Int. J. Earth Eng. 2020, 2, 92–110.
4. Tartaglia, R.; D’Aniello, M. Influence of transvserse beams on the ultimate behaviour of seismic resistant partial strength
beam-to-column joints. Ingegneria Sismica Int. J. Earth Eng. 2020, 3, 50–66.
5. Tartaglia, R.; D’Aniello, M.; Rassati, G.A.; Swanson, J.; Landolfo, R. Influence of composite slab on the nonlinear response of
extended end-plate beam-to-column joints. Key Eng. Mater. 2017, 763, 818–825. [CrossRef]
6. Tartaglia, R.; D’Aniello, M.; Landolfo, R. Numerical simulations to predict the seismic performance of a 2-story steel moment-
resisting frame. Materials 2020, 13, 4831. [CrossRef]
7. Tartaglia, R.; D’Aniello, M.; Andreini, M.; La Mendola, S. The performance of preloaded bolts in seismically prequalified steel
joints in a fire scenario. Materials 2020, 13, 5079. [CrossRef]
8. Cassiano, D.; D’Aniello, M.; Rebelo, C. Parametric finite element analyses on flush end-plate joints under column removal.
J. Constr. Steel Res. 2017, 137, 77–92. [CrossRef]
9. Costanzo, S.; D’Aniello, M.; Landolfo, R. Seismic design criteria for chevron CBFs: European vs North American codes (part-1).
J. Constr. Steel Res. 2017, 135, 83–96. [CrossRef]
10. Cassiano, D.; D’Aniello, M.; Rebelo, C. Seismic behaviour of gravity load designed flush end-plate joints. Steel Compos. Struct.
2018, 26, 621–634. [CrossRef]
11. Costanzo, S.; Tartaglia, R.; Di Lorenzo, G.; De Martino, A. Seismic Behaviour of EC8-Compliant Moment Resisting and Concentri-
cally Braced Frame. Buildings 2019, 9, 196. [CrossRef]
12. D’Aniello, M.; Tartaglia, R.; Costanzo, S.; Campanella, G.; Landolfo, R.; De Martino, A. Experimental tests on extended stiffened
end-plate joints within equal joints project. Key Eng. Mater. 2018, 763, 406–413. [CrossRef]
13. Costanzo, S.; D’Aniello, M.; Landolfo, R. Proposal of design rules for ductile X-CBFS in the framework of EUROCODE 8.
Earthq. Eng. Struct. Dyn. 2019, 48, 124–151. [CrossRef]
14. Costanzo, S.; D’Aniello, M.; Landolfo, R. Critical review of seismic design criteria for chevron concentrically braced frames: The
role of the brace-intercepted beam. Ing. Sismica Int. J. Earth Eng. 2016, 33, 72–89.
15. Costanzo, S.; D’Aniello, M.; Landolfo, R. Seismic design rules for ductile Eurocode compliant two storey X concentrically braced
frames. Steel Compos. Struct. 2020, 36, 273–291.
16. Latour, M.; Rizzano, G. Cyclic behavior and modeling of a dissipative connector for cross-laminated timber panel buildings.
J. Earthq. Eng. 2015, 19, 137–171. [CrossRef]
17. Latour, M.; Rizzano, G. Design of X-shaped double split tee joints accounting for moment-shear interaction. J. Constr. Steel Res.
2015, 104, 115–126. [CrossRef]
18. Francavilla, A.B.; Latour, M.; Piluso, V.; Rizzano, G. Design of full-strength full-ductility extended end-plate beam-to-column
joints. J. Constr. Steel Res. 2018, 148, 77–96. [CrossRef]
19. Cavallaro, G.F.; Francavilla, A.B.; Latour, M.; Piluso, V.; Rizzano, G. Cyclic response of low yielding connections using different
friction materials. Soil Dyn. Earthq. Eng. 2018, 114, 404–423. [CrossRef]
20. Lemos, A.; da Silva, L.S.; Latour, M.; Rizzano, G. Numerical modelling of innovative DST steel joint under cyclic loading.
Arch. Civ. Mech. Eng. 2018, 18, 687–701. [CrossRef]
21. Chisari, C.; Francavilla, A.B.; Latour, M.; Piluso, V.; Rizzano, G.; Amadio, C. Critical issues in parameter calibration of cyclic
models for steel members. Eng. Struct. 2017, 132, 123–138. [CrossRef]
22. Fiorino, L.; Macillo, V.; Landolfo, R. Experimental characterization of quick mechanical connecting systems for cold-formed steel
structures. Adv. Struct. Eng. 2017, 20, 1098–1110. [CrossRef]
23. Fiorino, L.; Iuorio, O.; Macillo, V.; Terracciano, M.T.; Pali, T.; Landolfo, R. Seismic design method for CFS diagonal strap-braced
stud walls: Experimental validation. J. Struct. Eng. 2016, 142, 1–12. [CrossRef]
24. Landolfo, R.; Fiorino, L.; Iuorio, O. A specific procedure for seismic design of cold-formed steel housing. Adv. Steel Construct.
2010, 6, 603–618.
25. Fiorino, L.; Iuorio, O.; Macillo, V.; Landolfo, R. Performance-based design of sheathed CFS buildings in seismic area.
Thin Wall. Struct. 2012, 61, 248–257. [CrossRef]Materials 2021, 14, 118 12 of 12
26. Fiorino, L.; Iuorio, O.; Landolfo, R. Sheathed cold-formed steel housing: A seismic design procedure. Thin Wall. Struct. 2009,
47, 919–930. [CrossRef]
27. Fülöp, L.; Dubina, D. Performance of wall-stud cold-formed shear panels under monotonic and cyclic loading: Part II: Numerical
modelling and performance analysis. Thin Wall. Struct. 2004, 42, 339–349. [CrossRef]
28. Kim, T.-W.; Wilcoski, J.; Foutch, D.A. Analysis of measured and calculated response of a cold-formed steel shear panel structure.
J. Earthq. Eng. 2007, 11, 67–85. [CrossRef]
29. Macillo, V.; Shakeel, S.; Fiorino, L.; Landolfo, R. Development and calibration of hysteretic model for CFS strap braced stud walls.
Int. J. Adv. Steel Construct. 2018, 14, 337–360. [CrossRef]
30. Pastor, N.; Rodríguez-Ferran, A. Hysteretic modelling of x-braced shear walls. Thin Wall. Struct. 2005, 43, 1567–1588. [CrossRef]
31. Zeynalian, M.; Ronagh, H.R. A numerical study on seismic characteristics of knee-braced cold formed steel shear walls.
Thin Wall. Struct. 2011, 49, 1517–1525. [CrossRef]
32. Zeynalian, M.; Ronagh, H.R. A numerical study on seismic performance of strap-braced cold-formed steel shear walls.
Thin Wall. Struct. 2012, 60, 229–238. [CrossRef]
33. Mirzaei, A.; Sangree, R.H.; Velchev, K.; Comeau, G.; Balh, N.; Rogers, C.A.; Schafer, B.W. Seismic capacity-based design of narrow
strap-braced cold-formed steel walls. J. Constr. Steel Res. 2015, 115, 81–91. [CrossRef]
34. Gerami, M.; Lotfi, M.; Nejat, R. Inelastic behavior of cold-formed braced walls under monotonic and cyclic loading.
Int. J. Adv. Struct. Eng. 2015, 7, 181–209. [CrossRef]
35. Kim, T.-W.; Wilcoski, J.; Foutch, D.A.; Lee, M.S. Shaketable tests of a cold-formed steel shear panel. Eng. Struct. 2006,
28, 1462–1470. [CrossRef]
36. Comeau, G.; Velchev, K.; Rogers, C.A. Development of seismic force modification factors for cold-formed steel strap braced walls.
Can. J. Civ. Eng. 2010, 37, 236–249. [CrossRef]
37. Fiorino, L.; Shakeel, S.; Landolfo, R. Behaviour factor (q) evaluation the CFS braced structures according to FEMA P695.
J. Constr. Steel Res. 2017, 138, 324–339. [CrossRef]
38. Mazzoni, S.; McKenna, F.; Scott, M.H.; Fenves, G.L. OpenSees. 2009. Available online: https://opensees.berkeley.edu/ (accessed
on 28 December 2020).
39. Fiorino, L.; Terracciano, M.T.; Landolfo, R. Experimental investigation of seismic behaviour of low dissipative CFS strap-braced
stud walls. J. Constr. Steel Res. 2016, 127, 92–107. [CrossRef]
40. Harris, H.G.; Sabnis, G.M. Structural Modeling and Experimental Techniques; CRC Press: Boca Raton, FL, USA, 1999.
41. Fiorino, L.; Bucciero, B.; Landolfo, R. Shake table tests of three storey cold-formed steel structures with strap-braced walls.
Bull. Earthq. Eng. 2019, 17, 4217–4245. [CrossRef]
42. Campiche, A.; Shakeel, S.; Bucciero, B.; Pali, T.; Fiorino, L.; Landolfo, R. Seismic behaviour of strap-braced LWS structures: Shake
table testing and numerical modelling. Sci. Eng. 2018, 473, 012032. [CrossRef]
43. Structural Vibration Solutions A/S. ARTeMIS Modal 5.2.1.1. 2018. Available online: https://svibs.com/ (accessed on
28 December 2020).
44. Leng, J.; Peterman, K.D.; Bian, G.; Buonopane, S.G.; Schafer, B.W. Modeling seismic response of a full-scale cold-formed
steel-framed building. Eng. Struct. 2017, 153, 146–165. [CrossRef]
45. American Society of Civil Engineers. SEI/ASCE, ASCE 7-10 Minimim Design Loads for Buildings and Other Structures; American
Society of Civil Engineers: Reston, VG, USA, 2010.You can also read