Contagion Effect in Cryptocurrency Market - MDPI
←
→
Page content transcription
If your browser does not render page correctly, please read the page content below
Journal of
           Risk and Financial
           Management

Communication
Contagion Effect in Cryptocurrency Market
Paulo Ferreira 1,2,3, *       and Éder Pereira 4,5
 1    VALORIZA—Research Center for Endogenous Resource Valorization, 7300 Portalegre, Portugal
 2    Instituto Politécnico de Portalegre, 7300 Portalegre, Portugal
 3    CEFAGE-UE, IIFA, Universidade de Évora, Largo dos Colegiais 2, 7000 Évora, Portugal
 4    Programa de Modelagem Computacional, SENAI Cimatec, Av. Orlando Gomes 1845, 41650-010 Salvador,
      BA, Brazil
 5    Instituto Federal do Maranhão, 65075-441 São Luís-MA, Brazil
 *    Correspondence: pferreira@ipportalegre.pt; Tel.: +351-268-628-528

 Received: 11 June 2019; Accepted: 8 July 2019; Published: 10 July 2019

 Abstract: The rapid development of cryptocurrencies has drawn attention to this particular market,
 with investors trying to understand its behaviour and researchers trying to explain it. The evolution of
 cryptocurrencies’ prices showed a kind of bubble and a crash at the end of 2017. Based on this event,
 and on the fact that Bitcoin is the most recognized cryptocurrency, we propose to evaluate the contagion
 effect between Bitcoin and other major cryptocurrencies. Using the Detrended Cross-Correlation
 Analysis correlation coefficient (∆ρDCCA) and comparing the period after and before the crash,
 we found evidence of a contagion effect, with this particular market being more integrated now than
 in the past—something that should be taken into account by current and potential investors.

 Keywords: cryptocurrency; contagion effect; detrended cross-correlation analysis; Bitcoin

1. Introduction
      Cryptocurrencies are digital currencies which can be used for direct retail purchases but also as
financial assets in general. They are characterized by some features that make them different from
other assets, namely the facts that they are not subject to any centralized institutional authority and
that they do not have physical representation. Another important feature, which makes this kind
of currency somewhat controversial, is the fact that they are not associated with any tangible assets
(Corbet et al. 2019).
      Since the creation of Bitcoin in 2009, which was the first cryptocurrency, this particular market
has increased its value exponentially, reaching about 260 billion USD of capitalization in May 2019.
Bitcoin itself was responsible for about 55% of that capitalization, being by far the most important
cryptocurrency. This evolution makes cryptocurrencies very interesting for investors, as well as for
researchers, with a growing body of literature on several issues (Urquhart 2018; Corbet et al. 2019).
These studies include topics more linked with financial issues like efficiency or the relationship with
other assets (which is addressed in the next section), in addition to analysis issues like regulation
or even linkages with possibly illicit activities (see, respectively, the works of Chaffee (2018) and
Campbell-Verduyn (2018) as examples on each of those topics).
      Despite the evolution of cryptocurrencies’ prices, during 2017 this market experienced a kind of
bubble, with prices reaching maximum levels on 15 December 2017, followed by a sharp decrease.
With such an episode, and considering Bitcoin as the most relevant cryptocurrency, we can evaluate
the possibility of a contagion effect in this market. According to Forbes and Rigobon (2002), there is a
certain pre-existing integration between assets and, after a given episode of instability, this relationship
is intensified, i.e., correlations between those assets increase.

J. Risk Financial Manag. 2019, 12, 115; doi:10.3390/jrfm12030115                  www.mdpi.com/journal/jrfm
J. Risk Financial Manag. 2019, 12, 115                                                                 2 of 8

      Based on the Detrended Cross-Correlation Analysis correlation coefficient (ρDCCA), we calculated
this correlation both before and after that episode. Furthermore, we estimated the ∆ρDCCA, which
could be considered a measure of contagion. Although the literature on cryptocurrencies is growing
rapidly, our paper extends the existing literature by focusing on a specific event, showing the importance
of not only that event but also the role of Bitcoin in this particular market. Moreover, the employed
methodology allowed us to conduct an analysis of contagion considering different time scales, which
could be interesting because short-run impacts (lower time scales) could be different from long-run
ones (higher time scales).
      Our main results show the existence of a contagion effect between Bitcoin and the other
cryptocurrencies studied, excepting Tether, which indicates a more interconnected market now
than in the past. The remainder of the work is organized as follows: Section 2 presents a literature
review on work involving cryptocurrencies; Section 3 describes the methodology and data; Section 4
presents the results; Section 5 concludes the paper.

2. Literature Review
     As previously identified, there is a clear interest in the cryptocurrency market, not only among the
general public and investors but also among researchers in several different areas. Corbet et al. (2019) made
a very interesting survey of work involving cryptocurrencies, dividing research in non-quantitative
and quantitative and dividing papers in five different areas: bubble dynamics, regulation, cybercrime,
diversification and efficiency.
     Regarding quantitative research, which is our focus, this kind of work seems to originate
in 2013. For example, Kristoufek (2013) related the increased valuation of Bitcoin to the increased
interest in that currency. Gronwald (2014) used a GARCH (Generalized Autoregressive Conditional
Heteroskedasticity) approach and concluded that Bitcoin was marked by extreme price movements,
probably because it was still an immature market. Bornholdt and Sneppen (2014) compared Bitcoin
with other cryptocurrencies in terms of their importance, and concluded at that time that Bitcoin did not
show special advantages over other cryptocurrencies. Using complex networks, Kondor et al. (2014)
identified that cryptocurrencies in general were evolving and accumulating value owing to their
increasing acceptance. Kristoufek (2015) studied the potential drivers of Bitcoin prices, identifying that
it has properties of a standard financial asset as well as properties of a speculative asset.
     These are some prior papers devoted to analyzing the quantitative aspects of cryptocurrencies.
However, as mentioned, the literature on cryptocurrencies is constantly growing, and recently many
studies have been found to analyze cryptocurrencies. One of the most researched issues concerns
the efficiency of the cryptocurrency market (Urquhart 2016; Bariviera 2017; Nadarajah and Chu 2017;
Tiwari et al. 2018, among others), with most studies concluding on the inefficiency of these assets
(although with some evidence that the market is becoming more efficient—see, for example, Khuntia
and Pattanayak (2018)). A comprehensive recent survey about the efficiency of cryptocurrencies is
found in Kyriazis (2019).
     Some studies analyzed bubbles in the cryptocurrency market. For example, Cheah and Fry (2015),
Corbet et al. (2018a) and Chaim and Laurini (2019) all found evidence of the possible existence of
bubbles in cryptocurrencies.
     We also found studies on the similarities of cryptocurrencies and other assets. For example,
Baumöhl (2018) analyzed the connection between forex and cryptocurrencies and found evidence of a
low connection between those markets. Corbet et al. (2018b) analyzed three different cryptocurrencies
and other financial assets, and found some segmentation between them, concluding that investment in
cryptocurrencies could offer diversification opportunities to investors, mainly in short time horizons.
Symitsi and Chalvatzis (2018) analyzed the linkages between Bitcoin and energy and technology
companies and also found some relationship between those markets. Kristjanpoller and Bouri (2019)
also analyzed the cross-correlations between cryptocurrencies and conventional currencies, pointing
out significant asymmetric characteristics in the cross-correlations. Ji et al. (2019a) applied network
J. Risk Financial Manag. 2019, 12, 115                                                                 3 of 8

methodologies to analyze linkages between cryptocurrencies and other commodities, finding connections
with some of those commodities. Bouri et al. (2019a) analyzed linkages between cryptocurrencies,
focusing on the relationship between volatility measures and discriminating between transitory and
permanent causalities. The authors concluded that permanent shocks are more important. Ji et al. (2019b)
also analyzed the information interdependence between cryptocurrencies and commodities, with a
time-varying approach, and concluded that cryptocurrencies are integrated within broadly defined
commodity markets.
      Previous work analyzed comovements between cryptocurrencies and other assets, while several
studies analyzed comovements among different cryptocurrencies. For example, Beneki et al. (2019)
centered their analysis on the relationship between Bitcoin and Ethereum, and determined that
correlations exist, with each cryptocurrency influencing the other with a time-varying kind of
influence. Mensi et al. (2019) used wavelet methodologies to study the comovements among major
cryptocurrencies. Despite the existence of comovements, the authors concluded that mixed portfolios
with different cryptocurrencies could be interesting for diversification purposes. Besides analyzing the
linkages with commodities, Ji et al. (2019a) studied the connectedness of return and volatility in major
cryptocurrencies, finding that Litecoin and Bitcoin are in the center of the connectedness in terms of
returns, and that negative returns have larger effects than positive returns. In the case of volatility,
Bitcoin is the cryptocurrency with greatest influence.
      Bouri et al. (2019b) analyzed the possibility of herding behavior in the cryptocurrency market.
While with a static approach, the evidence does not confirm that effect, with a dynamic analysis, due
to the existence of breaks and non-linearities in data, that effect seems to be found. In another study,
Bouri et al. (2019c) analyzed whether explosivity in one cryptocurrency can lead to explosivity in other
cryptocurrencies, finding evidence of connections between those assets.
      These two studies could be considered as a starting point for our analysis, because they draw attention
to the need to study contagion in the cryptocurrency market. Analyzing the existence of a contagion
effect in the cryptocurrency market is also present in other studies. For example, Antonakakis et al. (2019)
investigated the transmission mechanism among the top nine cryptocurrencies between 15 August
2015 and 31 May 2018, finding that periods of high (low) uncertainty were characterized by strong
(low) connectivity, with Bitcoin affecting the market’s connectivity the most. In another analysis,
Silva et al. (2019) analyzed 50 cryptocurrencies with greater liquidity, identifying the contagion effect
of Bitcoin in almost all cases.
      In this study, to analyze the possibility of a contagion effect, we used the ∆ρDCCA proposed by
Da Silva et al. (2016), based on Zebende (2011) cross-correlation coefficient. The main contribution of
this work lies in the analysis of multiscale contagion applied to the cryptocurrency market. Moreover,
and as mentioned by Bouri et al. (2019b), this market seems to suffer from non-linearities, so the use of
the proposed methodology was appropriate. We employed the methodology proposed by Guedes et al.
(2018a, 2018b) to test the statistical significance of the contagion effect.

3. Data and Methodology
     Based on https://coinmarketcap.com/, we retrieved data for the cryptocurrencies with greatest
capitalization and with information from at least as far back as July 2016 to 23 May 2019. As we
wanted to compare the ρDCCA before and after the crash of December 2017, and as the post-crash
period comprised a total of 523 observations, we looked for cryptocurrencies that had the same
number of observations in the pre-crash period. Besides Bitcoin, the 10 cryptocurrencies with greatest
capitalization and with information for the time period under analysis were Ethereum, Ripple (XRP),
Litecoin, Tether, Stellar, Monero, Dash, NEM, Dogecoin and Waves.
     According to Forbes and Rigobon (2002), the contagion effect implies an increase in the correlation
between financial assets after the occurrence of a given event. We followed the intuition of those
authors, analyzing the correlation between Bitcoin and 10 other major cryptocurrencies, splitting
the sample before and after the price decrease at the end of 2017 and using the coefficient of
J. Risk Financial Manag. 2019, 12, 115 4 of 8
Zebende (2011) based on the DCCA proposed by Podobnik and Stanley (2008). Considering two
different datasets, xt and yt , with k = 1, . . . , t equidistant observations, the first step of DCCA
consists of integrating both series and calculating x(t) = tk=1 xk and y(t) = tk=1 yk . After this,
P P
the whole samples are divided into boxes of equal length, with dimension n, and are divided into N-n
overlapping boxes. With ordinary least squares, local trends are calculated (e xk and eyk ) and used to
detrend the original time series, calculating the difference
between the original values and the trend.
1 Pi+n
The expression f2DCCA = n−1 (
k=i k
x − x
ek ) y k − eyk identifies the covariance of the residuals of each
box. Then, summing those values for all boxes of size n, we obtain the detrended covariance given by
1 PN−n 2
F2DCCA (n) = N−n i=1 fDCCA . Repeating the process for all possible length boxes leads to obtaining
the DCCA exponent from the relationship between the DCCA fluctuation function and n. This results
in the power law FDCCA (n) ∼ nλ , with λ being the parameter of interest of the DCCA, which quantifies
the long-range power-law cross-correlations.
The DCCA identifies the type of cross-correlation (positive or negative) but does not quantify
the level of cross-correlation. This quantification is made by the correlation coefficient proposed by
Zebende (2011), which combines DCCA with DFA (Detrended Fluctuation Analysis), a methodology
used to identify the level of dependence of each individual time series. That correlation coefficient is
F2 DCCA (n)
given by ρDCCA(n) = FDFA{xi} (n)FDFA{yi} (n)
.
This is a scale-dependent coefficient, and it is possible to analyze different behaviors considering
different time scales. Moreover, it has desirable properties, as described by Kristoufek (2014) and
Zhao et al. (2017), namely its efficiency and the fact that it ranges from −1 to 1. We used the procedure
reported by Podobnik et al. (2011) to identify the critical values in order to test the significance of the
correlation levels.
As previously mentioned, we intended to calculate contagion, so we obtained a correlation
coefficient for the periods before and after the bubble episode at the end of 2017. Following the idea
proposed by Da Silva et al. (2016), we calculated the ∆ρDCCA (n) given by the difference between the
correlation level after the bubble episode and that before the episode. If the value of ∆ρ is positive,
the correlation coefficients increase and, according to Forbes and Rigobon (2002), contagion exists.
We used the critical values of Guedes et al. (2018a, 2018b) to evaluate the statistical significance of
the effect.
4. Results
Figure 1 shows the evolution of prices in the cryptocurrencies and sample analyzed. Prices were
transformed in an index for better comparison. The figure shows the constant increase in prices until
December 2017. Except for Tether, whose price was relatively stable throughout the sample, the other
cryptocurrencies seemed to have some similarities in their fluctuations.
The prices were then transformed in return rates, using the traditional difference of price
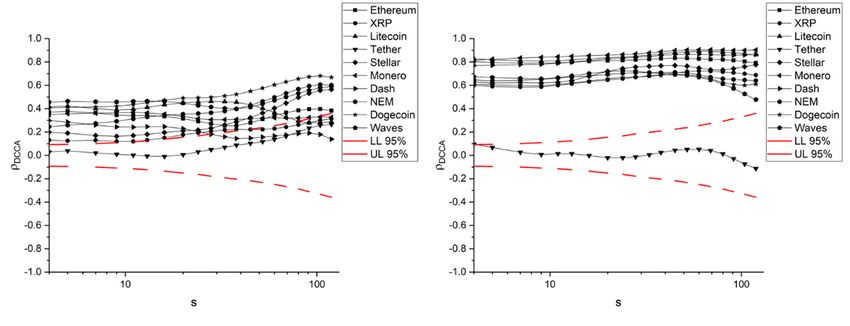
logarithms between two consecutive moments, to calculate the correlations. Figure 2 shows the
correlation coefficient in both sub-periods. It is clear that the correlation pattern was generally higher
in the post-crash than in the pre-crash period. Tether did not show a significant correlation with
Bitcoin in either the pre or post-crash period, which is not surprising from analysis of Figure 1
(which reinforces the robustness of the method). Besides this particular cryptocurrency, Dash
(from 30 days), XRP (from 50 days) and Litecoin and Monero (for higher time scales) showed some
evidence of a non-significant correlation with Bitcoin in the first period under analysis. In the second
period, and once again except for Tether, all the cryptocurrencies showed significant correlations with
Bitcoin, in some cases with a very high level of correlation.
4. Results
        Figure 1 shows the evolution of prices in the cryptocurrencies and sample analyzed. Prices were
transformed in an index for better comparison. The figure shows the constant increase in prices until
December 2017. Except for Tether, whose price was relatively stable throughout the sample, the other
J. Risk Financial Manag. 2019, 12, 115                                                             5 of 8
cryptocurrencies seemed to have some similarities in their fluctuations.

J. Risk Financial Manag. 2019, 12, x FOR PEER REVIEW                                                               5 of 8

     The prices were then transformed in return rates, using the traditional difference of price
logarithms between two consecutive moments, to calculate the correlations. Figure 2 shows the
correlation coefficient in both sub-periods. It is clear that the correlation pattern was generally higher
in the post-crash than in the pre-crash period. Tether did not show a significant correlation with
Bitcoin in either the pre or post-crash period, which is not surprising from analysis of Figure 1 (which
reinforces the robustness of the method). Besides this particular cryptocurrency, Dash (from 30 days),
XRP (from 50 days) and Litecoin and Monero (for higher time scales) showed some evidence of a
non-significant correlation with Bitcoin in the first period under analysis. In the second period, and
once again except for Tether, all the cryptocurrencies showed significant correlations with Bitcoin, in
some cases with a very high level of correlation.
                   Figure 1. Evolution of cryptocurrency prices in the sample under analysis.
                    Figure 1. Evolution of cryptocurrency prices in the sample under analysis.

     Figure 2. Detrended Cross-Correlation Analysis (DCCA) correlation coefficient between Bitcoin and
     the other2.cryptocurrencies
      Figure                      in both periods
                 Detrended Cross-Correlation       (pre-crash
                                                Analysis       in thecorrelation
                                                          (DCCA)      left panel and post-crash
                                                                                 coefficient     in theBitcoin
                                                                                             between    right panel),
                                                                                                               and
     depending    on the time scale (s—in
      the other cryptocurrencies    in bothdays). Dashed
                                            periods        lines represent
                                                      (pre-crash            lower
                                                                   in the left     and
                                                                               panel   upper
                                                                                     and      critical values,
                                                                                          post-crash           which
                                                                                                       in the right
      panel),
     were     depending
           used  to test theonhypotheses H0: ρDCCA
                               the time scale           = 0 and
                                              (s—in days).       H1: ρDCCA
                                                              Dashed    lines represent
                                                                                , 0.    lower and upper critical
      values, which were used to test the hypotheses H0: ρDCCA = 0 and H1: ρDCCA ≠ 0.
      Figure 3 represents the difference in the correlation coefficients before and after the crash. If positive,
this could
      Figurebe3 understood
                 represents theas adifference
                                     contagionineffect,   as described
                                                    the correlation       by Forbes
                                                                       coefficients     and Rigobon
                                                                                      before  and after(2002).   Except
                                                                                                          the crash. If
for Tether,this
 positive,  Dogecoin
                could be and Waves (the
                           understood     aslatter  two justeffect,
                                             a contagion      for higher   time scales
                                                                     as described        and relatively
                                                                                    by Forbes   and Rigobonlow absolute
                                                                                                                (2002).
 Except for
values),  all Tether,
              the otherDogecoin   and Wavesexhibited
                          cryptocurrencies       (the latteran
                                                             two   just for higher
                                                                 increased           time scales
                                                                              correlation          and relatively
                                                                                            with Bitcoin,          low
                                                                                                             with Dash,
 absoluteand
Litecoin   values), all the
               Monero       other
                         having  thecryptocurrencies
                                       highest increases.exhibited    an increased
                                                            This contagion     effectcorrelation
                                                                                       means thatwith    Bitcoin, with
                                                                                                    the cryptocurrency
 Dash, Litecoin
market   as a wholeandis Monero
                         now more   having   the highest
                                       integrated    than inincreases.    This contagion
                                                              the past, implying              effect means that
                                                                                      that cryptocurrencies    are the
                                                                                                                    now
 cryptocurrency
more   exposed to market
                    possibleas    a whole
                              price   shocks is    nowmain
                                              in the     more     integrated than
                                                             cryptocurrency            in the past, implying that
                                                                                 (Bitcoin).
 cryptocurrencies
      The increasedare   now more
                      integration  of exposed   to possible
                                      this particular  marketprice   shocksmeans
                                                                ultimately   in the main   cryptocurrency
                                                                                    that most                (Bitcoin).
                                                                                                of the cryptocurrencies
being studied are now more sensitive to changes in the price of Bitcoin, with all the risks that arise from
this increased exposure. So, any shock in Bitcoin’s price could pass along to other cryptocurrencies,
which could cause some degree of instability in the market. Moreover, due to the increase of the
cryptocurrency market as a whole, those changes could also impact other financial markets, depending
on their relationship with Bitcoin and other assets.
positive, this could be understood as a contagion effect, as described by Forbes and Rigobon (2002).
Except for Tether, Dogecoin and Waves (the latter two just for higher time scales and relatively low
absolute values), all the other cryptocurrencies exhibited an increased correlation with Bitcoin, with
Dash, Litecoin and Monero having the highest increases. This contagion effect means that the
cryptocurrency        market as a whole is now more integrated than in the past, implying 6that
J. Risk Financial Manag. 2019, 12, 115                                                             of 8
cryptocurrencies are now more exposed to possible price shocks in the main cryptocurrency (Bitcoin).

     Figure 3. ∆ρDCCA regarding Bitcoin.            UL and LL represent upper and lower critical values
     (Guedes et al. 2018a, 2018b).

5. Concluding Remarks
     Analysis of the contagion effect is an important instrument to observe how certain financial assets
are related after extreme events such as crises or bubbles. Since the study of Forbes and Rigobon (2002),
contagion effects have been identified in several markets, causing a wide and interesting debate in the
world’s financial community. In the present analysis, we adapted this contagion concept to analyze
the cryptocurrency market, since this is an important market due to both its financial volume and the
growing interest shown in it.
     This research identified a contagion effect between Bitcoin returns and the returns of most of the
other cryptocurrencies analyzed. The exception is Tether, with no evidence of a significant contagion
effect for any time scale. This analysis reveals that this market experienced increasing integration
between the main cryptocurrencies after the bubble that occurred in December 2017.
     Our results provide important information for current and potential investors when analyzing
financial risk in the cryptocurrency market. In fact, in constructing portfolios, it could be risky to
consider investing in several cryptocurrencies, since they seem to be more highly integrated now than in
the past (although Mensi et al. (2019) identified the possibility of diversification using cryptocurrencies).
Moreover, and considering that other recent studies identified linkages between this particular market
and other assets, this may also affect the possibility of diversification. In fact, the possibility of increased
integration between markets, in addition to the cryptocurrency market, is an important issue for
future research so as to continuously monitor the possibility of using several markets and assets for
diversification purposes. Moreover, the possibility of conducting this analysis with time-varying
approaches is also a challenge for future research, which could provide historical information about
the evolution of these relationships.

Author Contributions: Conceptualization, P.F. and É.P.; methodology, P.F. and É.P.; software, P.F. and É.P.; formal
analysis, P.F. and É.P.; investigation, P.F. and É.P.; data curation, P.F. and É.P.; writing—original draft preparation,
P.F. and É.P.; writing—review and editing, P.F. and É.P.
Funding: Paulo Ferreira is pleased to acknowledge financial support from Fundação para a Ciência e a Tecnologia
(grant number UID/ECO/04007/2019). Éder Pereira is pleased to acknowledge financial support from Fundação de
Amparo e Pesquisa do Estado da Bahia—FAPESB (grant number BOL 0261/2017).
Conflicts of Interest: The authors declare no conflict of interest.
J. Risk Financial Manag. 2019, 12, 115                                                                          7 of 8

References
Antonakakis, Nikolaos, Ioannis Chatziantoniou, and David Gabauer. 2019. Cryptocurrency market contagion:
       Market uncertainty, market complexity, and dynamic portfolios. Journal of International Financial Markets
       Institutions and Money 61: 37–51. [CrossRef]
Bariviera, Aurelio. 2017. The inefficiency of Bitcoin revisited: A dynamic approach. Economics Letters 161: 1–4.
       [CrossRef]
Baumöhl, Eduard. 2018. Are cryptocurrencies connected to forex? A quantile cross-spectral approach. Finance
      Research Letters 29: 363–72. [CrossRef]
Beneki, Christina, Alexandros Koulis, Nikolaos Kyriazis, and Stephanos Papadamou. 2019. Investigating Volatility
      Transmission and Hedging Properties between Bitcoin and Ethereum. Research in International Business and
      Finance 48: 219–27. [CrossRef]
Bornholdt, Stefan, and Kim Sneppen. 2014. Do Bitcoins make the world go around? on the dynamics of competing
       crypto-currencies. arXiv.
Bouri, Elie, Bryan Lucey, and David Roubaud. 2019a. The volatility surprise of leading cryptocurrencies: Transitory
       and permanent linkages. Finance Research Letters. [CrossRef]
Bouri, Elie, Rangan Gupta, and David Roubaud. 2019b. Herding behaviour in cryptocurrencies. Finance Research
      Letters 29: 216–21. [CrossRef]
Bouri, Elie, Syed Shahzad, and David Roubaud. 2019c. Co-explosivity in the cryptocurrency market. Finance
      Research Letters 29: 178–83. [CrossRef]
Campbell-Verduyn, Malcolm. 2018. Bitcoin, crypto-coins, and global anti-money laundering governance. Crime,
      Law and Social Change 69: 283–305. [CrossRef]
Chaffee, Eric. 2018. The Heavy Burden of Thin Regulation: Lessons Learned from the SEC’s Regulation of
       Cryptocurrencies. Mercer Law Review 70: 615.
Chaim, Pedro, and Márcio Laurini. 2019. Is Bitcoin a bubble? Physica A 517: 222–32. [CrossRef]
Cheah, Eng-Tuck, and John Fry. 2015. Speculative bubbles in Bitcoin markets? An empirical investigation into the
       fundamental value of Bitcoin. Economics Letters 130: 32–36. [CrossRef]
Corbet, Shaen, Brian Lucey, and Larisa Yarovaya. 2018a. Datestamping the Bitcoin and Ethereum bubbles. Finance
      Research Letters 26: 81–88. [CrossRef]
Corbet, Shaen, Andrew Meegan, Charles Larkin, Brian Lucey, and Larisa Yarovaya. 2018b. Exploring the dynamic
       relationships between cryptocurrencies and other financial assets. Economics Letters 165: 28–34. [CrossRef]
Corbet, Shaen, Brian Lucey, Andrew Urquhart, and Larisa Yarovaya. 2019. Cryptocurrencies as a financial asset:
      A systematic analysis. International Review of Financial Analysis 62: 182–99. [CrossRef]
Da Silva, Marcus Fernandes, Éder Johnson de Area Leão Pereira, Aloisio Machado da Silva Filho, Arleys Pereira
       Nunes de Castro, José Garcia Vivas Miranda, and Gilney Figueira Zebende. 2016. Quantifying the contagion
       effect of the 2008 financial crisis between the G7 countries (by GDP nominal). Physica A: Statistical Mechanics
       and Its Applications 453: 1–8. [CrossRef]
Forbes, Kristin, and Roberto Rigobon. 2002. No contagion, only interdependence: Measuring stock market
       comovements. The Journal of Finance 57: 2223–61. [CrossRef]
Gronwald, Marc. 2014. The Economics of Bitcoins—Market Characteristics and Price Jumps. CESifo Working Paper
       Series No. 5121. Munich: CESifo Group.
Guedes, Everaldo, Andréa Brito, Florêncio Filho, B. Fernandez, Arleys Castro, Aloísio Filho, and Gilney Zebende.
       2018a. Statistical test for DCCA cross-correlation coefficient. Physica A 501: 134–40. [CrossRef]
Guedes, Everaldo, Andreá Brito, Florêncio Filho, B. Fernandez, Arleys Castro, Aloísio Filho, and Gilney Zebende.
       2018b. Statistical test for DCCA: Methods and data. Data Brief 18: 795–98. [CrossRef]
Ji, Qiang, Elie Bouri, Chi Keung Marco Lau, and David Roubaud. 2019a. Dynamic connectedness and integration
       in cryptocurrency markets. International Review of Financial Analysis 63: 257–72. [CrossRef]
Ji, Qiang, Elie Bouri, David Roubaud, and Ladislav Kristoufek. 2019b. Information interdependence among
       energy, cryptocurrency and major commodity markets. Energy Economics 81: 1042–55. [CrossRef]
Khuntia, Sashikanta, and Jamini Pattanayak. 2018. Adaptive market hypothesis and evolving predictability of
       bitcoin. Economics Letters 167: 26–28. [CrossRef]
Kondor, Dániel, Márton Posfai, István Csabai, and Gábor Vattay. 2014. Do the rich get richer? an empirical
       analysis of the Bitcoin transaction network. PLoS ONE 9: e86197. [CrossRef] [PubMed]
J. Risk Financial Manag. 2019, 12, 115 8 of 8
Kristjanpoller, Werner, and Elie Bouri. 2019. Asymmetric multifractal cross-correlations between the main world
currencies and the main cryptocurrencies. Physica A 523: 1057–71. [CrossRef]
Kristoufek, Ladislav. 2013. BitCoin meets Google Trends and Wikipedia: Quantifying the relationship between
phenomena of the Internet era. Scientific Reports 3: 3415. [CrossRef] [PubMed]
Kristoufek, Ladislav. 2014. Measuring correlations between non-stationary series with DCCA coefficient. Physica A
402: 291–98. [CrossRef]
Kristoufek, Ladislav. 2015. What Are the Main Drivers of the Bitcoin Price? Evidence from Wavelet Coherence
Analysis. PLoS ONE 10: e0123923. [CrossRef] [PubMed]
Kyriazis, Nikolaos. 2019. A Survey on Efficiency and Profitable Trading Opportunities in Cryptocurrency Markets.
Journal of Risk and Financial Management 12: 67. [CrossRef]
Mensi, Walid, Mobeen Rehman, Khamis Al-Yahyaee, Idries Al-Jarrah, and Sang Kang. 2019. Time frequency
analysis of the commonalities between Bitcoin and major Cryptocurrencies: Portfolio risk management
implications. The North American Journal of Economics and Finance 48: 283–94. [CrossRef]
Nadarajah, Saralees, and Jeffrey Chu. 2017. On the inefficiency of Bitcoin. Economics Letters 150: 6–9. [CrossRef]
Podobnik, Boris, and Harry Eugene Stanley. 2008. Detrended Cross-Correlation Analysis: A new method for
analyzing two nonstationary time series. Physical Review Letters 100: 084102. [CrossRef] [PubMed]
Podobnik, Boris, Zhi-Qiang Jiang, Wei-Xing Zhou, and Harry Eugene Stanley. 2011. Statistical tests for power-law
cross-correlated processes. Physical Review E 84: 066118. [CrossRef] [PubMed]
Silva, Paulo, Marcelo Klotzle, Antonio Pinto, and Leonardo Gomes. 2019. Herding behavior and contagion in the
cryptocurrency market. Journal of Behavioral and Experimental Finance 22: 41–45. [CrossRef]
Symitsi, Efthymia, and Konstantinos Chalvatzis. 2018. Return, volatility and shock spillovers of Bitcoin with
energy and technology companies. Economics Letters 170: 127–30. [CrossRef]
Tiwari, Aviral, Rabin Jana, Debojyoti Das, and David Roubaud. 2018. Informational efficiency of Bitcoin—An
extension. Economics Letters 163: 106–9. [CrossRef]
Urquhart, Andrew. 2016. The inefficiency of Bitcoin. Economics Letters 148: 80–82. [CrossRef]
Urquhart, Andrew. 2018. What causes the attention of Bitcoin? Economics Letters 166: 40–44. [CrossRef]
Zebende, Gilney. 2011. DCCA cross-correlation coefficient: Quantifying level of cross-correlation. Physica A 390:
614–18. [CrossRef]
Zhao, Xiaojun, Pengjian Shang, and Jingjing Huang. 2017. Several fundamental properties of DCCA
cross-correlation coefficient. Fractals 25: 1750017. [CrossRef]
© 2019 by the authors. Licensee MDPI, Basel, Switzerland. This article is an open access
article distributed under the terms and conditions of the Creative Commons Attribution
(CC BY) license (http://creativecommons.org/licenses/by/4.0/).You can also read