Singapore Real Estate Market View 2020 - Contributor: Glendon Hoon (+65 6323 1788) - SGX
←
→
Page content transcription
If your browser does not render page correctly, please read the page content below

15 August 2020

     Singapore Real Estate
     Market View
     2020

     Contributor: Glendon Hoon
                 (+65 6323 1788)

                                                    Contributor: Glendon Hoon
                                                                (+65 6323 1788)

www.fpafinancial.com                                                   1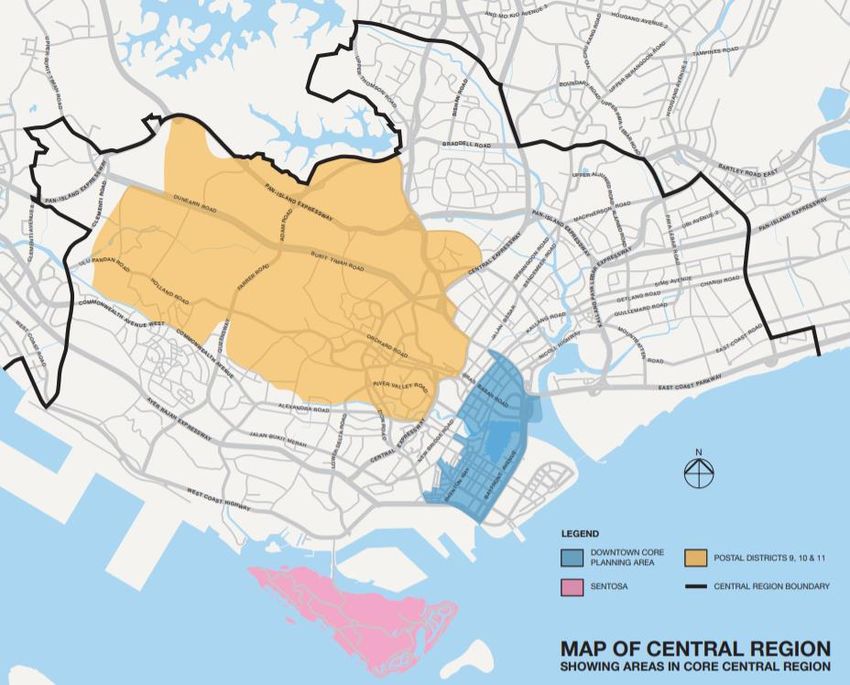
15 August 2020

Contents
I.   Real estate sector market overview
     A. Office real estate sector ………………………………………… 3-8
     B. Residential real estate sector ………………………………… 9-14
     C. Retail real estate sector ………………………………………… 15-23
II. Appendix ……………………………………………………………………… 24-25
III. Disclosures/Disclaimers ……………………………..………………… 26

www.fpafinancial.com                                        2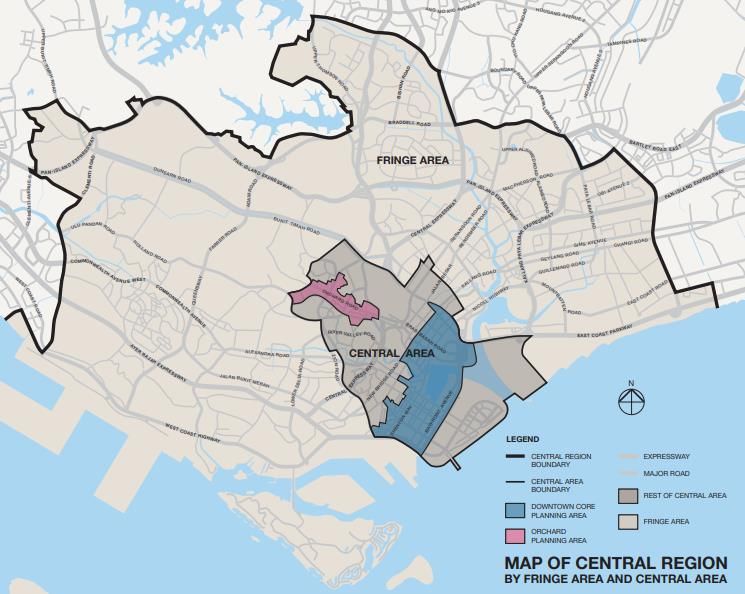
15 August 2020

Office
In this office real estate sector overview, we will first provide a market snapshot on the Q2 2020 performance
of key indicators for the office real estate sector market in Singapore. We will then provide a detailed market
update to further discuss developments in Q2 2020. Lastly, we will provide a market outlook for 2020.

OFFICE REAL ESTATE SECTOR MARKET SNAPSHOT
According to the Urban Redevelopment Authority (URA), the office price index experienced a quarter-on-
quarter (q-o-q) decline of 4.3% in Q2 2020 while the office rental index remained unchanged, as shown in
Exhibit 1. Over the quarter, office pipeline supply decreased by 2.1% and vacancy rate rose by 1.1 percentage
points.

On a year-on-year (y-o-y) basis, the office price index and office rental index fell by 12.1% and 4.6%
respectively in Q2 2020. In the quarter, on a y-o-y basis, office pipeline supply shrank by 8.7% while the
vacancy rate rose by 0.6 percentage points.

Exhibit 1: Key indicators for Singapore’s office market
                                             % change in Q2 2020
Key indicators                                q-o-q            y-o-y          Q2 2020              Q1 2020       Q2 2019
Price index                                  -4.3%           -12.1%             126.9               132.6         144.4
Rental index                                  0.0%           -4.6%              168.7               168.7         176.8
Pipeline supply in GFA ('000 sqm)            -2.1%           -8.7%               668                 682          732
Vacancy rate                            1.1% points      0.6% points           12.1%                11.0%        11.5%
Source: URA, FPA Financial

OFFICE REAL ESTATE SECTOR MARKET UPDATE
Office rentals softened in Q2 2020

According to URA, office rentals in the Central Region remained unchanged in Q2 2020, indicated by a stable
office rental index of 168.7 in both Q1 2020 and Q2 2020, as shown in Exhibit 2.

Exhibit 2: Property rental index of office space in the Central Region

                                         Office Rental Index

 180.0
 175.0
 170.0                                                                                  168.7
 165.0                                                                                      168.7
 160.0
 155.0
 150.0
          Q3      Q4     Q1     Q2     Q3       Q4     Q1     Q2        Q3     Q4     Q1     Q2
         2017    2017   2018   2018   2018     2018   2019   2019      2019   2019   2020   2020

Source: URA, FPA Financial

www.fpafinancial.com                                                                                                       3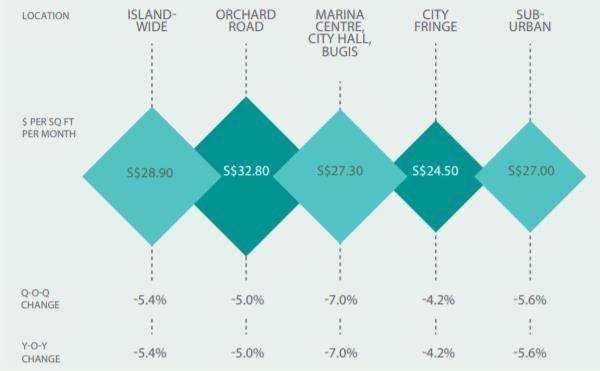
15 August 2020

In Q2 2020, median office rentals in the Downtown Core and Orchard Planning Area, based on lease
commencement, fell by 0.7% q-o-q to S$10.35 per square foot per month (psf pm), as shown in Exhibit 3.
Conversely, median office rentals for remaining areas excluding the Downtown Core and Orchard Planning Area
rose by 0.9% to S$5.49 psf pm over the second quarter. (Please refer to Appendix I for a map representation that
details the boundaries of the Downtown Core and Orchard Planning Area)

Exhibit 3: Median rentals of office space

1/ Refers to office space in buildings located in core business areas in Downtown Core and Orchard Planning Area which are relatively
modern or recently refurbished, command relatively high rentals and have large floor plate size and gross floor area.
2/ Refers to the remaining office space in Singapore which are not included in “Category 1”.
Source: URA

We also note from recent reports by several commercial real estate services companies, including CBRE,
Cushman & Wakefield (C&W), Jones Lang LaSalle (JLL) and Savills, that Grade A CBD office rents have declined
in Q2 2020. The companies’ data indicate that q-o-q decline in Grade A CBD office rents in Q2 2020 lie within a
range of 1.6% to 3.0%. The respective company data are summarized in Exhibit 4.

Exhibit 4: Q2 2020 Grade A CBD office rents

                                                 Grade A CBD office rents (S$ psf pm)
Company                                               Q2 2020                q-o-q change
CBRE                                                    11.15                     -3.0%
Cushman & Wakefield                                     10.37                     -2.3%
Jones Lang LaSalle                                      10.48                     -3.0%
Savills                                                  9.84                     -1.6%
Source: respective real estate companies

 www.fpafinancial.com                                                                                                                   4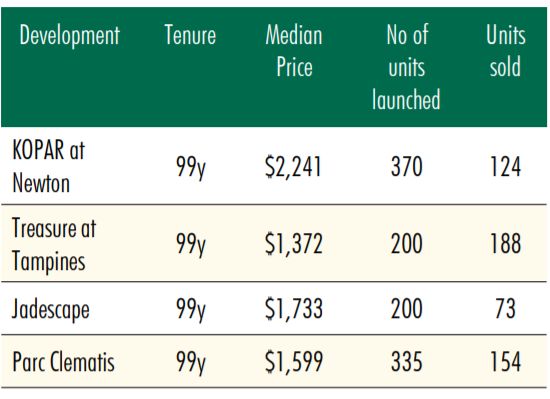
15 August 2020

Office capital value fell in Q2 2020

According to URA, the office price index for the Central Region fell by 4.3% to 126.9 in Q2 2020 from 132.6 in Q1
2020, as shown in Exhibit 5.

Exhibit 5: Property price index of office space in the Central Region

                                             Office Price Index

150.0
145.0
140.0
135.0
130.0
125.0                                                                               132.6
                                                                                            126.9
120.0
115.0
          Q3     Q4     Q1     Q2      Q3       Q4      Q1     Q2      Q3     Q4     Q1      Q2
         2017   2017   2018   2018    2018     2018    2019   2019    2019   2019   2020    2020
Source: URA, FPA Financial

We also note from the latest office report by C&W that Grade A CBD office capital value declined marginally in Q2
2020 to S$2,845. Similarly, CBRE’s latest Singapore real estate report indicated a decline in prime office capital
value to S$2,950. However, we note in JLL’s latest property market monitor that capital values for CBD
Investment Grade office were firm in Q2 2020. The JLL report indicated a 0.4% capital value growth for CBD
Investment Grade office, with capital value registering S$2,982 psf.

Major office property transactions in Q2 2020 include Shun Tak Holding’s purchase of a 30% stake in 111
Somerset located within the Orchard Road precinct and Alibaba Group’s acquisition of a 50% stake in AXA Tower
located at Shenton Way. In April, a 30% stake in 111 Somerset, an integrated development comprising two
premium grade office towers and a retail podium, was sold by Perennial Real Estate Holdings (Perennial) to Shun
Tak Holdings for S$155.1 million. Later in May, a 50% stake in AXA Tower, a 50-storey landmark Grade A office
development with a retail podium, was sold by a consortium led by Perennial to Alibaba Group’s Singapore
subsidiary for a total of S$1.68 billion.

Increased vacancy as supply absorption weakened in Q2 2020

In Q2 2020, the total supply of office space increased by 0.5% to 8.184 million square metres (sqm), as shown in
Exhibit 6. This was in part contributed by the completion of 79 Robinson Road and Centrium Square. These two
buildings achieved their Temporary Occupation Permit (TOP) in Q2 2020. Total amount of occupied office space,
however, fell by 0.8%. Owing to weaker supply absorption, the office vacancy rate rose by 1.1% points to 12.1%
in Q2 2020 from 11.0% in Q1 2020.

Exhibit 6: Stock and vacancy in the office market as at end of Q2 2020

Completed office space               As at Q1 2020            As at Q2 2020         Absolute change        % change
Available ('000 sqm)                     8,141                       8,184                   43              0.5%
Occupied ('000 sqm)                      7,249                       7,194                   -55             -0.8%
Vacant ('000 sqm)                        892                         990                     98              11.0%
Vacancy rate (%)                         11.0                        12.1                    1.1              n/a*
*n/a: not applicable
Source: URA, FPA Financial

 www.fpafinancial.com                                                                                                 5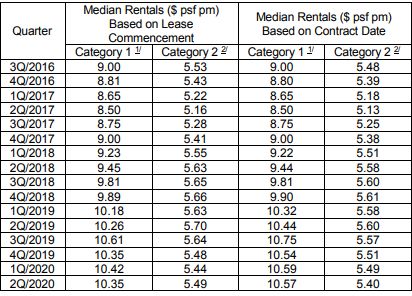
15 August 2020

Expanded pipeline supply at the end of Q2 2020

According to latest URA statistics, the expected total supply of office space coming from to-be-completed
projects as at the end of Q2 2020 shrank by 2.1% q-o-q to a total of 668,000 sqm in gross floor area (GFA). Of
which, only 9,000 sqm of additional supply is expected for completion in 2H 2020, as shown in Exhibit 7. We
note from CBRE that new office supply in 2H 2020 would only come from the completion of Afro-Asia I-Mark and
St. James Power Station. In the coming years, new supply of 184,000 sqm is expected in 2021; 250,000 sqm in
2022; 41,000 sqm in 2023; 102,000 sqm in 2024. Beyond 2024, additional supply of 82,000 sqm is expected to
be completed.

Exhibit 7: Pipeline supply of office space

Source: URA

www.fpafinancial.com                                                                                             6
15 August 2020

OFFICE REAL ESTATE SECTOR MARKET OUTLOOK
Demand could remain weak due to potential structural changes

We note from the Business Times that, despite the impact of COVID-19, some leasing deals have been done in
1H 2020. For instance, Toyota Motor Asia Pacific and QBE Insurance (Singapore) have leased a combined total
of 5,760 sqm of office space at Guoco Tower, following Grab’s relocation to one-north. Other office leasing
activities include Amazon’s potential leasing of about 8,361 sqm, at Asia Square Tower 1 and Fuji Xerox’s
potential leasing of about 5,574 sqm at Mapletree Business City. However, WFH arrangements have become a
default for many businesses, even as the Circuit Breaker measures have been lifted. Thus, future demand for
office space could remain relatively subdued. Further, we note from C&W about concerns of a long-term
structural shift in the market if companies, in particular banks and tech firms, choose to save on leasing costs
and allow majority of their employees to continue working from home. C&W highlighted that large tech firms like
Facebook and Twitter, as well as companies in the finance and banking industry, have publicly announced
arrangements for their employees to work from home in the long term. Given the above, there may be subdued
office leasing demand in the long-term.

Future supply is limited

According to latest forecast by Savills, there will be an additional CBD Grade A office supply of approximately
254,645 sqm (equivalent to 2,741,000 sq ft) to be added to the office market over the 4-year period from 2020-
2023, as shown in Exhibit 8.

Exhibit 8: Revised supply of CBD Grade A office buildings

Source: Savills

Given the above, there is expected to be an average of about 63,661 sqm of new CBD Grade A office supply per
annum from 2021-2023. We also note from C&W that this is lower than the historical 10-year annual average
(2010-2019) of about 111,483 sqm. In light of the data, we note a limited future supply of CBD Grade A office
spaces. In addition, AXA Tower will be undergoing a redevelopment following the acquisition by Alibaba, which
will reduce total available office supply by about 65,032 sqm in NLA.

www.fpafinancial.com                                                                                               7
15 August 2020

Office rents to further decline, but at a milder pace

Amid increasing pressure faced by landlords to attract and retain tenants, and relatively subdued office
leasing demand, office rents are likely to further decline this year. According to the latest forecast by Savills,
CBD Grade A office rents are expected to decline by 7.6% y-o-y to an average of S$9.32 psf this year. In
2021, Savills expects office rents to decline by 1.3% y-o-y. The forecast data by Savills are summarized in
Exhibit 9. We also note that C&W has similarly projected a full-year decline in CBD Grade A office rents of
about 10% this year.

Exhibit 9: Pipeline supply of office space

Source: Savills

Nonetheless, we note that the decline in office rents could come at a slower pace, given the expectation of
weak office demand and office supply at the same time. As we have noted, office leasing activity could
remain weak in the long term due to default WFH arrangements, while future supply per annum is limited
relative to historical supply. A simultaneous decrease in demand and supply would mean a correction
towards equilibrium, providing greater stability in office rents. We thus expect a combination of weak office
demand and reduced supply to cushion a fall in rents.

 www.fpafinancial.com                                                                                                8
15 August 2020

Residential
In this residential real estate sector overview, we will first provide a market snapshot on the Q2 2020
performance of key indicators for the residential real estate sector market in Singapore. We will then provide a
market update to further discuss developments in Q2 2020. Lastly, we will provide a market outlook for 2020.

RESIDENTIAL REAL ESTATE SECTOR MARKET SNAPSHOT
According to the Urban Redevelopment Authority (URA), the price index for Singapore’s private residential
market rose by 0.3% q-o-q in Q2 2020, while the rental index fell by 1.2% q-o-q, as shown in Exhibit 1. Over
the quarter, take-up, referring to the number of new sale units transacted in the whole of Singapore, fell by
20.3% q-o-q, while pipeline supply, which represents the total number of uncompleted private residential units
(excluding ECs) with planning approval that are expected for completion within 2H 2020 to 2024, expanded by
0.5% q-o-q. The vacancy rate, as measured by the total vacant private residential units over the total number of
completed private residential units available in the market, remain unchanged at 5.4% over the second quarter.

On a year-on-year (y-o-y) basis, the price index rose by 1.2%, while the rental index fell by 1.1% in Q2 2020. In
the quarter, on a y-o-y comparison, take-up fell by 27.1%, pipeline supply contracted by 3.1% and the vacancy
rate fell by 1.0% percentage points.

Exhibit 1: Key indicators for Singapore’s private residential market

                                                  % change in Q2 2020
Key indicators                                     q-o-q             y-o-y             Q2 2020              Q1 2020              Q2 2019
Price index                                        0.3%              1.2%                152.6                152.1                150.8
           (1)
Take-up*                                          -20.3%            -27.1%               1,713                2,149                2,350
                    (2)
Pipeline supply*                                   0.5%              -3.1%              49,090                48,868              50,674
Rental index                                       -1.2%             -1.1%               104.3                105.6                105.5
                  (3)
Vacancy rate*                                  0.0% points       -1.0% points            5.4%                 5.4%                 6.4%
*Excluding Executive Condominiums (EC)
(1) Refers to number of new sale units transacted in the whole of Singapore
(2) Refers to the total number of uncompleted private residential units (excluding Ecs) with planning approval that are expected for completion in 2H 2020-2024
(3) Refers to the total number of completed private residential units that are vacant over the total stock of completed private residential units available
Source: URA, FPA Financial

www.fpafinancial.com                                                                                                                                              9
15 August 2020
RESIDENTIAL REAL ESTATE SECTOR MARKET UPDATE
Private residential capital value rose in Q2 2020
According to latest statistics by URA, island-wide capital values of private residential properties increased in the
second quarter. The island-wide price index for private residential properties rose by 0.3% q-o-q to 152.6 from
152.1, as shown in Exhibit 2.
Exhibit 2: Price index of private residential properties (whole island)
Residential Price Index
155.0
150.0 152.6
152.1
145.0
140.0
135.0
130.0
125.0
Q3 Q4 Q1 Q2 Q3 Q4 Q1 Q2 Q3 Q4 Q1 Q2
2017 2017 2018 2018 2018 2018 2019 2019 2019 2019 2020 2020
Source: URA, FPA Financial
We further note that the price index of private residential properties rose across most of the individual submarkets,
except for RCR. A summary of the residential price index for the individual submarkets is shown in Exhibit 3.
Exhibit 3: Residential price index for the individual submarkets
Price Index
Category Q1 2020 Q2 2020 q-o-q change
All Residential 152.1 152.6 0.3%
Landed property 170.3 170.3 0.0%
Non-landed property 148.1 148.7 0.4%
CCR (1) 131.1 134.6 2.7%
RCR (2) 152.6 150.0 -1.7%
OCR (3) 177.2 177.4 0.1%
(1) Core Central Region (CCR) comprises Postal Districts 9, 10, 11, Downtown Core Planning Area and Sentosa
(2) Rest of Central Region (RCR) comprises area within Central Region that is outside those covered by CCR
(3) Outside Central Region (OCR)
Source: URA, FPA Financial
Capital values of landed properties were stable in Q2 2020, with the price index for the segment remaining
unchanged at 170.3 from the previous quarter. Overall capital values of non-landed properties rose by 0.4% q-o-q
in Q2 2020, as represented by an increase in the price index to 148.7 from 148.1. In the submarkets for non-
landed properties, on a q-o-q comparison, the price index for CCR and OCR rose by 2.7% and 0.1% respectively,
while the price index for RCR fell by 1.7%. We also note from real estate services companies like Jones Lang
LaSalle (JLL) and CBRE that residential capital values had declined in Q2 2020. Based on JLL data, capital value
for luxury residential properties (typically located in the CCR) dropped by 0.8% in Q2 2020, with capital value
registering S$2,924 per square foot (psf). Meanwhile, latest CBRE data showed that prime residential (typically
located in the CCR) capital value decreased to S$1,667 in Q2 2020.
www.fpafinancial.com 1015 August 2020
Launches exceeded take-ups in Q2 2020
Based on latest URA statistics, a total of 1,852 uncompleted private residential units, excluding Executive
Condominiums (EC), were launched by developers in Q2 2020. At the same time, a total of 1,713 completed and
uncompleted private residential units, excluding ECs, were sold in the quarter. As a result, there was a total of 139
unsold inventory units in Q2 2020. The data for launches and uptake of private residential units are summarized in
Exhibit 4.
Exhibit 4: Private residential units launched and sold by developers (excluding ECs)
4,000
3,500
3,000
No. of units
2,500
1,852
2,000
1,500 1,713
1,000
500
0
Q1 Q2 Q3 Q4 Q1 Q2 Q3 Q4 Q1 Q2 Q3 Q4 Q1 Q2
2017 2017 2017 2017 2018 2018 2018 2018 2019 2019 2019 2019 2020 2020
Launches Take-up
Source: URA, FPA Financial
We note from CBRE that launches in Q2 2020 included 370 units at KOPAR at Newton, 200 units at Treasure at
Tampines, 200 units at Jadescape and 335 units at Parc Clementis, as shown in Exhibit 5. We note that unsold
inventories existed across the selected projects. CBRE said that fewer new home sales in Q2 2020 could be
attributed to the absence of major launches as developers deferred their launch dates.
Exhibit 5: Selected projects with new units launched in Q2 2020
Source: CBRE
Looking ahead, we note from the Business Times that potential launches in the CCR in 2H 2020 include Hyll on
Holland, Cairnhill 16, Kilmt Cairnhill, as well as Midtown Bay, the residential component of GuocoLand’s new
integrated development in the Bugis area. In the RCR segment, expected launches in 2H 2020 include Penrose by
City Developments and Forett @ Bukit Timah by Qingjian Realty.
www.fpafinancial.com 1115 August 2020
Increased pipeline supply at the end of Q2 2020
According to latest URA statistics, the total supply of uncompleted private residential units (excluding ECs) in the
pipeline with planning approvals that are expected for completion in 2H 2020-2024 increased by 0.5% q-o-q to
49,090 units from 48,868 units. Of the 49,090 units in the pipeline, 27,977 units remained unsold as at the end of
Q2 2020. Meanwhile, there was a total of 3,613 EC units in the pipeline, of which 1,899 units remained unsold.
Inclusive of ECs, the total pipeline supply with planning approvals was 52,703 units as at the end of Q2 2020. Of
which, 2,087 units are expected to be completed in 2H 2020; 12,932 units in 2021; 14,878 units in 2022; 18,129
units in 2023; 4,677 units in 2024. The data for pipeline supply of private residential units and ECs are
summarized in Exhibit 6.
Exhibit 6: Pipeline supply of private residential units and ECs (with planning approvals)
Source: URA
Private residential rentals declined in Q2 2020
According to URA, rentals of private residential properties across the whole island fell by 1.2% q-o-q in Q2 2020,
as represented by decrease in the residential rental index to 104.3 from 105.6, as shown in Exhibit 7.
Exhibit 7: Rental index of private residential properties (whole island)
Residential Rental Index
106.0 105.6
105.0
104.0 104.3
103.0
102.0
101.0
100.0
Q3 Q4 Q1 Q2 Q3 Q4 Q1 Q2 Q3 Q4 Q1 Q2
2017 2017 2018 2018 2018 2018 2019 2019 2019 2019 2020 2020
Source: URA, FPA Financial
www.fpafinancial.com 1215 August 2020
We further note a decline in the rental index of private residential properties across all the individual submarkets.
A summary of the residential rental index for the individual submarkets is shown in Exhibit 8.
Exhibit 8: Residential rental index for the individual submarkets
Rental Index
Category Q1 2020 Q2 2020 q-o-q change
All Residential 105.6 104.3 -1.2%
Landed property 94.6 92.4 -2.3%
Non-landed property 107.1 105.9 -1.1%
CCR (1) 105.6 105.0 -0.6%
(2)
RCR 110.1 108.0 -1.9%
OCR (3) 105.5 104.6 -0.9%
(1) Core Central Region (CCR) comprises Postal Districts 9, 10, 11, Downtown Core Planning Area and Sentosa
(2) Rest of Central Region (RCR) comprises area within Central Region that is outside those covered by CCR
(3) Outside Central Region (OCR)
Source: URA, FPA Financial
In Q2 2020, rentals of landed properties fell by 2.3% q-o-q, as represented by the decrease in the landed
property rental index to 92.4 from 94.6. Rentals of non-landed properties fell by 1.1% q-o-q as the rental index
fell to 105.9 from 107.1. In the submarkets for non-landed properties, on a q-o-q comparison, the rental index fell
by 0.6%, 1.9% and 0.9% for the Core Central Region (CCR), Rest of Central Region (RCR) and Outside Central
Region (OCR), respectively. A map representation demarcating the individual submarkets is as shown in
Appendix II.
Vacancy rate remained stable in Q2 2020
As at the end of Q2 2020, the total available stock of completed private residential units in Singapore decreased
marginally by 173 units to 374,752 units from 374,925 units as at the end of Q1 2020, as shown in Exhibit 9. Of
which, 354,590 units were occupied, leaving a remainder of 20,162 vacant units. The total number of completed
private residential units that were occupied as at the end of Q2 2020 was effectively unchanged from the end of
Q1 2020. This resulted in a marginal decline of 0.8% in the number of completed private residential units that
were vacant to 20,162 as the end of Q2 2020. As such, the vacancy rate, as measured by the total number of
vacant units over the total available stock of units in the market, remained stable at 5.4% as at the end of Q2
2020.
Exhibit 9: Stock and vacancy in the private residential market as at end of Q2 2020
Completed units As at Q1 2020 As at Q2 2020 Absolute change % change
Available 374,925 374,752 -173 0.0%
Occupied 354,603 354,590 -13 0.0%
Vacant 20,322 20,162 -160 -0.8%
Vacancy rate (%) 5.4 5.4 0.0 n/a*
*n/a: not applicable
Source: URA, FPA Financial
www.fpafinancial.com 1315 August 2020 RESIDENTIAL REAL ESTATE SECTOR MARKET OUTLOOK Pent-up demand could boost residential sales in 2H 2020 Owing to the COVID-19 outbreak, private residential sales were weaker in Q2 2020 compared to the previous quarter. This can be attributed to the closure of residential showflats and deferred launch dates by developers due to the implementation of the Circuit Breaker measures. Moving forward into 2H 2020, we expect developers to launch projects that were previously delayed, and thus there may be a pickup in residential sales. We note from the Business Times (BT) that foreign demand decreased in Q2 2020, partly due to risk aversion following the drastic sell-off in global stock markets in March. However, new launches in 2H 2020 could potentially benefit from renewed foreign demand, especially from Chinese nationals. Further, Singapore’s status as a safe-haven market could expedite the rebound in foreign residential investments. Residential capital values to correct in 2020 Looking ahead, we note from CBRE that developers could be more competitive in their pricing, given the slew of projects that are expected to be launched in Q3 2020 and unsold inventory. We further note that CBRE expects a larger price correction in 2H 2020 amidst slower economic growth and its latest forecast predicts residential prices to correct by 5% to 8% for the whole of 2020. Similarly, we note from Knight Frank’s latest report that the URA non-landed price index is likely to drop by about 5% for 2020, given recessionary pressures affecting many sectors of the economy. www.fpafinancial.com 14
15 August 2020

Retail
In this retail real estate sector overview, we will first provide a market snapshot on the Q2 2020 performance of
key indicators for the retail real estate sector market in Singapore. We will then provide a detailed market
update to further discuss developments in Q2 2020. Lastly, we will provide a market outlook for 2020.

RETAIL REAL ESTATE SECTOR MARKET SNAPSHOT
According to the Urban Redevelopment Authority (URA), the retail price index and retail rental index
experienced quarter-on-quarter (q-o-q) declines of 1.5% and 3.5% respectively in Q2 2020, as shown in
Exhibit 1. Over the quarter, retail pipeline supply increased by 1.7% and the vacancy rate rose by 1.6
percentage points.

On a year-on-year (y-o-y) basis, the retail price index and retail rental index fell by 1.8% and 1.3% respectively
in Q2 2020. In the quarter, retail pipeline supply expanded by 13.8% y-o-y and the vacancy rate rose by 1.9
percentage points from Q2 2019.

Exhibit 1: Key indicators for Singapore’s retail market

                                        % change in Q2 2020
Key indicators                           q-o-q             y-o-y      Q2 2020             Q1 2020         Q2 2019
Price index                              -1.5%             -1.8%        108.8              110.5           110.8
Rental index                             -3.5%             -1.3%        95.2               98.7            96.5
Pipeline supply in GFA ('000 sqm)        1.7%              13.8%         364                358            320
Vacancy rate                          1.6% points     1.9% points       9.6%               8.0%            7.7%
Source: URA, FPA Financial

RETAIL REAL ESTATE SECTOR MARKET UPDATE

Retail rentals declined in Q2 2020

According to URA, retail rentals in the Central Region fell by 3.5% q-o-q in Q2 2020, as indicated by a fall in the
retail rental index to 95.2 from 98.7, as shown in Exhibit 2.

Exhibit 2: Rental index of retail space in Central Region

                                     Retail Rental Index

 102.0
 100.0
                                                                           98.7
  98.0
  96.0
  94.0                                                                            95.2
  92.0
          Q3   Q4   Q1   Q2   Q3   Q4   Q1   Q2   Q3   Q4   Q1   Q2
         2017 2017 2018 2018 2018 2018 2019 2019 2019 2019 2020 2020

Source: URA, FPA Financial

www.fpafinancial.com                                                                                                  15
15 August 2020 We note from the latest report by Knight Frank that island-wide prime retail rents fell by 5.4% q-o-q to average S$28.90 per square foot per month (psf pm) in Q2 2020, as shown in Exhibit 3. In particular, prime retail rents in the Orchard and suburban areas fell by 5.0% q-o-q and 5.6% q-o-q respectively in Q2 2020. Exhibit 3: Average gross rents of prime retail spaces* in Q2 2020 *Prime spaces refer to rental-yielding units between 350 and 1,500 sq ft with the best frontage, connectivity, footfall and accessibility in a mall, typically located on the ground level of a retail mall and/or basement level of a retail mall that is linked to an MRT station or bus interchange. Source: Knight Frank Similarly, we also note from latest reports by Cushman & Wakefield (C&W) and CBRE that prime retail rents declined in Q2 2020. Latest data from C&W show that in Q2 2020, prime retail rents across the whole of Singapore fell by 1.7% q-o-q to S$26.79 psf pm. In the Orchard and suburban areas, prime retail rents declined by 1.5% and 0.9% to S$34.73 psf pm and S$20.88 psf pm, respectively. Meanwhile, latest CBRE data also note a quarterly decline in island-wide prime retail rents of 1.8% q-o-q in Q2 2020, while that for the Orchard and suburban areas had fallen, on a q-o-q basis, by 1.9% and 0.5% to S$31.05 psf pm and S$29.00 psf pm, respectively. www.fpafinancial.com 16
15 August 2020

Retail capital value fell in Q2 2020

According to URA, the retail price index for the Central Region declined by 1.5% to 108.8 in Q2 2020 from 110.5
in Q1 2020, as shown in Exhibit 4.

Exhibit 4: Property price index of retail space in the Central Region

                                              Retail Price Index

 115.0
 114.0
 113.0
 112.0
 111.0
 110.0
 109.0                                                                                   110.5
 108.0                                                                                               108.8
 107.0
 106.0
           Q3      Q4     Q1     Q2     Q3       Q4      Q1         Q2      Q3     Q4     Q1          Q2
          2017    2017   2018   2018   2018     2018    2019       2019    2019   2019   2020        2020

Source: URA, FPA Financial

Separately, we note from the latest report by Jones Lang LaSalle (JLL) that retail capital value registered a drop
of 6.5% in Q2 2020 for the prime sub-market, with capital value registering S$9,507 psf of net lettable area (NLA).
Meanwhile, CBRE noted a decline in prime retail capital value to S$6,400 in Q2 2020.

Some major retail property transactions were reported in Q2 2020. These included the sale of retail strata lots at
the former Chevron House owned by Oxley Holdings, which were sold to Siriti R Pte Ltd for S$192.7 million.

Increased vacancy as supply absorption weakened in Q2 2020

In Q2 2020, the total supply of retail space increased marginally by 0.1% to 6.219 million sqm from 6.215 million
sqm in Q1 2020, as shown in Exhibit 5. Meanwhile, the total amount of occupied retail space fell by 1.6% to
5.625 million sqm as at the end of Q2 2020. As a result, the vacancy rate for the retail market rose by 1.6% points
to 9.6%.

Exhibit 5: Stock and vacancy in the retail market as at end of Q2 2020

Completed retail space             As at Q1 2020            As at Q2 2020           Absolute change            % change
Available ('000 sqm)                    6,215                       6,219                        4               0.1%
Occupied ('000 sqm)                     5,718                       5,625                    -93                 -1.6%
Vacant ('000 sqm)                        497                         594                     97                  19.5%
Vacancy rate (%)                         8.0                         9.6                     1.6                  n/a*
*n/a: not applicable
Source: URA, FPA Financial

www.fpafinancial.com                                                                                                      17
15 August 2020 Expanded pipeline supply at the end of Q2 2020 Currently, the expected total supply of retail space coming from to-be-completed projects over the next few years grew by 1.7% q-o-q to a total of 364,000 sqm in gross floor area (GFA). An additional supply of 24,000 sqm is expected to be completed in 2H 2020, as shown in Exhibit 6. In the coming years, new supply of 90,000 sqm is expected in 2021; 98,000 sqm in 2022; 63,000 sqm in 2023; 20,000 sqm in 2024. Beyond 2024, there is an expected completion of 69,000 sqm of retail space. Exhibit 6: Pipeline supply of retail space Source: URA We note from the latest report by C&W that the expected completion of significant retail projects in 2021 like the asset enhancement initiatives (AEI) at Shaw Plaza and I12 Katong, and the One Holland Village development by Far East Organisation would add an estimated total of about 29,719 sqm in NLA. Further, the expected completion of Woodleigh Mall in 2022, a joint venture project between Kajima Development Pte Ltd & Singapore Press Holdings Ltd, will provide an additional 18,757 sqm in NLA. Retail sales have declined sharply due to the COVID-19 outbreak Owing to the COVID-19 pandemic, Singapore’s retail sales performance in Q2 2020 was severely impacted. According to latest statistics by the Singapore Department of Statistics (DOS), the retail sales index decreased to 55.1 in April from 92.2 a year ago, as shown in Exhibit 7. This reflected a 40.3% y-o-y decline in retail sales in April. The retail sales decline in April came as the Circuit Breaker measures were implemented early in the month, which saw people confined within their homes and most retail malls and retail establishments being closed. Thus, this resulted in a drop in domestic retail spending. In the following month of May, where the full brunt of the Circuit Breaker measures was felt, the decline in retail sales deepened. The retail sales index decreased to 46.8 from 97.6 a year ago, reflecting a 52.1% y-o-y decline in retail sales. In June, however, retail sales performance improved due to the gradual lifting of the Circuit Breaker measures early in the month, which saw a reopening of retail malls and establishments and also greater footfall in retail malls. The retail sales index decreased to 66.3 in June from 91.8 a year ago, reflecting a milder 27.8% y-o-y contraction. As a whole, retail sales performance was still weak in Q2 2020. The retail sales index registered 56.1 for Q2 2020, down by about 40% compared to a year ago. www.fpafinancial.com 18
15 August 2020

Exhibit 7: Singapore’s monthly retail sales index

              120.0
                                              May 19: 97.6   Jun 19: 91.8
              100.0
                                                                                     Jun 20: 66.3
               80.0
Index level

                                            Apr 19: 92.2
               60.0
                                                                      Apr 20: 55.1
               40.0
                                                                                 May 20: 46.8
               20.0

                0.0
                        Jul-18

                        Jul-19
                      Jun-18

                      Jun-19

                      Jun-20
                      Apr 18
                      May-18

                      Nov 18

                      Apr 19
                      May-19

                      Nov 19

                       Jan-20

                      Apr 20
                      May-20
                       Jan-18
                      Feb-18
                      Mar-18

                      Mar-19
                      Aug-18
                      Sep 18

                      Dec-18
                       Jan-19
                      Feb-19

                      Aug-19
                      Sep 19

                      Dec-19

                      Feb-20
                      Mar-20
                       Oct 18

                       Oct 19
Source: DOS, FPA Financial

In terms of the retail sales breakdown, sales in industries involving the use of retail spaces, such as Department
Stores, Watches & Jewellery, and Wearing Apparel & Footwear experienced the steepest declines over the
second quarter. These industries were more severely impacted given retail store closures during the Circuit
Breaker period. In contrast, industries involving the sale of food and necessities, such as Mini-marts &
Convenience Stores and Supermarkets & Hypermarkets, experienced sales growth over the second quarter.
This was attributed to the fact that the firms in these industries were able to continue operations and there was
continued demand for groceries. The data for the breakdown of retail sales in terms of industry for April, May
and June are summarized in Exhibit 8.

Exhibit 8: Retail sales breakdown in terms of industry

                                                                     y-o-y change in sales
Industry                                                     April            May                   June
Computer & Telecommunications Equipment                       -1.4            -21.3                  20.9
Cosmetics, Toiletries & Medical Goods                        -46.2            -49.0                 -33.1
Department Stores                                            -84.6            -93.4                 -69.5
Food & Alcohol                                               -53.4            -58.0                 -45.7
Furniture & Household Equipment                              -37.9            -64.2                 -19.9
Mini-marts & Convenience Stores                               10.7              9.1                   8.7
Motor Vehicles                                               -77.0            -85.7                 -47.8
Optical Goods & Books                                        -64.5            -81.9                 -39.4
Petrol Service Stations                                      -47.7            -58.2                 -33.6
Recreational Goods                                           -63.4            -74.2                 -40.7
Supermarkets & Hypermarkets                                   74.6             56.1                  43.4
Watches & Jewellery                                          -87.8            -96.9                 -53.5
Wearing Apparel & Footwear                                   -85.3            -89.1                 -63.4
Source: DOS, FPA Financial

In value terms, retail sales in April, May and June amounted to approximately S$2.1 billion, S$1.8 billion and
S$2.6 billion respectively. Thus, total retail sales in Q2 2020 registered at about S$6.5 billion, which were down
by about 40% from a year ago.

www.fpafinancial.com                                                                                                 19
15 August 2020
Meanwhile, retail spending from the tourism sector have also dropped sharply due to fall in tourist arrivals, given
imposed travel restrictions. According to the Singapore Tourism Board (STB), Singapore’s international tourist
arrivals (IVA) fell by 99.95% y-o-y to 750 in April, as shown in Exhibit 9. The severe impact on tourism continued
to be felt in May as IVA declined further to 880. In June, however, IVA rebounded to 2,170, given a broad
stabilization of the virus situation. Still, IVA in June was 99.86% below the figure a year ago. As a whole, total IVA
in Q2 2020 was down 99.92% y-o-y.
Exhibit 9: Singapore’s international tourist arrivals –monthly and quarterly
IVA y-o-y change
Period 2020 2019 Absolute % y-o-y
April 750 1,596,690 -1,595,940 -99.95%
May 880 1,487,758 -1,486,878 -99.94%
June 2,170 1,551,781 -1,549,611 -99.86%
Q2 3,800 4,636,229 -4,632,429 -99.92%
Source: STB, FPA Financial
On further analysis, we note from the latest STB statistics that IVA from Singapore’s top markets had fallen
significantly, as shown in Exhibit 10.
Exhibit 10: Quarterly IVA from Singapore’s top markets
IVA Change in Q2 2020
Country Q2 2020 Q1 2020 Q2 2019 q-o-q y-o-y
Australia 86 204,152 275,769 -99.96% -99.97%
China 159 336,757 851,647 -99.95% -99.98%
India 295 170,437 447,057 -99.83% -99.93%
Indonesia 705 443,993 767,723 -99.84% -99.91%
Japan 192 122,270 181,059 -99.84% -99.89%
Source: STB, FPA Financial
The decline in IVA from the top markets, China and Indonesia, are of great concern. This is given that,
historically, these two countries combined make up close to 40% of Singapore’s total IVA annually, as shown in
Exhibit 11.
Exhibit 11: Proportion of total IVA from Singapore’s top markets
20%
Proportion of total IVA
15%
10%
5%
0%
2015 2016 2017 2018 2019
Australia China India Indonesia Japan
Source: STB, FPA Financial
www.fpafinancial.com 2015 August 2020
In terms of tourist receipts, China and Indonesia have been the top contributors to tourist receipts for
Singapore, as shown in Exhibit 12. In 2019, the combined spending by tourists from the two countries
contributed about one-quarter of total tourist receipts.
Exhibit 12: Proportion of total tourist receipts from Singapore’s top markets
2019
2018
2017
2016
2015
0% 2% 4% 6% 8% 10% 12% 14% 16%
Proportion of total tourism receipts
Japan Indonesia India China Australia
Source: STB, FPA Financial
www.fpafinancial.com 2115 August 2020 RETAIL REAL ESTATE SECTOR MARKET OUTLOOK Retail sales to remain subdued from weak domestic and tourist spending The retail sector in Singapore has been one of the hardest hit sectors by the COVID-19 pandemic. Total retail sales in Q2 2020, in value terms, were close to 40% lower compared to the same period last year. In response to COVID-19, the Singapore government has introduced S$92.9 billion in fiscal stimulus to support businesses and preserve jobs. This has helped to cushion the impact on the labour market. The overall unemployment rate stood at 2.9% in June after rising by 0.5% percentage points over the second quarter. Job losses were inevitable and retrenchments had more than doubled in Q2 2020 to 6,700 from 3,220 in Q1 2020. Recently, some companies in the aviation and aerospace industry, including Rolls Royce, Airbus, Pratt & Whitney, and Jetstar Asia, have cut, or announced plans to cut jobs in Singapore. In addition, we note that companies like Singapore Airlines and Sembcorp Marine have announced pay cuts for both management staff and employees. Against this backdrop, consumer spending is thus expected to decline, and people are likely to cut back on spending. We therefore envisage retail spending to remain subdued for the rest of the year. Meanwhile, on the tourism front, we note from STB that tourism receipts fell by 39% y-o-y in 1H 2020. Moving forward, there is likely to be little contribution, if any, from tourism to retail sales for the rest of the year. This is due to travel restrictions which are expected to remain in place. As an illustration, STB had earlier in the year projected a 25%-30% decline in tourist arrivals in 2020. Based on this projection, total annual IVA would register in a range of 13.4 million to 14.3 million in 2020, given total IVA of about 19.1 million in 2019. This is very unlikely now, as total IVA in 1H 2020 has only registered 2.7 million compared to 9.3 million in the same period last year. Against this backdrop, retail spending from both the domestic and tourism front are expected to remain weak in 2020. This could result in lower demand for retail spaces as businesses may close down due to weak sales volume. Thus, there is an indirect impact on retail rents as lower retail demand could force landlords to charge lower rents in order to retain and attract tenants. Retail rents to fall We have noted that there could be downward pressure on retail rents in Singapore, as lower retail demand causes landlords to face increasing pressure to retain and attract tenants. We also note from C&W that vacancies are expected to exert further downward pressure on retail rents. As a reference, in Q2 2020, the vacancy rate rose to 9.6% from 8.0% in the previous quarter, as shown in Exhibit 5. C&W said higher expected vacancies, lower footfalls, social distancing measures and economic uncertainties due to COVID-19 could result in a steeper fall in rent for the retail market in 2H 2020. For full-year 2020, C&W expects prime rents in the Orchard and suburban areas to fall by 10% and 5% respectively, as shown in Exhibit 13. Nonetheless, C&W noted that first-tier malls which are able to maintain high occupancy levels due to strong tenant profile could see rentals remaining firm. We also note from latest forecasts by Knight Frank that retail rents are to decline by a range of 10% to 15% in the coming months of 2020, given recessionary pressures and safe distancing measures. Exhibit 13: Prime retail rents Source: Cushman & Wakefield www.fpafinancial.com 22
15 August 2020

Limited supply to cushion a fall in retail rents

Looking ahead, we note that a limited future supply of retail spaces could help to cushion a decline in
retail rents. Based on latest CBRE estimates, Singapore’s 3.5-year average retail supply (from 2H 2020
to 2023) is expected to register 0.10 million sqm, or 1.06 million sqf, per annum (in NLA), as shown in
Exhibit 14. This is lower than the 5-year historical average (from 2015 to 2019) of 0.12 million sqm, or
1.37 million sqf, per annum. Future supply is thus expected to be limited. This may promote greater rental
stability and help to cushion the decline in rents. Further, rental rebates granted to tenants by landlords
through government relief measures have helped to offset the fall in retail rents.

Exhibit 14: Estimated gross new supply- excluding projects with NLA below 20,000 sq ft

Source: CBRE

www.fpafinancial.com                                                                                          23
15 August 2020

Appendix I

Source: URA

www.fpafinancial.com                    24
15 August 2020

Appendix II

Source: URA

www.fpafinancial.com                    25
15 August 2020

Disclosures/Disclaimers
This report is prepared for general circulation. It does not have regard to the specific investment
objectives, financial situation and the particular needs of any recipient hereof. Advice should be sought
from a financial adviser regarding the suitability of the investment product, taking into account the
specific investment objectives, financial situation or particular needs of any person in receipt of the
recommendation, before the person makes a commitment to purchase the investment product.

This report is confidential. This report may not be published, circulated, reproduced or distributed in
whole or in part by any recipient of this report to any other person without the prior written consent of
FPA Financial Corporation Pte Ltd (“FPA”). This report is not directed to or intended for distribution to or
use by any person or any entity who is a citizen or resident of or located in any locality, state, country or
any other jurisdiction as FPA may determine in its absolute discretion, where the distribution,
publication, availability or use of this report would be contrary to applicable law or would subject FPA
and its connected persons (as defined in the Financial Advisers Act, Chapter 110 of Singapore) to any
registration, licensing or other requirements within such jurisdiction.

The information or views in the report (“Information”) has been obtained or derived from sources
believed by FPA to be reliable. However, FPA makes no representation as to the accuracy or
completeness of such sources or the Information and FPA accepts no liability whatsoever for any loss
or damage arising from the use of or reliance on the Information. FPA and its connected persons may
have issued other reports expressing views different from the Information and all views expressed in all
reports of FPA and its connected persons are subject to change without notice. FPA reserves the right
to act upon or use the Information at any time, including before its publication herein.

  www.fpafinancial.com                                                                                          26
You can also read