Central London office analysis - Avison Young

Page created by Emily Wade
 
CONTINUE READING
Central London office analysis - Avison Young
Central London markets                                                                                                                                                  Contact

                                                    Charts

RESEARCH

Central
London
office
analysis
Q2 2019

 View >

OCCUPATIONAL MARKET
Central London take-up totalled 3.0 million sq ft for Q2 2019 which
was 12% above Q1 2019 and 19% above the 10-year average.

INVESTMENT MARKET
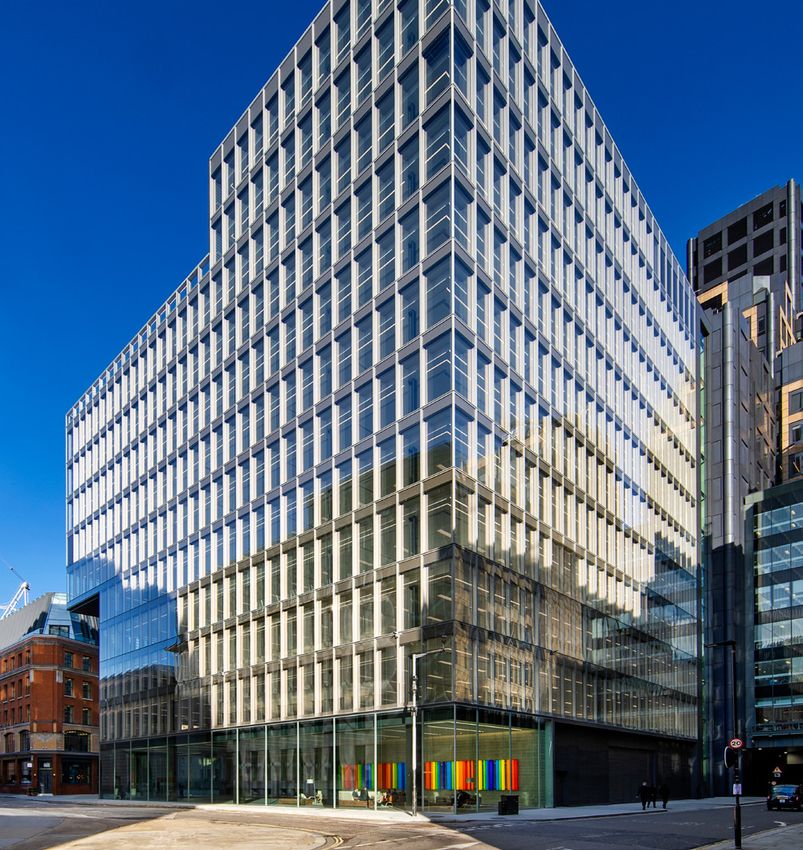
Q2 2019 investment volumes totalled £1.7 billion which was the lowest          Avison Young were appointed by Helical plc to project manage One Bartholomew Close, EC1 which reached completion in December 2018. The building is 215,000 sq ft of
quarter since Q1 2010 and 119% below the 10-year average.                      new grade-A office space arranged over 11 floors, plus ground floor and 2 levels of basement. Located in Farringdon, it is the centrepiece in the Barts Square development. The
                                                                               majority of the building is now let to a range of tenants including The Trade Desk and The University of Chicago Booth School of Business.
Central London office analysis - Avison Young
Occupier market        Central London map                   Central London markets                         Investment                 Investment commentary                             Investment data                        Contact

            Central London               Charts                                     West End                                      City                                    East London                                      Midtown

                                  Occupier market – in brief
                                  Q2 2019 saw strong leasing activity well above the long term average with take-up reaching 3.0 million sq ft in Central London, with strong performance across all
                                  London markets.

                                  Tenant demand was dominated by Financial Services, making up 30% of take-up                    Three deals were recorded in Q2 over 100,000 sq ft which were all prelets which is
                                  for the quarter. Serviced office take-up accounted for 15% of take-up for the quarter          simultaneously limiting supply in the development pipeline. Indeed, 25 Cannon Street,
                                  albeit there was a lack of larger serviced office deals with a fall in the average deal        EC4 was leased by Brewin Dolphin ahead of redevelopment starting and following a
                                  size to 23,000 sq ft, down 39% on the average size over the last two years. The largest        one and a half year search for suitable office premises.
                                  serviced office transaction was to WeWork at 133 Houndsditch, EC3 totalling 49,000 sq
                                                                                                                                 Furthermore, limited supply means tenants increasingly have to consider a wider range
                                  ft. The reduction in deal size is potentially an indication of an absence of larger leasing
                                                                                                                                 of locations to find office space. Rumoured interest in Soho Place, W1 from a tenant
                                  opportunities on the market.
                                                                                                                                 currently located in Mayfair reflects a lack of suitable availability in their historic location.
                                  Having said that, Q3 has already seen WeWork take a sublet of EMA’s 280,000 sq ft              In addition this also reflects the rising importance of overall quality of space and place
                                  building at Churchill Place, E14 following a court ruling that EMA would be unable to          in the war for talent.
                                  exit their lease on the grounds of frustration. Continued interest from serviced office
                                                                                                                                 The short term development pipeline is notably constrained with very little available
                                  operators in larger buildings reflects their ambition to attract larger corporate occupiers.
                                                                                                                                 space due for completion by the end of this year, a result of the strong preletting activity
JEREMY PROSSER                    In June, HSBC took 1,100 desks at WeWork’s Two Southbank Place, SE1 centre; following
                                                                                                                                 in 2017 and 2018. Although landlords are nervous about commencing new schemes,
Principal                         from Facebook’s acquisition of space at WeWork’s 125 Shaftesbury Avenue, WC2
                                                                                                                                 longer term construction activity has finally picked up with several new schemes now
                                  last year, both examples of serviced offices becoming a mainstream option for large
                                                                                                                                 fully underway including: 6-8 Bishopsgate, EC3, 80 Fenchurch Street, EC3, Kaleidoscope,
                                  corporates.
                                                                                                                                 EC1 and Bloom Clerkenwell, EC1.
                                  The TMT & Creative sector took a backseat for Q2 2019 accounting for just 7% of take-up
                                                                                                                                 Although demand continues to be very strong for the best stock, demand for units
                                  in Central London, down from 15% in Q1 2019 and 22% in Q4 2018. The fall in tech
Take-up continued to              demand may indicate the absence of a single large FAANG deal for Q2, or alternatively
                                                                                                                                 below 5,000 sq ft continues to fall off with smaller tenants increasingly turning to
be strongest for prime            the greater attractiveness of serviced office space to certain companies within the
                                                                                                                                 serviced office operators for their space requirements. As such, landlords are facing
office supply with                sector given the element of flexibility which can be essential to a fast growing company,
                                                                                                                                 extended void periods sometimes up to double what would usually be expected for
prelets accounting for                                                                                                           this type of space. In response, landlords are recalibrating their offering through their
                                  in addition to a trendier office environment.
                                                                                                                                 own bespoke plug and play solutions, often referred to as Cat A+; in addition to an
30% of all take-up for the
                                  By grade, traditional take-up continued to be strongest for prime office stock with            increasing number of landlord-owned serviced office providers. There are multiple
quarter and new existing
                                  prelets accounting for 30% of all take-up for the quarter and existing Grade A take-up         examples of Cat A+ solutions eroding the marketing void by over 50% with units also
stock accounting for a
                                  for a further 34%. This continues to be particularly evident in the larger size bands.         known to be achieving rental premiums and reducing incentives.
further 34%
Central London office analysis - Avison Young
Occupier market                     Central London map                       Central London markets                           Investment               Investment commentary                      Investment data              Contact

          Central London                                    Charts                                    West End                                     City                                   East London                           Midtown

Central London
                                                                                                                                                                                                         KEY STATS THIS QUARTER
TAKE-UP                                                         AVAILABILITY AND DEVELOPMENT                                           KEY DEALS - Q2 2019
Central London take-up totalled 3.0 million sq ft for           Availability fell to 10.1 million sq ft in Q2 2019 which                Address                      Occupier              Sq Ft         TOTAL TAKE-UP FOR Q2
Q2 2019, 12% above Q1 2019 and 19% above the                    was 23% down on Q1 2019 and 15% down on the 10-
10-year average. There were three transactions over             year average. The development pipeline continues to                     5 Bank Street, E14           EBRD                 365,000        3.0 million sq ft
100,000 sq ft during the quarter including EBRD’s               be somewhat subdued totalling 16.8 million sq ft in                     25 Cannon Street, EC4        Brewin Dolphin       114,388
acquisition of 365,000 sq ft at 5 Bank Street, E14.             Q2 2019, currently 49% prelet. The figure is an 8.5%
                                                                decline on Q1 2019 construction levels at which point                   Soho Place, W1               G-Research           102,600
Demand for Grade A space continues to remain strong             the pipeline was 46% prelet.                                            Westminster City Hall,       Parliamentary        95,963             19%
with prelets accounting for over 30% of all take-up for
                                                                                                                                        SW1                          Estates                             UP ON THE 10-YEAR QUARTERLY AVERAGE
the quarter, a considerable increase from 19% in Q1 2019.       Space under construction and due for delivery by the
In addition to the deal to EBRD, other significant prelets      end of 2019 totals 5.1 million sq ft, of which currently                Senator House, EC4           Quilter              93,827
included Brewin Dolphin & Co’s acquisition of 114,000 sq ft     75% is prelet. Occupiers are increasingly having to start
                                                                their search much earlier in order to find suitable space.
                                                                                                                                                                                                         4.7%
at 25 Cannon Street, EC4 and G Research’s acquisition of
103,000 sq ft at Soho Place, 1 Oxford Street, W1.               Buildings over 100,000 sq ft due for delivery by year end are
                                                                currently 85% prelet with just two developments available              TOP TENANT SECTORS                                                VACANCY RATE
The top performing sector overall was Financial Services        to tenants with requirements in excess of this level; 100
which accounted for 30% of the quarter’s take-up in 26          Bishopsgate, EC2 and Wenlock Works, N1.                                         Financial services                Serviced offices
deals. The next top performing sector, Serviced Offices,
was some way behind accounting for 15% of take-up in            In comparison, developments due for delivery post 2019                          30%                               15%
                                                                                                                                                                                                         UNDER CONSTRUCTION
18 deals. The largest serviced office deal of the quarter       total 11.8 million sq ft and are currently only 38% prelet. These

                                                                                                                                                                                                                    16.8 million sq ft
was to WeWork at 133 Houndsditch, EC3 who acquired              developments are continuing to see strong interest from
49,000 sq ft.                                                   tenants with Q2 prelets such as those to Reinsurance Group

Overall, serviced offices accounted for 440,000 sq ft of
                                                                of America (22 Bishopsgate, EC2), G-Research (Soho Place,
                                                                W1) and Smith & Williamson (Gresham St Pauls, EC2), further
                                                                                                                                                                                                                    49%
take-up in Q2 2019 which was 21% down on Q1 2019.                                                                                                                                                                   prelet
                                                                limiting availability due for delivery from 2020 onwards.
The largest acquirer of space was WeWork which acquired
130,000 sq ft across four deals, followed by Knotel which       RENTAL GROWTH
acquired 71,000 sq ft across five deals.                        Prime rents grew by 2% on a rolling annual basis
                                                                to Q2 2019 but are largely stable on a quarterly
                                                                basis. Marginal rental growth is expected in markets
                                                                that are seeing a more pronounced lack of supply
                                                                including City Core.
                                                                Prime City rents grew to £70.00 per sq ft for Q2 2019. Prime
                                                                West End rents are stable at £115.00 per sq ft. Rent free
                                                                periods remain stable at 24 months, decreasing slightly for
                                                                the best stock in the best locations, a trend which is likely
                                                                to continue into the near future.
Central London office analysis - Avison Young
Occupier market                   Central London map                 Central London markets                                    Investment                          Investment commentary                            Investment data                         Contact

       Central London                           Charts                                  West End                                                       City                                           East London                              Midtown

CENTRAL LONDON TAKE-UP                                                                                                           UNDER CONSTRUCTION
                                                                                       West End      East London                                                                                                                                   Completed           West End
  sq ft                                                                                                                             sq ft
                                                                                       City          10 year quarterly average                                                                                                                     East London         City
                                                                                                                                  12,000,000
4,000,000

3,500,000                                                                                                                         10,000,000

3,000,000
                                                                                                                                  8,000,000
2,500,000

2,000,000                                                                                                                         6,000,000

1,500,000
                                                                                                                                  4,000,000

1,000,000
                                                                                                                                  2,000,000
 500,000

          0                                                                                                                                 0
              12 12 12 13 13 13 13 14 14 14 14 15 15 15 15 16 16 16 16 17 17 17 17 18 18 18 18 19 19                                            2012          2013       2014          2015          2016      2017    2018   2019   2020            2021           2022
              Q2 Q3 Q4 Q1 Q2 Q3 Q4 Q1 Q2 Q3 Q4 Q1 Q2 Q3 Q4 Q1 Q2 Q3 Q4 Q1 Q2 Q3 Q4 Q1 Q2 Q3 Q4 Q1 Q2

OFFICE AVAILABILITY RATES                                                       City              East London                    PRIME RENTAL GROWTH                                                                                        City               Docklands
                                                                                West End          Central London                       %                                                                                                    West End           Central London
  %
                                                                                                                                   40
 14%

                                                                                                                                   30
 12%
                                                                                                                                   20
 10%
                                                                                                                                   10

  8%
                                                                                                                                   0

  6%
                                                                                                                                  -10

  4%
                                                                                                                                  -20

  2%                                                                                                                              -30

 0%                                                                                                                               -40
          2007     2008   2009    2010   2011   2012     2013   2014     2015   2016          2017         2018       2019          2009         2010            2011           2012          2013          2014      2015    2016      2017                2018           2019
Occupier market                     Central London map                     Central London markets                        Investment                 Investment commentary                   Investment data              Contact

          Central London                                  Charts                                  West End                                    City                                  East London                           Midtown

West End
                                                                                                                                                                                                   KEY STATS THIS QUARTER
TAKE-UP                                                       AVAILABILITY AND DEVELOPMENT                                        KEY DEALS - Q2 2019
West End take-up totalled 860,000 sq ft for Q2 2019           Availability fell to 3.3 million sq ft in Q2 2019 which              Address                    Occupier               Sq Ft         TOTAL TAKE-UP FOR Q2
which was down on Q1 2019 but up 3% on the 10-                was down on Q1 2019 by 18% and on the 10-year
year quarterly average. The largest West End deal of          average by 20%. The West End vacancy rate now
                                                                                                                                   Soho Place, W1             G-Research            102,600        860,000 sq ft
the quarter was to G-Research at Derwent London’s             stands at 3.57% which is the lowest it has been since                Westminster City Hall,     Parliamentary         95,963
Soho Place taking the building to 53% let ahead of its        mid-2016. Take-up of new and under construction                      SW1                        Estates
completion in 2022.                                           space made up 55% of all letting activity for Q2 2019
                                                              and therefore Grade A space is increasingly limited
                                                                                                                                   The Met Building, W1       WPP                   51,357             3%
The majority of take-up for the quarter was within the        with little new supply entering the market.                          Westworks, W12             Li & Fung             50,432         UP ON THE 10-YEAR QUARTERLY AVERAGE
Government and Services sector accounting for 17% of
take-up, largely due to Parliamentary Estates’ acquisition    The West End development pipeline currently comprises                                           Europe
of 96,000 sq ft at Westminster City Hall, SW1. The            5.1 million sq ft of space under construction, of which              40 Grosvenor Place, SW1    Liberty               37,200
                                                                                                                                                                                                   3.6%
Consumer and Private Services sector accounted for the        66% is currently prelet. This is down 12% on Q1 2019.                                           Commodities
second highest proportion of take-up at 16%. The largest      The pipeline is further constrained in buildings above
deal within this sector was Li & Fung’s acquisition of        100,000 sq ft where the total under construction is                                                                                  VACANCY RATE
50,000 sq ft at Westworks, White City, W12. Despite being     4.0 million sq ft and 80% is already prelet.
the second largest sector in Q1 2019, serviced offices                                                                            TOP TENANT SECTORS
accounted for just 80,000 sq ft of take-up in Q2 2019, 9%     RENTAL GROWTH
of the quarterly total compared to 20% last quarter.          West End rents grew by 0.7% on a rolling annual basis                                                                                UNDER CONSTRUCTION
                                                                                                                                          Government                       Consumer and
                                                              to Q2 2019 but were stable across the board quarter-                                                         Private Services
                                                                                                                                                                                                                5.1 million sq ft
By submarket, Victoria performed the best, recording                                                                                      and Services
190,000 sq ft of take-up for the quarter across nine deals,
                                                              on-quarter. The best Grade A stock continues to achieve
                                                                                                                                          17%                              16%
                                                              record rents with the record broken at 30 Berkeley Square
of which two were greater than 20,000 sq ft. Mayfair and
                                                              in April where Steadview Capital Management will pay                                                                                              66%
St James’s had a relatively weak quarter with 85,000 sq                                                                                                                                                         prelet
                                                              £250 per sq ft on 2,700 sq ft. Rent free periods are stable at
ft of take-up, which was 9% below the 10-year average.
                                                              24 months.
The largest Mayfair & St James’s deal was to Knotel at 130
Jermyn Street, SW1, acquiring 16,000 sq ft.

                                                                                                                                                                                                   £115 per sq ft
                                                                                                                                                                                                   PRIME RENT

                    Patrick O’Keeffe
                    Principal
                    +44 (0)20 7911 2768
                    pok@avisonyoung.com
Occupier market                    Central London map                      Central London markets                        Investment               Investment commentary                        Investment data              Contact

         Central London                                    Charts                                  West End                                   City                                     East London                           Midtown

City
                                                                                                                                                                                                      KEY STATS THIS QUARTER
TAKE-UP                                                        AVAILABILITY AND DEVELOPMENT                                       KEY DEALS - Q2 2019
City take-up reached 1.7 million sq ft for Q2 2019             City availability fell to 5.2 million sq ft in Q2 2019,             Address                     Occupier                 Sq Ft         TOTAL TAKE-UP FOR Q2
which was 22% above Q1 2019 and 14% above                      a significant drop on Q1 2019, largely due to
the 10-year average. There was a total of 92 deals             increasingly limited development supply and a lack
                                                                                                                                   25 Cannon Street, EC4       Brewin Dolphin          114,388        1.7 million sq ft
recorded which was a fall on Q1 during which 97                of new space on the market. The vacancy rate now                    Senator House, EC4          Quilter                 93,827
deals were recorded. Take-up was boosted by several            stands at 4.7%.
                                                                                                                                   Gresham St Pauls, EC2       Smith &                 86,795
larger deals including Brewin Dolphin’s acquisition
of 114,000 sq ft at 25 Cannon Street, EC4 and three            The City development pipeline currently stands at                                               Williamson                                 14%
further deals above 50,000 sq ft. Brewin Dolphin’s             9.8 million sq ft and is currently 36% prelet. Although the         Premier Place, EC2          Squire Patton           58,351         UP ON THE 10-YEAR QUARTERLY AVERAGE
acquisition was the first deal in the City this year over      City development pipeline saw several new starts in Q1                                          Boggs
100,000 sq ft, compared to four during H1 2018.                2019 including The Featherstone Building, EC1 totalling
                                                               125,000 sq ft and The Bailey, EC4 totalling 115,000                 133 Houndsditch, EC3        WeWork                  49,000

                                                                                                                                                                                                      4.7%
Financial Services was the largest acquirer of space in Q2     sq ft, the near term pipeline is still very constrained.
2019 accounting for 27% of all take-up for the quarter.        Development supply projected to complete by year end
There were 19 deals recorded within this sector and it         currently totals 2.6 million sq ft, of which 74% is currently                                                                          VACANCY RATE
was therefore also the top performing sector by number         prelet, leaving just 680,000 sq ft available.
                                                                                                                                  TOP TENANT SECTORS
of deals. Key Financial Services deals included those to
Brewin Dolphin and Quilter’s acquisition of 94,000 sq ft       RENTAL GROWTH
at Senator House, EC4. The second largest tenant sector        City rents grew by 3.5% on a rolling annual basis to Q2                    Financial services                   Serviced offices       UNDER CONSTRUCTION
for Q2 was Serviced Offices that accounted for 22% of          2019 with certain markets seeing rental growth due to                      27%                                  22%
take-up, of which the largest deal was to WeWork at            ongoing supply constraints. City Core rents increased to                                                                                            9.8 million sq ft
133 Houndsditch, EC3 taking 49,000 sq ft.                      £70.00 per sq ft, up from £67.50 per sq ft at the start of
Prelets continue to dominate City take-up accounting           the year but previously unchanged since Q1 2018. Other                                                                                              36%
                                                               submarkets to see rental growth included Clerkenwell,                                                                                               prelet
for 23% of take-up in Q2 2019 across seven deals, all of
which were over 20,000 sq ft. 91% of preletting activity       West City and Northern City; Clerkenwell rents in particular
in the City was within core City markets despite strong        grew to £72.50 per sq ft in Q2 2019, having increased 4%
availability elsewhere. In addition, new existing supply       to £70.00 per sq ft as recently as Q4 2018. Rent free periods
accounted for a further 40% of take-up for Q2 2019 in          are currently stable across all submarkets at 24 months.
the City.
                                                                                                                                                                                                      £70.00 per sq ft
                                                                                                                                                                                                      PRIME RENT

                     Jeremy Prosser
                     Principal
                     +44 (0)20 7911 2865
                     jeremy.prosser@avisonyoung.com
Occupier market                      Central London map                      Central London markets                       Investment                 Investment commentary                 Investment data              Contact

          Central London                                    Charts                                 West End                                     City                               East London                           Midtown

East London
                                                                                                                                                                                                  KEY STATS THIS QUARTER
TAKE-UP                                                          AVAILABILITY AND DEVELOPMENT                                      KEY DEALS - Q2 2019
East London take-up continues to grow reaching                   Availability dropped to 1.6 million sq ft in Q2 2019               Address                      Occupier           Sq Ft         TOTAL TAKE-UP FOR Q2
470,000 sq ft for Q2 2019, 90% above the 5-year                  reflecting a vacancy rate of 7.3%, down on Q1 2019
average. This is the highest level of take-up recorded           by 49%. Prior to Q2 2019, the space at 5 Bank Street
                                                                                                                                    5 Bank Street, E14           EBRD              365,000        470,000 sq ft
since Q4 2010, and was largely due to EBRD’s                     made up 18% of total availability on the market.                   Import Building, E14         Anglia Ruskin     32,762
acquisition of 365,000 sq ft at 5 Bank Street, E14               Following the letting of the remainder of the                                                   University
which has taken the building to fully let ahead of its           building, availability in the East London market has
completion in late 2019. That single deal accounted              dropped significantly.                                             Columbus Building, E14       Revolut           24,016             90%
for 77% of East London take-up and there were an                                                                                    15 Westferry Circus, E14     PKF Littlejohn    21,684         UP ON THE 5-YEAR QUARTERLY AVERAGE
additional five deals during the quarter with an                 The East London under construction pipeline currently
average size of 21,000 sq ft.                                    comprises 1.9 million sq ft of which a high proportion             5 Greenwich View Place,      Tower Hamlets     16,760
                                                                 at 69% is currently prelet. Despite a large proportion
                                                                                                                                    E14
                                                                                                                                                                                                  7.3%
All take-up for the quarter was within the Canary Wharf          of prelet space in the East London pipeline, there is a
submarket. Low take-up in Stratford reflects currently           significant level of space currently within the planning
limited availability of which the majority is at International   pipeline including 10 Bank Street, E14 totalling nearly                                                                          VACANCY RATE
Quarter which requires a prelet before commencement.             800,000 sq ft and additional sites at Wood Wharf including
The interest in the Canary Wharf office market is                The Frameworks and 7 Charter Street, E14 that together
largely the result from discounted rents with improved           will offer almost 400,000 sq ft to the market.                    TOP TENANT SECTORS
connectivity also playing a part in its greater appeal as an                                                                                                                                      UNDER CONSTRUCTION
office market. EBRD for example will be relocating from          RENTAL GROWTH                                                                                               Government
                                                                                                                                            Financial Services
                                                                                                                                                                                                               1.9 million sq ft
                                                                                                                                                                             & services
155 Bishopsgate, EC2 on completion of its HQ in Q3 2019.         East London saw no rental growth on a rolling annual basis                 83%                              11%
                                                                 relative to Q2 2019 with Canary Wharf rents currently stable
Since the start of Q1 2019, Financial Services have
accounted for the vast majority of take-up in East London        at £42.50 per sq ft and Stratford rents at £45.00 per sq ft.                                                                                  69%
                                                                 Rent free periods are unchanged at 24 months.                                                                                                 prelet
at 68%. The rise in proportion of Financial Servivces
take-up to 83% for Q2 2019 is mostly due to EBRD’s
acquisition of 365,000 sq ft at 5 Bank Street, the largest
deal of the quarter. By number of deals, Financial Services
is still top, but closely followed by the Manufacturing and
Industry and Government and Services sectors that each
accounted for 23%.
                                                                                                                                                                                                  £42.50 per sq ft
                                                                                                                                                                                                  PRIME RENT

                      Alasdair Gurry
                      Director
                      +44 (0)20 7911 2831
                      alasdair.gurry@avisonyoung.com
Occupier market                     Central London map                    Central London markets                        Investment               Investment commentary                      Investment data              Contact

          Central London                                  Charts                                  West End                                   City                                   East London                           Midtown

Midtown
                                                                                                                                                                                                   KEY STATS THIS QUARTER
TAKE-UP                                                       AVAILABILITY AND DEVELOPMENT                                       KEY DEALS - Q2 2019
Midtown take-up totalled 420,000 sq ft for Q2 2019            Midtown availability was unchanged on Q1 2019                       Address                      Occupier              Sq Ft         TOTAL TAKE-UP FOR Q2
which was 22% above the 5-year average and 29%                at 960,000 sq ft. Despite strong letting activity,
above Q1 2019. The largest deal of the quarter was            380,000 sq ft of new supply was added to the market
                                                                                                                                  Senator House, EC4           Quilter               93,827        420,000 sq ft
to Quilter at Senator House, EC4 where the wealth             in Q2 which prevented a fall in vacancy. The vacancy                1 Bartholomew Close,         University of         43,245
manager acquired 94,000 sq ft. In comparison to Q1            rate currently stands at 2.7%.                                      EC1                          Chicago Booth
2019 where no deals were recorded over 30,000 sq ft,
Q2 has seen three deals above this figure. By number          The under construction development pipeline comprises               35 Farringdon Street, EC4    Law Business          41,214            22%
of deals, however Q2 2019 was down slightly on Q1             1.1 million sq ft, of which 28% is currently prelet to                                           Research
                                                                                                                                                                                                   UP ON THE 5-YEAR QUARTERLY AVERAGE
with 23 deals recorded, compared with the 28 deals            tenants such as Live Nation at the Farmiloe Building,
                                                                                                                                  50 Chancery Lane, WC1        ETC Venues            28,491
in the first quarter of this year.                            EC1 and Deloitte Digital at Athene Place, EC4. Although
                                                              there is 780,000 sq ft of available development stock               20 Farringdon Road, EC4      Indeed.com            25,134

                                                                                                                                                                                                   2.7%
In line with the rest of Central London, Financial Services   on the market, the majority is within developments
was the largest acquirer of space accounting for 27% of       under 100,000 sq ft with just two developments
the total. The Business Services sector followed behind in    offering in excess of this level: Bloom Clerkenwell                                                                                  VACANCY RATE
second place accounting for 17% of take-up from which         totalling 135,000 sq ft and Charterhouse Place totalling
the largest deal was at 35 Farringdon Street, EC4 totalling   170,000 sq ft.
                                                                                                                                 TOP TENANT SECTORS
41,000 sq ft to Law Business Research. The majority of
Midtown take-up was contained within the Clerkenwell          RENTAL GROWTH                                                                                                                        UNDER CONSTRUCTION
submarket where 46% of the quarter’s activity was based       Midtown prime rents are currently stable at                                 Financial services                Business services
and an increase of 45% on Q1 2019.                            £66.50 per sq ft, having undergone rental growth at the                     27%                               17%                                 1.1 million sq ft
                                                              end of 2018. With limited Grade A supply, pressure on
                                                              rents will continue and rents are therefore likely to rise in                                                                                     28%
                                                              the future.                                                                                                                                       prelet

                                                                                                                                                                                                   £66.50 per sq ft
                                                                                                                                                                                                   PRIME RENT

                     Nick Rock
                     Principal
                     +44 (0)7046 6517
                     nick.rock@avisonyoung.com
Occupier market                  Central London map               Central London markets                                  Investment                   Investment commentary                     Investment data             Contact

   Central London                          Charts                                    West End                                                  City                          East London                                Midtown

Central London map
West End
City                                                                                                                                                                                                           Stratford
East London
Parks                                                                                          Camden

                                                                                                                      King’s
                                                                                                                      Cross                                                      West City
                                                                                     Regent’s
                                                                                       Park              Euston                                        Shoreditch/               Northern City
                                                                                                                                                       Spitalfields

                                                                                                                                     Clerkenwell
                                                                                                                      Bloomsbury

                                                                                Marylebone           Fitzrovia
                                                                   Paddington                                                                                                Aldgate –
                                                                                                                                    Chancery          City
                                                                                                                                      Lane            Core                  Whitechapel
                                                                                                               Soho       Covent                                      EC3
                                                                                               Mayfair                    Garden

                    White City
                                                                  Hyde Park                                 St James’s

                                                                                                                                                   London Bridge                                            Canary
                                                                                                Green Park/
                                                                                                 St James’s
                                                                                                                                   Waterloo                                                                 Wharf

                                                     Kensington                 Belgravia/
                                                                              Knightsbridge               Victoria
                                                                                                           Victoria                                                                                          Fringe
                            Hammersmith
                                                                                                                                                                                                            Docklands

                                                                  Chelsea

                                                                                   Battersea
                                                                                     Park
                                            Fulham
                                                                                Vauxhall/Battersea
Occupier market                  Central London map                Central London markets                 Investment                 Investment commentary                 Investment data                 Contact

           Central London                          Charts                             West End                                 City                              East London                           Midtown

Central London markets
 West End                   Prime headline rent   Rent free period   Business rates   Total occupancy costs      City                      Prime headline rent     Rent free period   Business rates   Total occupancy costs
                                (£ per sq ft)        (months)         (£ per sq ft)         (£ per sq ft)                                      (£ per sq ft)          (months)         (£ per sq ft)         (£ per sq ft)
Mayfair                           £115.00               24               £48.75              £174.00           City Core                         £70.00                  24               £25.75              £106.00
St James's                        £115.00               24               £46.50              £171.75           Clerkenwell                       £72.50                  24               £23.25              £106.00
Soho                              £95.00                24               £41.50              £146.75           West City                         £70.00                  24               £25.75              £106.00
Belgravia / Knightsbridge         £92.50                24               £39.50              £142.25           Holborn                           £66.50                  24               £27.75              £104.50
Chelsea                           £95.00                22               £37.00              £142.25           EC3                               £67.50                  24               £26.50              £104.25
North of Oxford St                £85.00                24               £39.50              £134.75           London Bridge                     £65.00                  24               £26.00              £101.25
Kensington                        £72.50                22               £44.00              £126.75           Waterloo                          £67.50                  24               £22.75              £100.50
Fitzrovia                         £82.50                24               £33.75              £126.50           Northern City                     £67.50                  24               £19.75               £97.50
Covent Garden                     £85.00                24               £30.00              £125.25           Shoreditch/Spitalfields           £65.00                  24               £18.00               £93.25
King's Cross                      £80.00                24               £31.50              £121.75           City Tower                        £80.00                  24                                    £90.25
Victoria                          £77.50                24               £33.50              £121.25           Aldgate/Whitechapel               £57.50                  24               £20.00               £87.75
Bloomsbury                        £80.00                24               £30.25              £120.50
Euston                            £75.00                24               £27.75              £113.00             East London               Prime headline rent     Rent free period   Business rates     Total occupancy
Paddington                        £75.00                24               £26.75              £112.00                                           (£ per sq ft)          (months)         (£ per sq ft)     costs (£ per sq ft)
Camden                            £60.00                24               £26.75              £97.00            Canary Wharf                      £42.50                  24               £12.75               £65.50
Battersea PS                      £60.00                24               £15.25              £85.50            Stratford                         £45.00                  24               £8.50                £63.75
Hammersmith                       £52.50                24               £21.00              £83.75            Other Docklands                   £32.50                  24               £10.00               £52.75
Vauxhall                          £58.00                24               £15.25              £83.50
Fulham                            £47.50                24               £20.00              £77.75
White City                        £55.00                24               £8.50               £73.75
Occupier market        Central London map                   Central London markets                       Investment                    Investment commentary                         Investment data               Contact

            Central London               Charts                                    West End                                       City                                       East London                         Midtown

                                  Investment market – in brief
                                                                                                                                                                                  KEY STATS THIS QUARTER
                                  H1 INVESTMENT VOLUMES SLUMP                                         Whilst H1 was subdued, early evidence suggests H2 2019 will be
                                  Q2 saw less than £1.7 billion transact across Central London, the   more positive with over £850 million of transactions exchanging             TRANSACTION VOLUMES
                                  lowest quarterly investment volume since 2010 and significantly     in the first three weeks of July. There is currently a further £1.4
                                  down on the corresponding period last year where transaction        billion also under offer.                                                   £1.7 billion
                                  volumes reached around £5.8 billion. The half year total of £3.2    MIXED PROSPECTS FOR UK FUNDS
                                  billion is also over 100% down on the £9 billion transacted in
                                  H1 2018. Whilst economic and political uncertainties are key        Unlike the first quarter, where UK Funds were net sellers, this
                                                                                                      quarter it was more mixed with 29 of the 37 transactions during
                                                                                                                                                                                         119%
                                  issues, investors are contending with, the continuing lack of
                                                                                                      the quarter involving UK Funds, 13 of these buying and 16                   DOWN ON THE 10-YEAR AVERAGE
                                  supply which has been the main driver for a more subdued
                                  investment market. There is currently only £1.5 billion of          selling. Key buy transactions include RLAM acquisition of 25 Soho
                                  investment currently being openly marketed, many of which           Square, W1 for £75 million, Clearbell’s acquisition of 65 Kingsway,
                                  continue to be concentrated in large lot sizes, such as 21 St       WC2 for £59 million and CCLA’s acquisition of Palace House, SE1             VOLUMES BY CITY
                                  James’s Square, SW1 (£200 million) or been lingering on the         for £48 million. Whilst key sales include M&G’s sale of 15 Regent
                                                                                                                                                                                  CITY              WEST END             EAST LONDON
                                  market, such as 1 Lyric Square, W6 (£105 million), The Epworth,     Street, W1 and 10 Noble Street, EC2, Aviva Inventors sales of
CHRIS GORE                        EC2 (£78 million) and Plantation Place South (£159 million). The    25 Soho Square, W1 and 4 Matthew Parker Street, SW1 and                     £631              £869                 £156
Principal                         lack of openly marketed investments has made many investors         Schroders sales of 12 Appold Street, EC2 and Palace House, SE1.
                                                                                                      Many of these sales are driven by increased liquidity pressures
                                                                                                                                                                                  million           million              million
                                  pursue off market opportunities, which made up a third of
                                  the total investment volumes for Q2, including the sales of 30      among the funds, in the wake of the on-going redemptions
                                  South Colonnade and 10 Noble Street, two of the three largest       issue. This has proved to be a key concern for the Bank of
                                  investment transactions for the quarter.                            England and FCA, who launched a scathing review of the £1.2                 VOLUMES BY INVESTOR TYPE
Whilst H1 was subdued,                                                                                trillion open-ended fund market last Thursday, in the publication
early evidence suggests           H2 PROJECTIONS MORE POSITIVE                                        of its latest financial stability report.
H2 2019 will be more              In spite of the political uncertainty, investor sentiment remains
positive with over £850                                                                               RENEWED HK INVESTMENT IN UK
                                  positive with competitive bidding on many properties that have
million of transactions           come to the market, particularly value add investments, given       Hong Kong investors have showed renewed interest in the
                                                                                                                                                                                  OWNER             OVERSEAS             UK PROPERTY
exchanging in the first           the favourable occupational market dynamics. Across all lot         form of increased investment activity in the second quarter of              OCCUPIER          INVESTORS            COMPANIES
three weeks of July.                                                                                  the year, something distinctively lacking over the first quarter
                                  sizes we are seeing a broad and diverse range of capital chasing
                                                                                                      of the year. We expect would be buyers to shrug off concerns                £287              £743                 £625
                                                                                                                                                                                  million           million              million
                                  value add opportunities. Paxton House and 23 Essex Street are
                                  examples of sub £15 million lots which collectively had over 100    over Brexit, as they look back towards the safe havens in London,
                                  inspections and received over 20 bids, before going significantly   whilst anxieties build over political tensions in their own country.
                                  ahead of asking price. 280 Bishopsgate, at the larger end of the    We expect a number of core assets including 8 Finsbury Circus
                                                                                                      and 21 St James’s Square to receive strong interest from Hong
                                  spectrum, received extensive interest from a range of Funds,
                                  PE investors, Prop Cos, REITs and Privates, with multiple offers    Kong investors, as cheap sterling (amid Brexit) and political               3.50%                      4.25 %
                                  received ahead of asking in the first round and competitive         uncertainties in their home market present the perfect storm for            WEST END PRIME YIELD         CITY PRIME YIELD
                                  tensions pushing pricing significantly ahead of this level in the   this prolific buyer group to return.
                                  second round.
Occupier market                     Central London map                        Central London markets                     Investment                  Investment commentary                Investment data                    Contact

     Central London                                  Charts                                   West End                                      City                         East London                                 Midtown

Investment commentary
Q2 2019 investment volumes totalled £1.7 billion which was the lowest quarter since Q1 2010 and 119% below the 10-year average. Although
volumes were down on Q1 2019 by 67%, there were 37 deals recorded for the quarter, only slightly below the 38 deals recorded in Q1 2019;
instead the difference in investment volumes was accounted for by the Q1 acquisition of 25 Canada Square, E14 by Citi Group for £1.1 billion,
4.23% NIY.
Investment volumes fell in all London submarkets on their respective             Paddington was the best performing submarket in Q2 2019 recording
averages with City market volumes falling most dramatically, down 208%           £220.5 million of investment although largely the result of a single deal at
on the 10-year average to £631 million for Q2 2019. In total there were          55 North Wharf Road. St James’s was the next best performing submarket
20 transactions recorded in the City market in Q2, which was just 47%            by investment volumes with £200 million worth of transactions recorded
down on the average. The largest deal of the quarter was Property Reserve        across three separate deals, in line with Covent Garden which also
Inc’s acquisition of 10 Noble Street, EC2, for £103.8 million. In comparison     recorded three deals and investment volumes of £91.5 million.
2018 saw 24 deals above this level in the City alone.
                                                                                 East London investment volumes fell 116% on the 10-year average to £156
The majority of purchaser activity in the City market was made up by             million for Q2 2019. By number of deals, East London performed in line
overseas investors who accounted for 58% of total volumes, mostly in line        with the average with two deals transacted, also the same as last quarter.
with proportions from previous quarters. Interestingly, owner occupation         The largest deal was Cindat Capital Management’s acquisition of 30 South
investment volumes reached £94.8 million in Q2 2019, 54% above the 10-           Colonnade, E14 for £135 million.
year average and accounting for 15% of all City investment for the quarter.
                                                                                 YIELDS
UK purchasers made up the remainder at 27%.
                                                                                 Prime yields were stable in Q2 2019 at 4.25% in the City and 3.50% in the
West End investment volumes totalled £869 million in Q2 2019 with                West End.
15 deals recorded. Whilst volumes fell 63% on the 10-year average
and it being the lowest Q2 since 2011, the performance in Q2 was an
improvement on Q1 2019, rising 109% by total volumes and 50% by
number of deals. The largest deal of the quarter was Brockton’s acquisition      By purchaser type, UK investors made up the
of 35 North Wharf Road, W2 for £220.5 million which was the largest deal         majority in the West End in Q2 2019 at 53%.
of the year so far but surpassed by seven larger deals in 2018.                  Interestingly, overseas investors made up just
By purchaser type, UK investors made up the majority in the West End in          25% in Q2 2019, the lowest proportion of overseas
Q2 2019 at 53%. Interestingly, overseas investors made up just 25% in Q2         investment since Q2 2006
2019, the lowest proportion of overseas investment since Q2 2006. Owner
occupation in the West End reached £192.5 million in Q2 2019 which was
193% above the 10-year average and accounted for 22% of all West End
investment for the quarter.

                                                                                                                                                                  Avison Young advised a private Spanish investor on the off market
                                                                                                                                                                  acquisition of 9-12 King Street, EC2 for £18.5 million, 4.00% NIY
Occupier market                      Central London map                                 Central London markets                       Investment                                             Investment commentary                                                                                     Investment data                                                                    Contact

               Central London                                         Charts                                        West End                                                   City                                                                                                East London                                                                            Midtown

CENTRAL LONDON QUARTERLY VOLUMES VS NUMBER OF DEALS                                                                                            CENTRAL LONDON YIELDS
    £ ‘000

8,000                                                                                                                                    100

                                                                                                                                         90
7,000
                                                                                                                                                      5             5
                                                                                                                                         80                                     4.75                  4.75         4.75
6,000                                                                                                                                                                                                                                         4.5                    4.5             4.5         4.5       4.5
                                                                                                                                                                                                                                                                                                                                  4.25         4.25       4.25
                                                                                                                                         70                                                                                                                                                                                                                                     4                   4
5,000
                                                                                                                                         60
                                                                                                                                                                                                                                                                                                                                                                                                          3.5

                                                                                                                                                                                                                    Hammersmith/West London
4,000                                                                                                                                    50

                                                                                                                                                                                                                                                                                                                                                                            Marylebone/Fitzrovia
                                                                                                                                         40
3,000

                                                                                                                                                                                                                                              City northern fringe

                                                                                                                                                                                                                                                                                                           Euston/Kings Cross

                                                                                                                                                                                                                                                                                                                                                                                                          Mayfair/ St James’s
                                                                                                                                                                                City eastern fringe
                                                                                                                                         30

                                                                                                                                                                                                                                                                                                                                                          Covent Garden
                                                                                                                                                    Canary Wharf
2,000

                                                                                                                                                                                                      Paddington

                                                                                                                                                                                                                                                                     Clerkenwell

                                                                                                                                                                                                                                                                                     Southwark
                                                                                                                                         20

                                                                                                                                                                                                                                                                                                                                   City Core
                                                                                                                                                                   Stratford

                                                                                                                                                                                                                                                                                                 Holborn

                                                                                                                                                                                                                                                                                                                                               Victoria
1,000

                                                                                                                                                                                                                                                                                                                                                                                                   Soho
                                                                                                                                         10

                 2013              2014                  2015                  2016                2017               2018        2019

        City    East London   West End    10 year quarterly average    Number of deals

LARGEST INVESTMENT DEALS OF Q2 2019                                                                                                            NEWLY AVAILABLE ON MARKET Q2 2019

 Address                                                 Price         Yield             Month            Purchaser                             Address                                                                         Vendor                                                                                          Price                                          Yield
                                                         (£m)           (%)                                                                                                                                                                                                                                                     (£m)                                            (%)
 35 North Wharf Road, W2                                  221           4.8              Apr-19           Brockton Everlast Inc                 8 Finsbury Circus, EC2                                                          Mitsubishi Estate                                                                               260                                                 4.00
 30 South Colonnade, E14                                  135           9.0              Jun-19           Cindat Capital Management             21 St James’s Square, SW1                                                       Columbia Threadneedle                                                                           200                                                 3.57
 10 Noble Street, EC2                                     104           4.4              May-19           Property Reserve Inc                  133 Houndsditch, EC3                                                            Madison International                                                                           170                                                 5.00
 Film House, Wardour Street, W1                           100                            May-19           WeWork                                20 Vauxhall Bridge Road, SW1                                                    Penguin Random House                                                                             74                                                 4.00
 21 Dartmouth Street, SW1                                 88.9         3.75              May-19           UK Government                         The Minories Collection, EC3                                                    DTZ Investors                                                                                   66.5                                                5.73
Occupier market                                    Central London map                                      Central London markets                                         Investment                             Investment commentary                                           Investment data                                   Contact

              Central London                                                      Charts                                                   West End                                                        City                                                East London                                                    Midtown

Should you wish to discuss any details within
this update please get in touch.

Patrick O’Keeffe                                            Chris Gore                                                  Jeremy Prosser                                              Nick Rock                                                   Alasdair Gurry                                              Fiona Don
Principal, West End Agency                                  Principal, City Investment                                  Principal, City Agency                                      Principal, West End Agency                                  Director, City and Docklands Agency                         Senior Researcher
+44 (0)20 7911 2768                                         +44 (0)20 7911 2036                                         +44 (0)20 7911 2865                                         +44 (0)7046 6517                                            +44 (0)20 7911 2831                                         +44 (0)20 7911 2753
pok@avisonyoung.com                                         chris.gore@avisonyoung.com                                  jeremy.prosser@avisonyoung.com                              nick.rock@avisonyoung.com                                   alasdair.gurry@avisonyoung.com                              fiona.don@avisonyoung.com

Visit us online
avisonyoung.co.uk/research

Avison Young
                                                                                                                                                                                                                                                                                                                                                  @AYUKviews
65 Gresham Street, London EC2V 7NQ
Avison Young is the trading name of GVA Grimley Limited. ©2019 Avison Young Created: 07/19 Ref: 11914

This report has been prepared by Avison Young for general information purposes only. Whilst Avison Young endeavours to ensure that the information in this report is correct it does not warrant completeness or accuracy. You should not rely on it without seeking professional advice. Avison Young assumes no responsibility for errors or omissions in this
publication or other documents which are referenced by or linked to this report. To the maximum extent permitted by law and without limitation Avison Young excludes all representations, warranties and conditions relating to this report and the use of this report. All intellectual property rights are reserved and prior written permission is required from
Avison Young to reproduce material contained in this report.
You can also read