L'innovazione al servizio della finanza sostenibile - Giugno 2021 - For professional investors only
←
→
Page content transcription
If your browser does not render page correctly, please read the page content below

L’innovazione al servizio della finanza sostenibile

                       - Giugno 2021 -

                 For professional investors only
Cos’è la Biodiversità?
        2

                   La biodiversità è la variabilità tra gli organismi viventi do ogni specie, compresi gli ecosistemi terrestri,
                     marini e altri ecosistemi acquatici e i complessi ecologici di cui fanno parte; ciò include la diversità
                                            all'interno delle specie, tra le specie e degli ecosistemi.

                               Diversità Genetica                 Diversità di specie                   Diversità ecologica

UNESCO’s commitment to biodiversity
Il settore alimentare: attore chiave nella biodiversità
         3
                                                                                       Fattori di impatto principali.

                                        Emissioni GHG

                                          Utilizzo del
                                            suono

                                          Utilizzo di
                                        acqua potabile

                                        Eutroficazione

                                            Diversità
                                            animale

                                                                                                                                      Altri
Source: Environmental impacts of food production, Hannah Ritchie and Max Roser available at https://ourworldindata.org/environmental-impacts-of-food
.
Come si misura la biodiversità?
         4

   Mean Species Abundance (MSA):

   Analizza lo stato della biodiversità dopo che una “azione”
   ha avuto luogo rispetto a uno stato indisturbato.

             I fattori di impatto sulla biodiversità del settore agro-
             alimentare :

                                                                     NO2

             Utilizzo del          Cambiamenti                   nitrogen              Eco-tossicità
                suolo                Climatici                  emissions          dell’acqua pootabile

Source: Global Change Biology, Volume: 26, Issue: 2, Pages: 760-771, First published: 03 November 2019, DOI: (10.1111/gcb.14848)
Impatto sulla Biodiversità
5 Impatto al 30 Aprile 2021
Settore Agro-Alimentare
Obiettivo:
Ridurre l’impatto sulla
biodiversità Misurata
attraverso il MSA
Food For Biodiversity
Settore Agro-Alimentare = Universo di investimento= portafoglio cap-weighted dei titoli nel settore Consumi di Base / Settore Agro-Alimentare ampio.
Source: Solactive, Datastream, Sustainalytics, Trucost, IcebergDataLab, Ossiam – Calculation by Ossiam in USD. Performances are those of indices. Data based on a backtest. Carbon data as of year-end or latest available month. Any data on past performance, modelling or back-testing contained
herein is no indication as to future performance. Backtested performance results do not represent the performance of actual trading using client assets, but are achieved by means of the retroactive application of a model. Backtested performance suffers from several limitations, namely they are
constructed based on hindsight, and material economic and market factors, as well as client will, may have affected investment decisions differently without such hindsight. Additionally, they do not reflect the impact of actual portfolio trading, which could have affected the price and availability of
securities, as well as the transaction fees paid. This model assumes reinvestment of net dividends and does not include any charges. Please note that if the performance of a strategy is calculated in a currency different from the currency of your area, any losses or gains generated by the strategy
may be affected by exchange rate fluctuations (both upward and downward). The MSA impact data and carbon footprint figures are as of the dates indicated and are subject to change and should not be relied upon as current thereafter.Carbon Footprint Carbon footprint al 30 Aprile 2021
6
Settore Agro-Alimentare
Food For Biodiversity
Indice di mercato
Indice di mercato = Solactive GBS World Staples
Settore Agro-Alimentare = Universo di investimento= portafoglio cap-weighted dei titoli nel settore Consumi di Base / Settore Agro-Alimentare ampio.
Source: Solactive, Datastream, Sustainalytics, Trucost, IcebergDataLab, Ossiam – Calculation by Ossiam in USD. Performances are those of indices. Data based on a backtest. Carbon data as of year-end or latest available month. Any data on past performance, modelling or back-testing contained
herein is no indication as to future performance. Backtested performance results do not represent the performance of actual trading using client assets, but are achieved by means of the retroactive application of a model. Backtested performance suffers from several limitations, namely they are
constructed based on hindsight, and material economic and market factors, as well as client will, may have affected investment decisions differently without such hindsight. Additionally, they do not reflect the impact of actual portfolio trading, which could have affected the price and availability of
securities, as well as the transaction fees paid. This model assumes reinvestment of net dividends and does not include any charges. Please note that if the performance of a strategy is calculated in a currency different from the currency of your area, any losses or gains generated by the strategy
may be affected by exchange rate fluctuations (both upward and downward). The MSA impact data and carbon footprint figures are as of the dates indicated and are subject to change and should not be relied upon as current thereafter.7
ESG e Intelligenza ArtificialeESG & l’approccio Best-In-Class
8
Ranking semplice in ESG
Source: Solactive, Sustainalytics. World Equities from the Solactive GBS World Index between 2012 and 2018 in USD. Past performance is not a reliable indicator of future performance. ESG Low, Mid and Top are portfolio build by sorting
in a decreasing order stocks in the index according to their ESG ratings. Each portfolio contains 1/3 of stocks.Le difficoltà dell’integrazione ESG
9
220
MSCI World Index
200
MSCI World ESG Leaders Index
180
160 L’integrazione
ESG semplice
140
non genera
120 necessariamente
alpha.
100
80
60
40
Sep-07 Sep-08 Sep-09 Sep-10 Sep-11 Sep-12 Sep-13 Sep-14 Sep-15 Sep-16 Sep-17 Sep-18 Sep-19 Sep-20
MSCI World Index vs MSCI World ESG Leaders Index
Source: Ossiam / Bloomberg – Calculations by Ossiam in USD from 28/09/2007 to 31/12/2020. Past performance is not a reliable indicator of future performance.I dettagli contano
10
Recycled QMS certifications
material use Lobbying
& political exp.
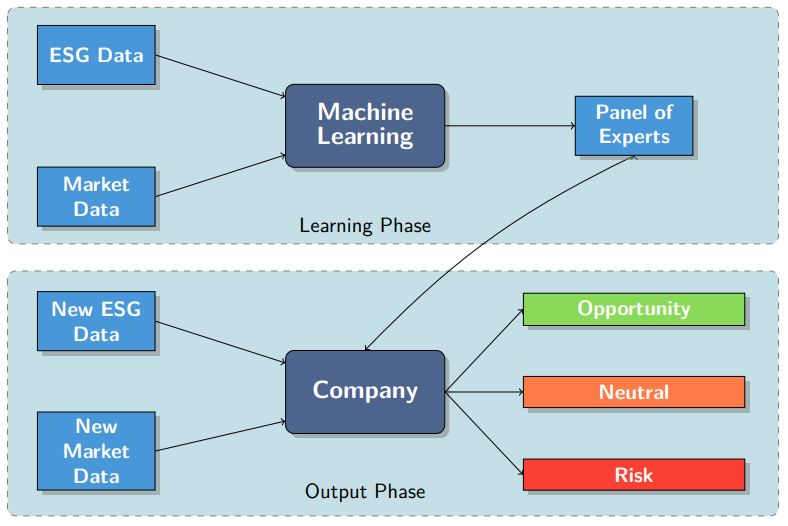
Come possiamo estrarre informazione utile dai
UN Global dati ESG?
Compact signatory
CDP
participation
Employee training Cos’è veramente materiale per il business?
Percentage
of temp. workers
Water management
programmes
Money laundering
Cosa conta veramente?
policy
UN PRI signatory
GHG reduction
Social supplier programme
Il Machine Learning esplora e identifica patterns
certification
nei dati ESG.
Sustainable Supply chain
Whistle-blower
agriculture monitoring
programmes
programmesCome funziona
11
Environment Governance Opportunità
Diagramma sintetico *
Esempio 1 Gestione rifiuti Verifica del reporting
pericolosi vs Peer ESG vs Sector
SOPRA LA MEDIA é nel TOP TERCILE
Governance Social Rischio
Esempio 2
Disclosure Benessere e
Remunerazione vs salute dei prodotti
Peer commercializzati
É MOLTO BASSA É MOLTO BASSA
*Source : Ossiam – Performance of ESG and Machine Learning investment approaches, available at https://ossiam.com/files/research_papers/1555312503_Performance_of_ESG_and_Machine_Learning_investment_approaches.pdfMachine Learning e Minimum Variance – Il caso Europeo
12 Indicatori di performance e rischio dal 18/01/2013 al 31/05/2021
35% 20%
Ossiam Positive Negative
30% 18% Europe Machine Machine
Solactive
ESG Learning Learning
25% 16%
31/05/2021 Europe 600
Machine (stocks (stocks
I ndex
Learning selected by rejected by
20% Strategy the algorithm) the algorithm)
14%
15%
12%
10% ann. perf. 8.27% 11.86% 11.34% 6.92%
10%
5% ann. vol. 16.38% 13.06% 15.29% 18.60%
8% max. DD -35.80% -28.54% -31.19% -43.31%
0%
6% Sharpe ratio 0.52 0.93 0.76 0.39
-5%
correlation - 90.54% 97.19% 97.03%
-10% 4%
T.E. - 7.18% 3.91% 4.80%
-15% 2%
beta - 0.72 0.91 1.10
-20% 0% ann. alpha - 5.96% 3.87% -2.21%
2013 2014 2015 2016 2017 2018 2019 2020 2021
Source: Solactive, Sustainalytics. European Equities (Solactive Europe 600 Index) from 2013 to 2021 in EUR. Past
Benchmark Positive ML Negative ML diff. best/worst performing (r.h.s) performance is not a reliable indicator of future performance. ML OPPORTUNITY is the cap-weighted portfolio of
stocks selected by the machine learning algorithm. ML RISK is the cap-weighted portfolio of stocks excluded by the
machine learning algorithm..,
Source: Solactive/Datastream/Trucost/Sustainalytics/Bloomberg. Calculation by Ossiam in EUR. The performance data represents the performance of the model portfolio developed based on the described algorithm and does not reflect the performance of an investment
vehicle Data before 26/11/2018 are based on backtest. Any data on past performance, modelling or back-testing contained herein is no indication as to future performance. Backtested performance results do not represent the performance of actual trading using client assets,
but are achieved by means of the retroactive application of a model. Backtested performance suffers from several limitations, namely they are constructed based on hindsight, and material economic and market factors, as well as client will, may have affected investment
decisions differently without such hindsight. Additionally, they do not reflect the impact of actual portfolio trading, which could have affected the price and availability of securities, as well as the transaction fees paid. This model assumes reinvestment of net dividends and is
net of charges.. Please note that if the performance of a strategy is calculated in a currency different from the currency of your area, any losses or gains generated by the strategy may be affected by exchange rate fluctuations (both upward and downward).13
Rischi e considerazioni
Le strategie presentate non sono veicoli di investimento e sono al lordo di eventuali commissioni. Essendo esposte al
mercato azionario, le strategie possono essere volatili. Occorre chiarire che gli investitori possono perdere
completamente il loro investimento.
Considerati i mercato sottostante alle strategie, gli investitori potrebbero essere esposti al rischio dei mercati emergenti,
al rischio di concentrazione e al rischio di investimento sostenibile.
Queste strategie promuovono caratteristiche ambientali o sociali ma non hanno come obiettivo un investimento
sostenibile. Potrebbe investire parzialmente in attività che hanno un obiettivo sostenibile, ad esempio qualificate come
sostenibili secondo la classificazione UEThis document is not of a regulatory nature. Ossiam, a subsidiary of Natixis Investment Managers, is a French asset manager authorized by the Autorité des Marchés Financiers (Agreement No. GP-10000016). Although information contained herein is from sources believed to be reliable, Ossiam makes no representation or warranty regarding the accuracy of any information of which it is not the source. The information presented in this document is based on market data at a given moment and may change from time to time. This material has been prepared solely for informational purposes only and it is no intended to be and should not be considered as an offer, or a solicitation of an offer, or an invitation or a personal recommendation to buy or sell participating shares in any Ossiam Strategy, or any security or financial instrument, or to participate in any investment strategy, directly or indirectly. It is intended for use only by those recipients to whom it is made directly available by Ossiam. Ossiam will not treat recipients of this material as its clients by virtue of their receiving this material. All performance information set forth herein is based on historical data and, in some cases, hypothetical data, and may reflect certain assumptions with respect to fees, expenses, taxes, capital charges, allocations and other factors that affect the computation of the returns. Past performance is not necessarily a guide to future performance. Any opinions expressed herein are statements of our judgment on this date and are subject to change without notice. Ossiam assume no fiduciary responsibility or liability for any consequences, financial or otherwise, arising from, an investment in any security or financial instrument described herein or in any other security, or from the implementation of any investment strategy. This information contained herein is not intended for distribution to, or use by, any person or entity in any country or jurisdiction where to do so would be contrary to law or regulation or which would subject Ossiam to any registration requirements in these jurisdictions. This material may not be distributed, published, or reproduced, in whole or in part. Trademarks, logos and other intellectual property marks belong to their respective owners. Copyright © 2016 Sustainalytics. All rights reserved. No portion of this material may be reproduced in any form without the expressed, written permission of Sustainalytics. Nothing contained in this presentation shall be construed as to make a representation or warranty, express or implied, regarding the advisability to invest in or include companies in investable universes and/or portfolios. The performance represented is historical; past performance is not a reliable indicator of future results and results and the information provided in this brochure is not intended to be relied upon as, nor to be a substitute for specific professional advice and in particular financial advice. The information is provided “as is” and, therefore Sustainalytics assumes no responsibility for errors or omissions. Sustainalytics accepts no liability for damage arising from the use of this brochure or information contained herein in any manner whatsoever. ESG Investing Methodological Limits : By using ESG criteria in the investment policy, the relevant Fund’s objective would in particular be to better manage sustainability risk. ESG criteria may be generated using the Investment Manager’s proprietary models, third party models and data or a combination of both. The assessment criteria may change over time or vary depending on the sector or industry in which the relevant issuer operates. Applying ESG criteria to the investment process may lead the Investment Manager to invest in or exclude securities for non-financial reasons, irrespective of market opportunities available. ESG data received from third parties may be incomplete, inaccurate, or unavailable from time to time. As a result, there is a risk that the Investment Manager may incorrectly assess a security or issuer, resulting in the incorrect direct or indirect inclusion or exclusion of a security in the portfolio of a.Strategy. The Strategy is subject to sustainability risks as defined in the Regulation 2019/2088 (article 2(22)) by environmental, social or governance event or condition that, if it occurs, could cause an actual or a potential material negative impact on the value of the investment. More information on the framework related to the incorporation of Sustainability can be found on the website of the Management Company and the Investment Manager. The Reference Index does not intend to be consistent with the environmental or social characteristics promoted by the Strategy. This product promotes environmental or social characteristics but does not have as its objective a sustainable investment. It might invest partially in assets that have a sustainable objective, for instance qualified as sustainable according to the EU classification. The proxy voting and engagement policy is available at the following link: Proxy Voting and Engagement Policy. Please refer to the Strategy prospectus and the corporate website of the Investment Manager for more information on the ESG assessment methodology of the Strategy.
This material has been provided for information purposes only to investment service providers or other Professional Clients, Qualified or Institutional Investors and, when required by local regulation, only at their
written request. This material must not be used with Retail Investors.

In the E.U. (outside of the UK and France): Provided by Natixis Investment Managers S.A. or one of its branch offices listed below. Natixis Investment Managers S.A. is a Luxembourg management company that is
authorized by the Commission de Surveillance du Secteur Financier and is incorporated under Luxembourg laws and registered under n. B 115843. Registered office of Natixis Investment Managers S.A.: 2, rue Jean
Monnet, L-2180 Luxembourg, Grand Duchy of Luxembourg. Italy: Natixis Investment Managers S.A., Succursale Italiana (Bank of Italy Register of Italian Asset Management Companies no 23458.3). Registered office:
Via San Clemente 1, 20122 Milan, Italy. Germany: Natixis Investment Managers S.A., Zweigniederlassung Deutschland (Registration number: HRB 88541). Registered office: Im Trutz Frankfurt 55, Westend Carrée, 7.
Floor, Frankfurt am Main 60322, Germany. Netherlands: Natixis Investment Managers, Nederlands (Registration number 50774670). Registered office: Stadsplateau 7, 3521AZ Utrecht, the Netherlands. Sweden:
Natixis Investment Managers, Nordics Filial (Registration number 516405-9601 - Swedish Companies Registration Office). Registered office: Kungsgatan 48 5tr, Stockholm 111 35, Sweden. Spain: Natixis Investment
Managers, Sucursal en España. Serrano n°90, 6th Floor, 28006, Madrid, Spain. Belgium: Natixis Investment Managers S.A., Belgian Branch, Gare Maritime, Rue Picard 7, Bte 100, 1000 Bruxelles, Belgium.

In France: Provided by Natixis Investment Managers International – a portfolio management company authorized by the Autorité des Marchés Financiers (French Financial Markets Authority - AMF) under no. GP 90-
009, and a public limited company (société anonyme) registered in the Paris Trade and Companies Register under no. 329 450 738. Registered office: 43 avenue Pierre Mendès France, 75013 Paris.
In Switzerland: Provided for information purposes only by Natixis Investment Managers, Switzerland Sàrl, Rue du Vieux Collège 10, 1204 Geneva, Switzerland or its representative office in Zurich, Schweizergasse 6,
8001 Zürich.

In the British Isles: Provided by Natixis Investment Managers UK Limited which is authorised and regulated by the UK Financial Conduct Authority (register no. 190258) - registered office: Natixis Investment Managers
UK Limited, One Carter Lane, London, EC4V 5ER. When permitted, the distribution of this material is intended to be made to persons as described as follows: in the United Kingdom: this material is intended to be
communicated to and/or directed at investment professionals and professional investors only; in Ireland: this material is intended to be communicated to and/or directed at professional investors only; in Guernsey: this
material is intended to be communicated to and/or directed at only financial services providers which hold a license from the Guernsey Financial Services Commission; in Jersey: this material is intended to be
communicated to and/or directed at professional investors only; in the Isle of Man: this material is intended to be communicated to and/or directed at only financial services providers which hold a license from the Isle
of Man Financial Services Authority or insurers authorised under section 8 of the Insurance Act 2008.

In the DIFC: Provided in and from the DIFC financial district by Natixis Investment Managers Middle East (DIFC Branch) which is regulated by the DFSA. Related financial products or services are only available to
persons who have sufficient financial experience and understanding to participate in financial markets within the DIFC, and qualify as Professional Clients or Market Counterparties as defined by the DFSA. No other
Person should act upon this material. Registered office: Unit L10-02, Level 10 ,ICD Brookfield Place, DIFC, PO Box 506752, Dubai, United Arab Emirates

In Japan: Provided by Natixis Investment Managers Japan Co., Ltd. Registration No.: Director-General of the Kanto Local Financial Bureau (kinsho) No.425. Content of Business: The Company conducts investment
management business, investment advisory and agency business and Type II Financial Instruments Business as a Financial Instruments Business Operator.

In Taiwan: Provided by Natixis Investment Managers Securities Investment Consulting (Taipei) Co., Ltd., a Securities Investment Consulting Enterprise regulated by the Financial Supervisory Commission of the R.O.C.
Registered address: 34F., No. 68, Sec. 5, Zhongxiao East Road, Xinyi Dist., Taipei City 11065, Taiwan (R.O.C.), license number 2020 FSC SICE No. 025, Tel. +886 2 8789 2788.

In Singapore: Provided by Natixis Investment Managers Singapore Limited (company registration no. 199801044D) to distributors and institutional investors for informational purposes only.

In Hong Kong: Provided by Natixis Investment Managers Hong Kong Limited to institutional/ corporate professional investors only.
In Australia: Provided by Natixis Investment Managers Australia Pty Limited (ABN 60 088 786 289) (AFSL No. 246830) and is intended for the general information of financial advisers and wholesale clients only .

In New Zealand: This document is intended for the general information of New Zealand wholesale investors only and does not constitute financial advice. This is not a regulated offer for the purposes of the Financial
Markets Conduct Act 2013 (FMCA) and is only available to New Zealand investors who have certified that they meet the requirements in the FMCA for wholesale investors. Natixis Investment Managers Australia Pty
Limited is not a registered financial service provider in New Zealand.

In Latin America: Provided by Natixis Investment Managers S.A.

In Uruguay: Provided by Natixis Investment Managers Uruguay S.A., a duly registered investment advisor, authorised and supervised by the Central Bank of Uruguay. Office: San Lucar 1491, Montevideo, Uruguay, CP
11500. The sale or offer of any units of a fund qualifies as a private placement pursuant to section 2 of Uruguayan law 18,627.

In Colombia: Provided by Natixis Investment Managers S.A. Oficina de Representación (Colombia) to professional clients for informational purposes only as permitted under Decree 2555 of 2010. Any products,
services or investments referred to herein are rendered exclusively outside of Colombia. This material does not constitute a public offering in Colombia and is addressed to less than 100 specifically identified investors.

In Mexico: Provided by Natixis IM Mexico, S. de R.L. de C.V., which is not a regulated financial entity, securities intermediary, or an investment manager in terms of the Mexican Securities Market Law (Ley del Mercado
de Valores) and is not registered with the Comisión Nacional Bancaria y de Valores (CNBV) or any other Mexican authority. Any products, services or investments referred to herein that require authorization or license
are rendered exclusively outside of Mexico. While shares of certain ETFs may be listed in the Sistema Internacional de Cotizaciones (SIC), such listing does not represent a public offering of securities in Mexico, and
therefore the accuracy of this information has not been confirmed by the CNBV. Natixis Investment Managers is an entity organized under the laws of France and is not authorized by or registered with the CNBV or
any other Mexican authority. Any reference contained herein to “Investment Managers” is made to Natixis Investment Managers and/or any of its investment management subsidiaries, which are also not authorized
by or registered with the CNBV or any other Mexican authority.

The above referenced entities are business development units of Natixis Investment Managers, the holding company of a diverse line-up of specialised investment management and distribution entities worldwide.
The investment management subsidiaries of Natixis Investment Managers conduct any regulated activities only in and from the jurisdictions in which they are licensed or authorized. Their services and the products
they manage are not available to all investors in all jurisdictions. It is the responsibility of each investment service provider to ensure that the offering or sale of fund shares or third party investment services to its clients
complies with the relevant national law.

The provision of this material and/or reference to specific securities, sectors, or markets within this material does not constitute investment advice, or a recommendation or an offer to buy or to sell any security, or an
offer of any regulated financial activity. Investors should consider the investment objectives, risks and expenses of any investment carefully before investing. The analyses, opinions, and certain of the investment
themes and processes referenced herein represent the views of the portfolio manager(s) as of the date indicated. These, as well as the portfolio holdings and characteristics shown, are subject to change. There can be
no assurance that developments will transpire as may be forecasted in this material. The analyses and opinions expressed by external third parties are independent and does not necessarily reflect those of Natixis
Investment Managers. Past performance information presented is not indicative of future performance.

Although Natixis Investment Managers believes the information provided in this material to be reliable, including that from third party sources, it does not guarantee the accuracy, adequacy, or completeness of such
information. This material may not be distributed, published, or reproduced, in whole or in part.

All amounts shown are expressed in USD unless otherwise indicated.
You can also read