NetBeez tutorial - Zendesk
←
→
Page content transcription
If your browser does not render page correctly, please read the page content below
NetBeez tutorial
Tables of contents

Forewords

Overview
   Dashboard
   Agents
   Tests
   Targets
   Control channel

Request NetBeez
   Select the server type
   Select and deploy the monitoring agents
   Firewall Rules

Tune the installation
   Anomaly detection
       Alert profiles
             Types of alert profiles
             Percentile-based mean
       Incidents
       Delivery options
   WiFi settings
   Data retention
   Users

Monitoring
   Monitoring applications with targets
       Web application
       DNS servers
       Other TCP applications
   Testing network performance with scheduled tests
       Iperf
       Speedtest
       VoIP
   QoS

Reports and API
   Reports types
   Email reports

                                Copyright © 2018 NetBeez, Inc. All rights reserved
API
Public dashboard
Troubleshooting with NetBeez
Using the Buzz Tab
Interactive console
Ad-hoc tests
NetBeez Configuration Checklist
Resources
Copyright © 2018 NetBeez, Inc. All rights reservedForewords
Welcome to the NetBeez tutorial! This guide was written with our users in mind, and
consolidates many hours spent with our users and customers in deploying and configuring
NetBeez. We hope that this tutorial will be a valuable instrument to tune and optimize your
installation. If you feel that some concepts are not well explained, require more information, or
are missing, please let us know. Send us your feedback and comments to info@netbeez.net.
Copyright © 2018 NetBeez, Inc. All rights reservedOverview
NetBeez is a distributed network monitoring platform. The monitoring is performed from multiple
points via hardware, software, or cloud agents, called ‘Beez’, that can be deployed on-premises
or in the cloud. These agents are managed by a server, called the ‘Beezkeeper’, that is also
located on-premise or in the cloud.
Dashboard
The dashboard is the graphical user interface that is necessary to manage the agents,
create monitoring tests, troubleshoot network or application problems, and receive alerts
and reports. The dashboard can reside in the cloud, managed by NetBeez or by the
customer itself, or on-premises, delivered by the server itself as a virtual appliance.
Agents
The agents serve as the monitoring endpoints that run tests on the network and against
the applications. An agent device is like an end-user workstation, so it requires an
Ethernet connection in the case of a hardware agent (wired or WiFi). Agents can also be
software, installed on an existing Linux or Windows host, virtual, delivered as OVA or
KVM images, or cloud, running in a public cloud.
Tests
A test runs a particular check with a remote host and returns results in terms of
success/failure along with timing information. NetBeez supports the following two types
of tests:
● Real-time tests:
○ Ping - Ping can be run as an ICMP echo request or as a TCP socket
connect. The ICMP command supports extra parameters such as:
Maximum Transmission Unit (MTU), Don’t Fragment (CD) bit, DSCP
value. The TCP supports various connect parameters like SYN, ACK,
FIN, PUSH, ...
○ DNS - This check is implemented with the dig command. The DNS
supports the DNS server as optional parameter.
○ HTTP - The HTTP test consists in a GET request, implemented with the
command curl. The command supports both HTTP and HTTPS pages,
and proxy servers authenticated and non.
○ Traceroute - Traceroute tests support the ICMP, TCP, and UDP
protocols. This command supports extra parameters: Destination port
number, max hops, timeouts per hop, and DSCP value.
Copyright © 2018 NetBeez, Inc. All rights reserved● Scheduled tests:
○ Iperf - Iperf can run throughput tests with TCP or UDP traffic. The user
can choose the destination port, the UDP bandwidth, TCP window size,
and DSCP marking.
○ Speedtest - Speedtest determines download, upload, and latency to an
Internet speedtest server. The command supports the server ID as
optional parameter.
○ VoIP - The VoIP test runs a one-way call from a source to a destination
agent. The command supports various codecs, like G.711, G.729, ...
A detailed list of tests is available on the online documentation.
Targets
A target is an object that provides real-time performance data to a specific host and
service. A target is defined by having one or more resources. A resource is defined by IP
address or fully qualified domain name (FQDN). Each of the resources is monitored via
real-time tests.
Control channel
Since the monitoring agents are centrally managed by the dashboard (to which they
send real-time results) a permanent control channel between each agent and the
dashboard is necessary. The control channel is created via an encrypted SSL socket,
which is established from the agent using the TCP port 20019 on the server. The
connection is initiated from the agents, so that simplifies the deployment of agents
behind a NAT and/or a firewall.
Request NetBeez
To request your server and agents contact sales@netbeez.net.
Select the server type
Request a virtual appliance if you would prefer to host the server on-premise; you can
also choose to host the server via a. The cloud instance can be deployed in your public
cloud, or hosted by NetBeez.
If you have requested a virtual appliance, you’ll receive a link where you can download
your pre-configured OVA. That OVA already contains everything that you need to run
Copyright © 2018 NetBeez, Inc. All rights reservedyour server, and is ready to be imported in VMware (other hypervisors like KVM and
HyperV).
If you have requested an on-premise server, once you have imported the virtual image
into your virtualization environment, follow this guide to load your license and activate
your on-premise server.
Select and deploy the monitoring agents
NetBeez offers a variety of hardware and software agents; for a complete list, please
review this documentation page.
Hardware agents are included in the NetBeez Enterprise subscription at no extra cost.
Hardware agents can be Ethernet, with 10/100 Mbps and 10/100/1000 Mbps interfaces,
or WiFi (802.11c). A hardware agent can monitor on the Ethernet or on the WiFi
interface only, not on both of them at the same time. You can also build your own
hardware agent, using a software agent or image for Raspberry Pi and Odroid. To
request hardware agents, send an email to sales@netbeez.net.
A software agent can be installed as a Linux package, as a virtual appliance, or as a
cloud instance. Software agents will be installed on existing hosts.
Virtual agents are virtual appliances that can be installed on hypervisors at data centers
or remote offices, and cloud agents are running on a public cloud. You can find the
installation instructions here.
NetBeez agents are also compatible with the Cisco ISR platform. You can find the
installation instructions here.
Once you have connected the hardware agents to the network, and installed the
software, virtual, or cloud agents, you are ready to configure the dashboard. If you have
procured the hardware agents from NetBeez (and correctly followed the installation
instructions for the software agents) all of the deployed agents will connect to the
dashboard. If some agents don’t show up in the dashboard, follow this troubleshooting
guide.
Firewall Rules
Users with an on-premise server installations should apply all the necessary firewall
rules to make sure all server’s functionalities are properly working. If you haven’t
received one, please make sure to request the NetBeez Security Guide and apply all the
firewall rules indicated on that guide.
Copyright © 2018 NetBeez, Inc. All rights reservedTune the installation
Once the server and the agents have been deployed and the license activated, it’s time to point
your browser to the NetBeez dashboard and review the configuration settings to make sure the
system meets your requirements.
Anomaly detection
Detecting network and application anomalies is one of the primary functions of a network
monitoring solution like NetBeez. For this reason, it’s very important to at least review
this configuration settings and decide what are the best options for your own needs.
Alert profiles
Alert profiles are attached to targets to detect problems with a specific test. For
this reason, alert profiles are test-specific, that is, are related to a specific type of
tests (ping, DNS, HTTP, traceroute, …). NetBeez comes with default alert
profiles, which can be edited, or deleted. The user can create new alert profiles,
and attach them to new or existing targets. Any change to an alert profile will be
immediately pushed to all the targets where that profile has been enabled.
Types of alert profiles
There are four types of alerts profiles:
1. Up-Down - These critical alerts are triggered by a test if a certain
number (multiplier) of consecutive checks fail. By default the
multiplier is set to five, but it can be adjusted by the user. Up-down
alerts are useful to detect loss of reachability, in the case of ping,
or service, in the case of DNS and HTTP tests.
2. Performance Baseline - These warnings indicate that a
performance degradation is occurring during a test. The detection
method is based on moving averages. NetBeez, for each test,
calculates the following statistics:
a. Short-term averages: 1 minute, 15 minutes, 1 hour, 4
hours.
b. Long-term averages: 1 day, 1 week, 1 month.
If the short-term average of a tests is a certain number of times
higher than its long-term average, it is possible to detect ongoing
performance degradation issues. This type of alert profile is suited
when a target is applied to many agents that show different
Copyright © 2018 NetBeez, Inc. All rights reservedperformance on same application, due to their geographical
location or other factors.
3. Performance Watermark - These warnings are used to detect
when a monitored object is not satisfying a service level
agreement. The detection method is based on comparing a
short-term average with a threshold. If the short-term average
crosses the threshold set, then an alert is triggered.
4. Performance Baseline AND Watermark - This alert profile
merges both performance baseline and watermark rules. If both
detection methods are satisfied, then an alert will be triggered by
NetBeez.
Percentile-based mean
To calculate the short-term and long-term averages, the algorithm uses all
the test results. However, in a stable time series, one individual result
could skew the mathematical average.
The percentile-based mean is used to filter out outliers that fall outside
two times the standard deviation interval (from the mathematical
average). The benefit of this function is that should a single data point
skew the mathematical average, the percentile-based mean won't be
affected, thus reducing the number of false positives (alerts noise).
If you want to learn more about alert profiles and percentile-based mean,
please refer to the online documentation page.
Incidents
Incidents are periods of degraded or otherwise abnormal performance of an
agent or target. This functionality is designed to help users identify problems and
performance variations with a network location (agent) or service and application
(target) without having the user to analyze many alerts to find the common point.
Copyright © 2018 NetBeez, Inc. All rights reservedAnother benefit of incidents is that they reduce the number of notifications that a
user has to receive for a single event.
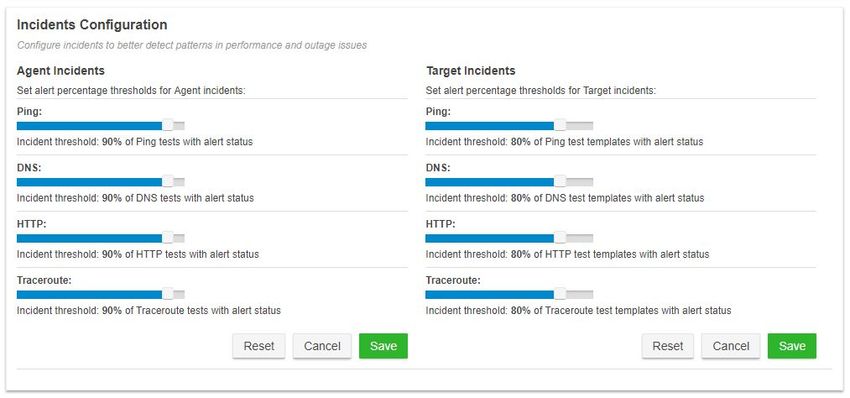
An incident is triggered when a certain percentage of tests within one agent or
target trigger an alert. Such threshold is defined by the user in the NetBeez
“Incidents Configuration” settings, under the “Anomaly Detection” section.
Incidents can be acknowledged, and users can post comments to include more
information about the undergoing performance issue, or explain the reason why a
specific incident was acknowledged or de-acknowledged.
If you want to read more about Incidents, please consulting this documentation
page.
Delivery options
Even when not in front of the dashboard, users can receive notifications of alerts
and incidents. NetBeez supports different delivery methods for notifying users
about new alerts and incidents raised, such as SNMP traps, syslog messages,
and emails. For each delivery method, the user can pick what to receive: only
alerts, only incidents, or both of them.
Copyright © 2018 NetBeez, Inc. All rights reservedNetBeez also integrates with many third party tools, such as Splunk, PagerDuty,
and Slack. Learn more about these integrations on the online documentation.
WiFi settings
NetBeez WiFi agents are small hardware units equipped with an external 802.11ac
dual-mode card. These units have two interfaces: the Ethernet one, which is only used to
establish the control channel with the server, and the WiFi one, which is used to run
tests for monitoring. A WiFi agent is not capable of running any monitoring on the
Ethernet interface. The Ethernet connection is required to push the initial configuration to
the agent, so the user can apply the wireless profile. Once the agent is connected to the
SSID network via the WiFi interface, the Ethernet plug can be removed, if desired.
Please remember that, a WiFi agent without an Ethernet connection may disconnect
from the dashboard, if the WiFi network is unstable or completely off. It’s highly
recommended to, where possible, always keep the Ethernet connection active.
The NetBeez WiFi agents supports any type of security settings: open, WEP, WPA
pre-shared key, and WPA with EAP methodologies. A wireless profile can be easily
configured on the dashboard and then pushed to the units in few clicks. If you wish to
learn more about this configuration, please check out this documentation page.
Data retention
The Enterprise edition of NetBeez supports user-defined data retention settings. The
user can set for how long the central server should retain performance data collected by
the agents. In practice, the data retention dictates how far back historical test data and
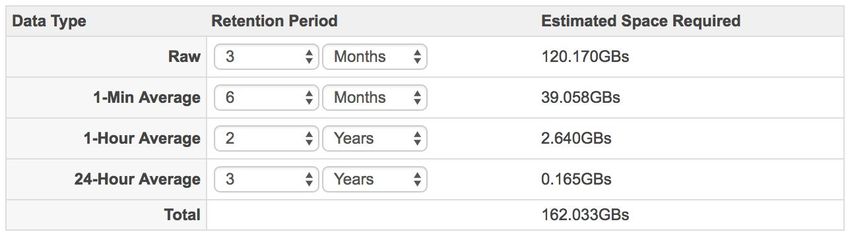
reports data can go. The variables to be set are:
● Raw test data - This is the raw tests result data, where each data point is the
result of a test. Raw test data is displayed in the real-time and historical graphs.
● 1-min average - This is the average of one test results collected in one minute.
The 1-min average is used to generate performance alerts and reports.
● 1-hour average - This is the average of one test results collected in one hour.
The 1-hour average is used to generate performance alerts and reports.
● 24-hour average - This is the average of one test results collected in twenty-four
hours. The 1-hour average is used to generate performance alerts and reports.
The resulting disk space required is dependent from the time period selected, the
number of tests, and their interval. This configuration setting can be easily applied from
the NetBeez Settings in few clicks.
Copyright © 2018 NetBeez, Inc. All rights reservedPlease refer to the online documentation page to learn more about this.
Users
The NetBeez dashboard is multi-user and multi-role. The Enterprise edition supports
unlimited number of users. There are three access-levels in NetBeez:
● Administrators - This user role can do anything: create and edit targets and
scheduled tests, run ad-hoc tests, create reports, and configure any aspect of the
solution, via the NetBeez Settings panel. Generally this account profile is
assigned to the application owners and senior network engineers of the
organization
● Read-Write - This access role can create and edit targets and scheduled tests,
run ad-hoc tests, and create reports. Generally this account profile is assigned to
intermediate network engineers and network managers.
● Read-Only - Accounts with read-only privileges will be able to review targets,
scheduled tests, but not create and edit targets or scheduled tests. This profile
should be assigned to support operators, and junior network engineers and
analysts.
Monitoring
In this section, we’ll setup NetBeez to monitor in real-time some applications and run periodic
network performance tests.
Monitoring applications with targets
To monitor an application you need to create a target using its FQDN and selecting the
tests that will be included. The tests are selected based on the type of application, or
service, that is monitored. Tests included in a target can run as frequently as every one
second, to reduce at minimum the time to detect problems as well as to have enough
granular data to understand the behavior of the network and applications. The below
Copyright © 2018 NetBeez, Inc. All rights reservedtable reports the default timing intervals associated to tests included in a target. Test
intervals can be adjusted anytime by the user.
Test Default Interval
Ping 5 seconds
DNS 30 seconds
HTTP 60 seconds
Traceroute 120 seconds
In the rest of this section, we’ll review some target templates that can be used to monitor
specific applications.
Web application
For example, to monitor a web service or a cloud application, it’s recommended
to include ping, DNS, HTTP, and traceroute tests. Ping, if not blocked, reports the
round-trip time and packet loss to the server where the application is hosted. If
ICMP is not allowed, the user can configure a TCP-based ping test to a remote
host port. The DNS test, will verify that end-user clients are able to resolve the
FQDN associated with the application. The HTTP test checks that the web server
is available to serve the user requests, and reports how long it takes to load a
web page.
DNS servers
DNS allows hosts to translate an FQDN into an IP address. This service can be
monitored by creating a target that uses the DNS servers’ IP addresses.
Typically, organizations have one anycast DNS IP address, or two individual IP
addresses. Tests that can be included in a target are, where allowed, ping, DNS,
and traceroute. In the DNS query, make sure to specify the DNS server’s IP
address in the server configuration field.
Other TCP applications
Other applications can be monitored using a TCP-based ping test, which verifies
that a specific TCP/IP port is open, and how much time it takes to establish a
socket. This test, complemented with ping, DNS, and traceroute, provides good
data to verifies status and health of a generic TCP-based application.
Copyright © 2018 NetBeez, Inc. All rights reservedTesting network performance with scheduled tests
The goal of network performance tests is to assess the quality of the network through
active tests. This group of tests run periodically according to a user-defined schedule.
The schedule can be periodic, hourly, daily, weekly, or custom, running on specific hours
throughout the day or certain days in a week or month.
Iperf
Iperf (https://iperf.fr/) is an open source command that runs TCP, UDP, and
multicast throughput tests between one or more iperf clients and one iperf server.
This tool is integrated in the NetBeez dashboard and is supported by any type of
agent. NetBeez supports both version 2 and 3. An Iperf test returns throughput
between the client(s) and the server. On UDP tests, users can also get packet
loss and jitter.
Speedtest
NetBeez agents can run speedtest tests to Ookla servers thanks to the open
source implementation speedtest-cli (https://github.com/sivel/speedtest-cli). This
test will measure both download and upload speed as well as latency to an
Internet Ookla speedtest server. The user has the option to select one specific
speedtest server from a public list
(https://www.speedtest.net/speedtest-servers.php) or to let the algorithm pick the
closet one, based on which one has lower latency.
VoIP
VoIP tests simulate a call between two agents and return the Mean Opinion
Score (MOS), which is a key performance indicator of call quality. The test also
reports the jitter, packet loss, and latency values, which are factors that affect the
call quality and, consequently the MOS. The user can pick the VoIP codec used
to run the test, such as G.711, G.729, … All the VoIP tests create a UDP stream
between the two agents selected that conform to the codec’s specifications. Also
all UDP packets are marked with the EF (DSCP 46) IP Type of Service.
Codec Name Payload Size Voice Speech Pkts per Sec. Bit Rate
G.711 160 Bytes 20 ms 50 64 Kbps
G.729 20 Bytes 20 ms 50 8 Kbps
G.723.1-63 24 Bytes 30 ms 33.3 21.9 Kbps
G.723.1-53 20 Bytes 30 ms 33.3 20.8 Kbps
G.726 80 Bytes 20 ms 50 55.2 Kbps
Copyright © 2018 NetBeez, Inc. All rights reservedG.728 60 Bytes 30 ms 33.3 31.5 Kbps
G.722 160 Bytes 20 ms 50 38.4 Kbps
QoS
NetBeez has included DSCP marking of IP packets in the following tests: ping,
traceroute, Iperf, and VoIP (pre-set). DSCP marking can be used to test difference in test
performance based on the QoS policy applied to network devices.
Reports and API
NetBeez users can generate reports to review historical network and application performance
data based on agents deployed, targets and scheduled tests configured. Reports can be
generated on the dashboard, or can be scheduled to be sent via email.
Reports types
The NetBeez dashboard can generate four type of reports:
● Network summary - This report provides a high level overview of agents and
targets. For each agent, the user can review availability, download and upload
speed if that agent had a speedtest configured, and number of alerts. For each
target, the user can review average HTTP GET time, and number of alerts.
● Agents - The user can select one or more agents to get a report on alerts
occurrence per target monitored, tests performance, and HTTP targets
performance.
● Targets - The user can select one or more targets to get a report on alerts
occurrence per agent included, tests performance, and HTTP performance per
agent.
● Scheduled tests - This report plots in a line graph format selected iperf,
speedtest, and VoIP scheduled tests.
When generating a report on the dashboard, it’s possible to extract such report in PDF
format, or save that report in a preset, which is the definition of the report type along with
the input parameters selected (e.g. report time period, elements to be included in the
report, etc.). As we’ll see in the next paragraph, presets must be created to schedule
email reports.
Copyright © 2018 NetBeez, Inc. All rights reservedEmail reports
NetBeez users can send PDF reports via email. The reports that are included in the
email are defined via presets. Emails are sent to one or more email addresses based on
a user defined schedule. To learn more about email reports, please consult this
documentation page.
API
NetBeez has a public API, which can be reviewed on the swagger page available with
each instance at the URL https:///swagger/index.html. The
current version of the API makes it possible for external applications to get the object’s
status, network and application performance data collected by the agents.
Public dashboard
The public dashboard is an open source project developed in PHP and uses the
NetBeez public API. The public dashboard can be installed on any web-server (libcurl
required) to provide a service status dashboard based on the targets and agents
configured. The benefits of a public dashboard are that the network engineers and
managers can share the status of the network and applications monitoring with the
end-users the by NetBeez. Also, the public dashboard can be installed in a intranet or
public website, without compromising the NetBeez server’s security. If you want to learn
more about this, check out the public dashboard GitHub page.
Troubleshooting with NetBeez
NetBeez can be helpful in troubleshooting network and application performance issues in large
and complex Wide Area Networks (WAN). The real-time data reported by the agents is used to
identify the scale (e.g. number of locations) and layer (e.g. network versus application) of
performance issues.
Using the Buzz Tab
The Buzz Tab was designed to provide the user with the most important information that
NetBeez collects, such as:
● Agent and target performance - The user can review the agent and HTTP
target performance distribution. In the agent performance chart, each agent is
represented as a dot, and whose xy coordinates are determined by its number of
performance alerts (y) and up-down alerts (x) triggered in the last 24 hours. In the
agent performance bar chart, each target is included in a bar, based on its
24-hour average HTTP response time.
Copyright © 2018 NetBeez, Inc. All rights reserved● Open and recent incidents - This section of the Buzz Tab reports all agent and
target incidents logged over the past 24 hours. This is a good way to quickly find
if there are network or application issues occurring. By clicking on a specific
incident, the user can check out what tests and alerts caused the incident to be
generated by the system.
Interactive console
An interactive console is built into the NetBeez dashboard and enables users to type
commands directly to the reachable NetBeez agents. The console can be used to review
log files to troubleshoot agent-related issues, run command line commands that are not
yet integrated with the dashboard. Some of the commands that are oftentime used by
network engineers on the interactive console are: nmap, tcpdump, and arp.
Ad-hoc tests
Ad-hoc tests can be used to troubleshoot network and application problems on the spot,
without having to create a target. The user selects the test type, the source agent, and
destination IP, FQDN, or agent where applicable. The command will run for the amount
count indicated, and then exit. Results are logged in real-time on the NetBeez
dashboard.
Copyright © 2018 NetBeez, Inc. All rights reservedNetBeez Configuration Checklist
Here’s a high level list of items that are necessary in order to have a working configuration:
Agents ● Connect all hardware agents (FastE, GigE, WiFi) to a network
switch via the Ethernet interface; make sure that they report to
the dashboard; if any agents have problems reporting to the
dashboard, here's the troubleshooting procedure.
● Configure the WiFi agents with the appropriate SSID profile to
connect to your wireless network(s); here’s the procedure.
● Rename the agents and create agent groups if needed.
Targets Create targets based on the prospect’s monitoring goals; this is a very
important part, so make sure to clearly define the applications and
network services that they want to monitor.
Scheduled Tests Setup scheduled tests for running throughput tests to other network
locations (iperf), or to the Internet (speedtest); VoIP tests can be used
to verify performance and quality of VoIP calls.
Users Invite your team to access the NetBeez dashboard: send them an
invitation via email so they can create their own account; review the
documentation page on user management to learn more about the
different roles and privileges available to users.
Email Reports Setup daily, weekly, or monthly reports to be sent via email as PDF
attachments.
Alerts and Incidents Define what type of performance alerts to enable; review the alerts
configuration
documentation page to learn the difference between up-down,
baseline, and watermark alerts.
Notifications Receive notifications on alerts and incidents via SMTP, SNMP, or
Syslog; in alternative, review the list of available integrations, such as
Splunk, PagerDuty, and Slack.
Copyright © 2018 NetBeez, Inc. All rights reservedResources
If you want to keep learn more about NetBeez, there are several online resources available:
● NetBeez online documentation: https://netbeez.zendesk.com/hc/en-us
● NetBeez blog: https://netbeez.net/blog
● NetBeez community: http://community.netbeez.net
● NetBeez YouTube channel:
https://www.youtube.com/channel/UC89nekW3nqHyIKK6OaTH6uA
Copyright © 2018 NetBeez, Inc. All rights reservedYou can also read