Creating the Value Leader in Wireless - The Combination of T-Mobile USA and MetroPCS - SNL.com
←
→
Page content transcription
If your browser does not render page correctly, please read the page content below
Creating the Value Leader in Wireless
The Combination of T-Mobile USA and MetroPCS

October 3, 2012
Safe harbor statement.
Additional
AdditionalInformation
Informationand
andWhere
WheretotoFind
FindItIt
This
Thisdocument
documentrelates
relatestotoaaproposed
proposedtransaction
transactionbetween
betweenMetroPCS
MetroPCSCommunications,
Communications,Inc.Inc.(“MetroPCS”)
(“MetroPCS”)and andDeutsche
DeutscheTelekom
TelekomAG AG(“Deutsche
(“DeutscheTelekom”)
Telekom”)ininconnection
connectionwithwithT-Mobile
T-MobileUSA,
USA,Inc.
Inc.(“T-
(“T-
Mobile”).
Mobile”).The
Theproposed
proposedtransaction
transactionwill
willbecome
becomethe thesubject
subjectofofaaproxy
proxystatement
statementtotobe
befiled
filedbybyMetroPCS
MetroPCSwith
withthe
theSecurities
Securitiesand
andExchange
ExchangeCommission
Commission(the (the“SEC”).
“SEC”). This
Thisdocument
documentisisnot
notaasubstitute
substitutefor
for
the
theproxy
proxystatement
statementor orany
anyother
otherdocument
documentthat thatMetroPCS
MetroPCSmaymayfile
filewith
withthe
theSEC
SECor orsend
sendtotoits
itsstockholders
stockholdersininconnection
connectionwith
withthe
theproposed
proposedtransaction.
transaction. MetroPCS’
MetroPCS’investors
investorsand
andsecurity
securityholders
holdersare
are
urged
urgedtotoread
readthe
theproxy
proxystatement
statement(including
(includingallallamendments
amendmentsand andsupplements
supplementsthereto)
thereto)and
andallallother
otherrelevant
relevantdocuments
documentsregarding
regardingthe
theproposed
proposedtransaction
transactionfiled
filedwith
withthe
theSEC
SECororsent
senttotoMetroPCS’
MetroPCS’
stockholders
stockholdersas asthey
theybecome
becomeavailable
availablebecause
becausetheytheywill
willcontain
containimportant
importantinformation
informationabout
aboutthetheproposed
proposedtransaction.
transaction. All
Alldocuments,
documents,when
whenfiled,
filed,will
willbe
beavailable
availablefree
freeofofcharge
chargeatatthe
theSEC’s
SEC’swebsite
website
(www.sec.gov).
(www.sec.gov). You Youmay
mayalsoalsoobtain
obtainthese
thesedocuments
documentsby bycontacting
contactingMetroPCS’
MetroPCS’Investor
InvestorRelations
Relationsdepartment
departmentatat+1+1(214)
(214)570-4641,
570-4641,ororvia
viae-mail
e-mailatatinvestor_relations@metropcs.com.
investor_relations@metropcs.com.This This
communication
communicationdoes doesnot
notconstitute
constituteaasolicitation
solicitationofofany
anyvote
voteor
orapproval.
approval.
Participants
Participantsininthe
theSolicitation
Solicitation
MetroPCS
MetroPCSand andits
itsdirectors
directorsand
andexecutive
executiveofficers
officerswill
willbe
bedeemed
deemedtotobe beparticipants
participantsininany
anysolicitation
solicitationofofproxies
proxiesininconnection
connectionwith
withthe
theproposed
proposedtransaction,
transaction,and
andDeutsche
DeutscheTelekom
Telekomandandits
itsdirectors
directorsand
and
executive
executiveofficers
officersmay
maybe bedeemed
deemedtotobebeparticipants
participantsininsuch
suchsolicitation.
solicitation. Information
Informationabout
aboutMetroPCS’
MetroPCS’directors
directorsand
andexecutive
executiveofficers
officersisisavailable
availableininMetroPCS’
MetroPCS’proxy
proxystatement
statementdated
datedApril
April16,
16,2012
2012for
for
its
its2012
2012Annual
AnnualMeeting
MeetingofofStockholders.
Stockholders. Other
Otherinformation
informationregarding
regardingthetheparticipants
participantsininthe
theproxy
proxysolicitation
solicitationand
andaadescription
descriptionofoftheir
theirdirect
directand
andindirect
indirectinterests,
interests,by
bysecurity
securityholdings
holdingsor
orotherwise,
otherwise,will
will
be
becontained
containedininthe
theproxy
proxystatement
statementand
andother
otherrelevant
relevantmaterials
materialstotobe
befiled
filedwith
withthe
theSEC
SECregarding
regardingthetheproposed
proposedtransaction
transactionwhen
whenthey
theybecome
becomeavailable.
available. Investors
Investorsshould
shouldread
readthe
theproxy
proxystatement
statement
carefully
carefullywhen
whenititbecomes
becomesavailable
availablebefore
beforemaking
makinganyanyvoting
votingor
orinvestment
investmentdecisions.
decisions.
Cautionary
CautionaryStatement
StatementRegarding
RegardingForward-Looking
Forward-LookingStatements
Statements
This
Thisdocument
documentincludes
includes“forward-looking
“forward-lookingstatements”
statements”for
forthe
thepurpose
purposeofofthe
the“safe
“safeharbor”
harbor”provisions
provisionswithin
withinthe
themeaning
meaningofofthe
thePrivate
PrivateSecurities
SecuritiesLitigation
LitigationReform
ReformActActofof1995,
1995,as
asamended.
amended.Any Any
statements
statements made in this document that are not statements of historical fact, including statements about our beliefs, opinions, projections, and expectations, are forward-looking statementsand
made in this document that are not statements of historical fact, including statements about our beliefs, opinions, projections, and expectations, are forward-looking statements andshould
shouldbe
be
evaluated as such. These forward-looking statements often include words such as “anticipate,” “expect,” “suggests,” “plan,” “believe,” “intend,” “estimates,” “targets,” “views,” “projects,”
evaluated as such. These forward-looking statements often include words such as “anticipate,” “expect,” “suggests,” “plan,” “believe,” “intend,” “estimates,” “targets,” “views,” “projects,” “should,” “should,”
“would,”
“would,”“could,”
“could,”“may,”
“may,”“become,”
“become,”“forecast,”
“forecast,”and
andother
othersimilar
similarexpressions.
expressions.
All
Allforward-looking
forward-lookingstatements
statementsinvolve
involvesignificant
significantrisks
risksand
anduncertainties
uncertaintiesthatthatcould
couldcause
causeactual
actualresults
resultstotodiffer
differmaterially
materiallyfrom
fromthose
thoseininthe
theforward-looking
forward-lookingstatements,
statements,many manyofofwhich
whichare aregenerally
generally
outside
outside the control of MetroPCS, Deutsche Telekom and T-Mobile and are difficult to predict. Examples of such risks and uncertainties include, but are not limited to, the possibility thatthe
the control of MetroPCS, Deutsche Telekom and T-Mobile and are difficult to predict. Examples of such risks and uncertainties include, but are not limited to, the possibility that theproposed
proposed
transaction
transactionisisdelayed
delayedorordoes
doesnot
notclose,
close,including
includingdueduetotothe
thefailure
failuretotoreceive
receivethetherequired
requiredMetroPCS
MetroPCSstockholder
stockholderapprovals
approvalsor orrequired
requiredregulatory
regulatoryapprovals,
approvals,the
thetaking
takingofofgovernmental
governmentalactionaction(including
(including
the
thepassage
passageofoflegislation)
legislation)totoblock
blockthe
thetransaction,
transaction,thethefailure
failureto
tosatisfy
satisfyother
otherclosing
closingconditions,
conditions,thethepossibility
possibilitythatthatthe
theexpected
expectedsynergies
synergieswill
willnot
notbe
berealized,
realized,or
orwill
willnot
notbe
berealized
realizedwithin
withinthe
theexpected
expected
time
timeperiod,
period,the
thesignificant
significantcapital
capitalcommitments
commitmentsofofMetroPCS
MetroPCSand andT-Mobile,
T-Mobile,global
globaleconomic
economicconditions,
conditions,disruptions
disruptionstotothe
thecredit
creditand
andfinancial
financialmarkets,
markets,fluctuations
fluctuationsininexchange
exchangerates,
rates,competitive
competitiveactions
actions
taken by other companies, natural disasters, difficulties in integrating the two companies, disruption from the transaction making it more difficult to maintain business
taken by other companies, natural disasters, difficulties in integrating the two companies, disruption from the transaction making it more difficult to maintain business and operational relationships, and operational relationships,
possible
possibledisruptions
disruptionsor orintrusions
intrusionsofofMetroPCS’
MetroPCS’or orT-Mobile’s
T-Mobile’snetwork,
network,billing,
billing,operational
operationalsupport
supportand
andcustomer
customercare caresystems
systemswhich
whichmay
maylimit
limitorordisrupt
disrupttheir
theirability
abilitytotoprovide
provideservice,
service,actions
actionstaken
takenor or
conditions imposed by governmental or other regulatory authorities and the exposure to litigation. Additional factors that could cause results to differ materially from
conditions imposed by governmental or other regulatory authorities and the exposure to litigation. Additional factors that could cause results to differ materially from those described in the forward- those described in the forward-
looking
lookingstatements
statementscancanbe befound
foundininthe
theMetroPCS’
MetroPCS’20112011Annual
AnnualReport
Reporton onForm
Form10-K
10-KandandQuarterly
QuarterlyReport
Reporton onForm
Form10-Q
10-Qfor
forthe
thequarter
quarterended
endedJune June30,
30,2012
2012andandother
otherfilings
filingswith
withthe
theSEC
SECavailable
availableatat
the SEC’s website (www.sec.gov).
the SEC’s website (www.sec.gov).
The
Theforward-looking
forward-lookingstatements
statementsspeak
speakonly
onlyas
astotothe
thedate
datemade,
made,arearebased
basedon oncurrent
currentassumptions
assumptionsandandexpectations,
expectations,and
andare
aresubject
subjecttotothe
thefactors
factorsabove,
above,among
amongothers,
others,and
andinvolve
involverisks,
risks,uncertainties
uncertainties
and
andassumptions,
assumptions,many
manyofofwhich
whichare
arebeyond
beyondour
ourability
abilitytotocontrol
controlororability
abilitytotopredict.
predict.Neither
NeitherMetroPCS’
MetroPCS’investors
investorsand
andsecurity
securityholders
holdersnor
norany
anyother
otherperson
personshould
shouldplace
placeundue
unduereliance
relianceon
onthese
theseforward-
forward-
looking
lookingstatements.
statements.Neither
NeitherMetroPCS,
MetroPCS,Deutsche
DeutscheTelekom
Telekomnor norany
anyother
otherparty
partyundertake
undertakeany
anyduty
dutytotoupdate
updateany
anyforward-looking
forward-lookingstatement
statementtotoreflect
reflectevents
eventsafter
afterthe
thedate
dateofofthis
thisdocument,
document,except
exceptas
as
required
requiredby
bylaw.
law.
2
Speaker lineup.
René Obermann
– Chief Executive Officer, Deutsche Telekom
Roger Linquist
– Chairman and Chief Executive Officer, MetroPCS
John Legere
– President and Chief Executive Officer, T-Mobile USA
Braxton Carter
– Chief Financial Officer & Vice Chairman, MetroPCS
3
Creating the Value
                Leader in Wireless
            Leading
            Leading Value
                    Value Carrier
                          Carrier in
                                   in U.S.
                                      U.S. Wireless
                                           Wireless Market
                                                    Market

         Strengthened
         Strengthened Spectrum
                      Spectrum Position
                               Position to
                                        to Roll-out
                                           Roll-out 4G
                                                    4G LTE
                                                       LTE

 Projected
 Projected $6
           $6 -- $7Bn
                 $7Bn Cost
                      Cost Synergies
                           Synergies from
                                     from Enhanced
                                          Enhanced Scale
                                                   Scale and
                                                         and Scope
                                                             Scope

Attractive
Attractive Growth
           Growth Profile
                  Profile with
                          with Projected
                               Projected 7%
                                         7% -- 10%
                                               10% 5-year
                                                   5-year EBITDA
                                                          EBITDA CAGR
                                                                 CAGR

                                                                        4
Transaction terms and structure.
26% 74% Deutsche Telekom (DT)
MetroPCS Shareholders Ownership Ownership Equity Debt
$1.5 Bn
Cash
NewCo $15 Bn
(T-Mobile & MetroPCS) Notes
Reverse acquisition of T-Mobile by DT to nominate Board members
MetroPCS consistent with its ownership percentage
MetroPCS recapitalization with 1 NewCo Corporate
Selected consent rights for DT
for 2 stock split Governance
Increase / decrease of ownership
MetroPCS shareholders receive
Key Transaction $1.5Bn cash payment limitations for DT
Elements DT receives 74% ownership of
NewCo
MetroPCS shareholder vote expected
Combined business remains a U.S.- Conditions and
listed company late-2012/early-2013
Closing
Roll-over existing $15Bn DT Customary regulatory approvals required
Timeline
intercompany loan into notes in NewCo Expected to close in 1H 2013
5Transformational combination enhances growth and profitability.
Capture growth in industry’s fast growing no-contract services
Value Leadership
Greater customer value and choice
Greater spectrum position, network coverage and capacity
Scale Benefits Deeper LTE network deployment with path to at least 20x20 MHz
Improves marketing and purchasing scale
Projected cost synergies of $6 – $7Bn NPV (1)
Significant Synergies Clear cut technology path to one common LTE network
Straightforward integration with clear migration path for MetroPCS subscribers onto T-
Mobile network
Enhanced growth profile – projected 5-year CAGRs:
Strengthened Financials – Revenue: 3 – 5%, EBITDA: 7% – 10% and Free Cash Flow (2) 15% – 20%
Increases financial flexibility and direct capital market access for NewCo
1) NPV calculated with 9% discount rate and 38% tax rate
2) Free Cash Flow defined as EBITDA less Capital Expenditure
6Strategic rationale for Deutsche Telekom.
Strengthens DT’s Enhances platform for credible challenger position in the U.S. wireless market
Strategic Position in Leading player in fast growing no-contract services
Attractive U.S. Market
Increases scale and positions NewCo for growth and value creation
Compelling Total projected cost synergies with NPV of $6 – $7Bn (1)
Value Strongly enhances asset value compared to SOTP valuations without deploying more
Opportunity capital
Increased Financial NewCo is publicly listed entity; equivalent to an accelerated IPO with synergies
Flexibility Creates path towards self-funding platform in the U.S. with direct access to capital markets
DT’s Commitment to No impact to shareholder remuneration policy
Shareholders
Unchanged No changes to guidance for 2012
1) NPV calculated with 9% discount rate and 38% tax rate
7Strategic rationale and financial benefits for MetroPCS.
Addresses need for spectrum by increasing average depth from 22 to 83 MHz in
MetroPCS’s major metro areas
Strengthens Strategic Ability to expand MetroPCS model into new geographies providing new growth platform
Position Stronger value proposition to customers powered by broader coverage and deeper
spectrum
Increased scale and access to nationwide platform
Shareholders to Shareholders receive cash payment of approximately $4.09 per share
Receive Attractive Mix Shareholders receive 26% ownership stake in NewCo and significant participation in
of Cash and Stock NewCo’s growth and value creation, including projected cost synergies
Combined entity reduces MetroPCS’s standalone business risk
Enhances Stability and Increases flexibility to pursue future opportunities
Flexibility
Allows MetroPCS customers to gain access to full range of contract and no-contract
services
8NewCo: The Wireless Value Leader
NewCo leadership in place.

         Brings Together Seasoned Executive Leadership with Significant Industry Expertise

                  John Legere                                               J. Braxton Carter
                  President and Chief                                       Chief Financial Officer
                  Executive Officer

                  Jim Alling                                                Thomas C. Keys
                  COO of T-Mobile                                           COO of MetroPCS
                  Customer Unit                                             Customer Unit

                                                                                                      10
NewCo: The premier challenger in the U.S. wireless market.
Simplicity, unlimited data, and “No Surprises” for both contract and no-contract customers
Combined spectrum resources enabling at least 20x20 MHz LTE in major metro areas
Growth platform delivering projected 7% - 10% EBITDA growth
and 15% - 20% FCF (1) growth (5-year CAGR)
Led by proven management team committed to growth and cost leadership
1) Free Cash Flow defined as EBITDA less Capital Expenditure
11Increasing our momentum.
AT&T Network Verizon Tower MetroPCS
spectrum modernization spectrum transaction Combination
swap
$4Bn LTE More Attractive
investment efficient financial structure Creating the
AWS spectrum
including site network and while maintaining leading value
received
upgrades and deeper LTE operational carrier
spectrum rollout flexibility
re-farming
12Enhanced spectrum position.
Spectrum Transactions Significantly Improved T-Mobile's Spectrum Depth
Total Spectrum in Top 100 Major Metro Areas
MHz (1)
75 11 72
6
61 4
2
52 7
50 41
35
26
25
31
26 26
0
T-Mobile (Dec 2011) AT&T Spectrum VZW Spectrum T-Mobile (Oct 2012) MetroPCS NewCo
PCS Spectrum AWS Spectrum
1) Totals do not reconcile due to rounding
13NewCo: an enhanced competitor.
Total Spectrum in Top 25 Major Metro Areas Subscribers
MHz 2Q-2012, Millions
76 48 42.5
75 63 33.2
36 9.3 6.6
6.6 14.6
50 24 5.3
25 12 21.3 21.3
13
0
0
NewCo
NewCo (1)
Branded Contract Branded No-Contract Wholesale
Total Revenue EBITDA
$Bn, 2012E (2) $Bn, 2012E (2)
9
30 5.1 1.4 6.3
24.8 4.9
19.7 6
20
3
10 0
(3)
0 NewCo
% Margin of
NewCo Service 28.2% 30.3% 28.6%
Revenue (4)
1) Includes MVNO and M2M
2) 2012E based on equity research consensus; presented as US GAAP
3) Pre stock-based compensation
14
4) Based on 2012E equity research consensus T-Mobile service revenue of $17.3Bn, MetroPCS service revenue of $4.6Bn and NewCo service revenue of $21.9BnAccelerates Challenger Strategy.
Initiatives Underway Benefits with MetroPCS
$4Bn network modernization Complementary spectrum position
Amazing 4G Services 20% coverage improvement Path to at least 20x20 MHz LTE
>200MM pops LTE in 2013 Improved urban and in-building coverage
Unlimited 4G data
Geographic expansion opportunities
Value Leader First with contract handset financing and
Expanded customer choice
Bring Your Own Device
Brand re-launch Signals “staying power”
Trusted
Trusted Brand
Brand 1,400 store refresh Improved customer experience
Ramping B2B salesforce by 1,000
Leading value carrier
Multi-Segment Player Monthly4G growth of ~75% YoY
~70,000 total points of distribution
Rich MVNO pipeline
Business re-structuring Projected 20 - 25% increase in network
Challenger Business asset utilization
Cost discipline yielding $900MM savings Projected $6 - 7Bn NPV (1) value of
Model Branded contract churn improvement of synergies
50Bps YoY Cost leadership culture
1) NPV calculated with 9% discount rate and 38% tax rate
15$4Bn network modernization well underway.
Amazing
4G
Services
$4Bn Total Investment
37,000 sites upgraded over three years with:
– Multi-mode radios
Antennas with integrated
– Tower-top electronics radios
– New antennas with integrated radios
Enables technology enhancements:
– HSPA+ introduction in PCS spectrum
band in 2012 BTS
– LTE >200MM POPs by end of year
Coax Card
2013 Fiber
– Approximately 20% projected improved
in-building coverage
16MetroPCS enables deeper LTE spectrum in top areas. Amazing
4G
Services
Spectrum depth enhances LTE in key metro areas (1) = T-Mobile AWS Spectrum
= Additional AWS spectrum
from transaction
Key Areas Post-Transaction LTE Spectrum (MHz) Average LTE Spectrum in Key Areas (MHz)
New York 50
60
Los Angeles 50
14 50
50
Dallas 60
Philadelphia 40 40 36
Detroit 50
30
Boston 50
San Francisco 50 20
Tampa 50
10
Sacramento 50
0
Las Vegas 50
NewCo
Orlando 50
1) Assumes AWS spectrum fully deployed as LTE spectrum over time
17Delivers greater network scale. Amazing
4G
Services
Cell Sites and DAS Nodes Subscribers per Cell Site*
Thousands
Enhanced
Enhanced spectrum
spectrum position
position
60 765
52
633 664
MetroPCS
MetroPCS DAS
DAS site
site consolidation
consolidation
enhances
enhances network
network density
density
18
Greater
Greater equipment
equipment purchasing
purchasing
* scale
NewCo* NewCo scale
*Note: Includes DAS Nodes and Macro Sites *Note: Includes M2M subscribers;
cell sites adjusted for DAS Nodes
Total Spectrum BRS (Clearwire)
MHz, top 25 major metro areas
109 106
97
76
63 52
54 13 9
NewCo
18T-Mobile network ready to accommodate MetroPCS Amazing
4G
subscribers. Services
Favorable Dynamics Integration Plan
T-Mobile’s
T-Mobile’s 40-60
40-60 MHzMHz HSPA+
HSPA+ // LTE
LTE will
will Transition
Transition MetroPCS’s
MetroPCS’s subscribers
subscribers to
to T-
T-
have
have capacity
capacity to
to allow
allow MetroPCS
MetroPCS Mobile
Mobile // NewCo
NewCo network
network through
through upgrade
upgrade
customers
customers to
to begin
begin migration
migration at
at time
time of
of cycles
cycles
close
close
Re-farm
Re-farm MetroPCS
MetroPCS spectrum
spectrum to
to create
create
Rapid
Rapid handset
handset turnover
turnover (60%
(60% -- 65%
65% per
per
capacity
capacity for
for increasing
increasing demand
demand forfor
year)
year) facilitates
facilitates MetroPCS
MetroPCS customer
customer
migration
migration increased
increased LTE
LTE bandwidth
bandwidth
Coverage
Coverage and
and performance
performance for
for MetroPCS
MetroPCS Decommission
Decommission redundant
redundant sites
sites and
and
customers
customers improves
improves dramatically
dramatically in
in integrate
integrate selected
selected MetroPCS
MetroPCS assets
assets in
in
transition
transition minimizing
minimizing any
any potential
potential churn
churn dense
dense metro
metro areas
areas
GSM
GSM ecosystem
ecosystem handsets
handsets equivalent
equivalent or
or MetroPCS
MetroPCS customers
customers anticipated
anticipated to
to be
be
more
more capable
capable at
at each
each price
price point
point completely
completely migrated
migrated to
to NewCo
NewCo byby 2H
2H 2015
2015
19Straightforward spectrum migration strategy. Amazing
4G
Services
GSM Dallas Region Case Study
GSM remains
remains “universal”
“universal” technology
technology
5x5 MHz Blocks
for
for roaming,
roaming, M2M
M2M and
and legacy
legacy devices
devices CDMA / EVDO GSM HSPA+ LTE
2H2013 1H2014 2H2014 1H2015 2H2015
MetroPCS
MetroPCS PCS
PCS spectrum
spectrum migrated
migrated to
to
HSPA+
HSPA+
T-Mobile
T-Mobile
T-Mobile AWS
AWS repurposed
repurposed from
from
AWS
HSPA+
HSPA+ to
to LTE
LTE over
over time
time
Available
Available MetroPCS
MetroPCS AWS
AWS spectrum
spectrum MetroPCS
migrates
migrates to
to LTE
LTE
AWS
AWS becoming
becoming primary
primary LTE
LTE band
band PCS
T-Mobile
across
across Americas
Americas
20Creates the value leader in wireless. Value
Leader
Best Value in the U.S. Market
Contract Services No-contract Services
Brands
Partner Brands (MVNO)
Consumer
Customer
B2B Consumer
Segments M2M
Primary Channel National / Direct National / Indirect Local / Indirect
~70,000
~70,000 total
total points
points ofof distribution
distribution
Distribution
~7,500
~7,500 branded
branded doors
doors // ~10,000
~10,000 33rdrd-party
-party doors
doors // ~50,000
~50,000 national
national retail
retail doors
doors
Network 4G
4G network
network with
with LTE/HSPA+
LTE/HSPA+ delivers
delivers fast
fast and
and reliable
reliable coverage
coverage
21Improves customer experience. Trusted
Brand
Benefits to NewCo Customers
Better service and faster speeds driven by: Greatly expands on-net domestic
coverage
Network Increased network density
Coverage Broader coverage area International roaming options
Additional capacity in major metro areas
Deeper LTE coverage in major metro Faster, broader, higher capacity 4G
LTE
areas such as NY, LA and Dallas HSPA+ and LTE network
Expands handset availability Wider handset choice and lower costs
Devices
Leverage MetroPCS automation and National footprint subs not forced to
Distribution self service to improve service levels leave MetroPCS when they move
and Service
22Leader in fast growing no-contract offerings. Multi-
Segment
Player
North America Industry Growth Branded No-contract Subscribers (1) Branded No-contract Revenue
% Subscribers CAGR (2012-2017) Q2-2012, Millions Q2-2012, $Bn
21.3 1.0
Total 3% - 5% 15.4 1.2
NewCo 14.6 NewCo 1.6
9.3 1.2
No-Contract 9% - 10%
7.5 Not Reported
5.9 0.8
Contract 2% - 3% 5.3 Not Reported
5.3 0.4
Source: Independent Market Research (OVUM)
1) Facilities-based carriers exclude wholesale
23MetroPCS expands footprint.
Multi-
Segment
Player
NewCo’s Spectrum and Network Broadens MetroPCS’s Potential Reach
MetroPCS Network
T-Mobile Network
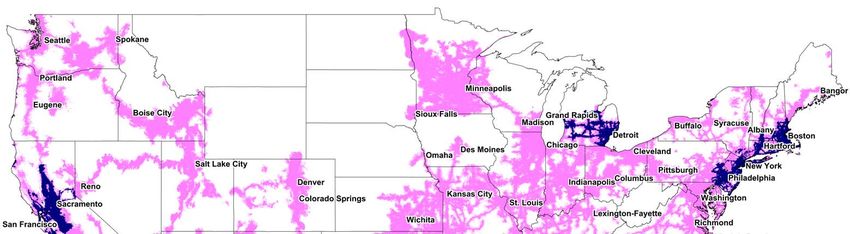
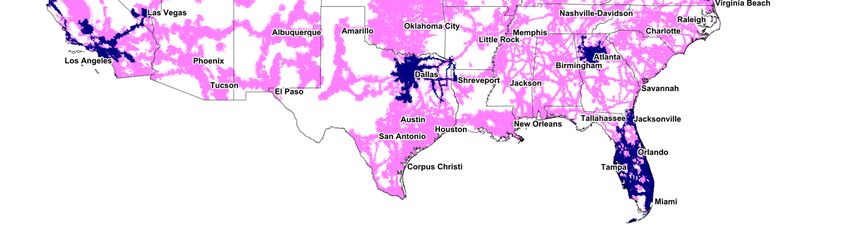
Addressable
Addressable POPs
POPs coverage
coverage increases
increases from
from 105MM
105MM to
to more
more than
than 280MM
280MM
24Transaction accelerates momentum in contract offerings.
Multi-
Segment
Player
Powerful signal to customers that NewCo is here to compete in contract offerings
Network improvements contribute to improving churn metrics
Improves 4G LTE depth in major metro areas
Additional spectrum supports Unlimited as key differentiator
Signals staying power to B2B customers
Providing Contract Customers a More Compelling Product Offering
25Poised for growth.
Challenger
Business
Model
Expected 5-year Growth
% CAGR Capture
Capture Scale
Scale Benefits
Benefits
Achievable
Achievable projected
projected cost
cost synergy
synergy realization
realization
Revenue 3% - 5% with
with run-rate
run-rate of
of $1.2
$1.2 –– $1.5Bn
$1.5Bn
EBITDA 7% - 10% – Projected
Projected EBITDA
EBITDA run-rate
run-rate of
of $0.8
$0.8 ––
$1.0Bn
$1.0Bn
Free Cash
15% - 20%
Flow (1) – Reduction
Reduction in
in capex
capex with
with projected
projected run-
run-
rate
rate savings
savings of
of $0.4
$0.4 –– $0.5Bn
$0.5Bn
Target Profitability
% of service revenue
Upside
Upside from
from geographic
geographic expansion
expansion of
of
EBITDA
34% - 36% MetroPCS
MetroPCS brand
brand
Margin
1) Free Cash Flow defined as EBITDA less Capital Expenditure
26Synergies turbocharge the Challenger business model. Challenger
Business
Model
T-Mobile’s network capacity accelerates MetroPCS customer transition
Rapid Transition to Highly complementary spectrum allows for greater LTE bandwidth
a Single Network
Projected $5 - $6Bn NPV (1)
Rapid handset turnover facilitates network migration
Decommission redundant sites and retain selected MetroPCS network assets
Capture Economies Realize efficiencies in common support functions
of Scale
Estimated ~$1Bn NPV (1)
Maximize scale benefits with handset and other partners
Expanding MetroPCS’s brand into new major metro areas
Drive MetroPCS
Increase distribution density and customer convenience
Geographic Expansion
Provide strong dealer community
1) NPV calculated with 9% discount rate and 38% tax rate
27Cost synergies yield projected $6 - $7 billion NPV (1). Challenger
Business
Model
Year 1 Year 2 Year 3 Year 4 Year 5 Description
Network ($MM)
Reduction in operating expenses
Operating
Opex Savings -
($0-$50) $100-$200
($0-$50) $200-$300
$0-$100 $500-$600
$300-$400 $600-$700 related to tower, backhaul and
roaming
Savings in capacity and expansion
Capex Savings $100-$200 $300-$400 $400-$500 $450-$550 $400-$450
capex
Site upgrades and
One - Time Costs ($600-$700) ($0 - $50) ($700-$800) ($800-$900) -
decommissioning
Non - Network ($MM)
HSPA+ cost advantage over CDMA
Opex Savings $0-$50
- $100-$200 $150-$250 $150-$250 $200-$300 Procurement and back office
efficiencies
Capex Savings $100-$200
- $0-$50 $0-$50 $0-$50 $0-$50 Common platform efficiencies
Customer transition and business
One – Time Costs ($150-$250) ($0-$100) ($0-$100) - -
integration
1) NPV calculated with 9% discount rate and 38% tax rate
28NewCo’s strong financial profile. Challenger
Business
Model
Total Revenue EBITDA
$Bn, 2012E (1) $Bn, 2012E (1)
9
30 5.1 24.8 1.4 6.3
19.7 6 4.9
20
3
10
0
0 (2)
NewCo
NewCo % Margin of
Service 28.2% 30.3% 28.6%
Revenue (3)
Capital Expenditure Free Cash Flow (4)
$Bn, 2012E (1) $Bn, 2012E (1)
6 4
0.9 4.2 3
4 3.2 0.5 2.1
2 1.6
2
1
0 0
NewCo NewCo
% Capital % Margin of
Intensity 18.8% 20.2% 19.1% Service 9.4% 10.1% 9.6%
of Service Revenue (3)
Revenue (3)
1) 2012E based on equity research consensus; presented as US GAAP
2) Pre stock-based compensation
3) Based on 2012E equity research consensus T-Mobile service revenue of $17.3Bn, MetroPCS service revenue of $4.6Bn and NewCo service revenue of $21.9Bn
29
4) Free Cash Flow defined as EBITDA less Capital ExpenditureNewCo’s attractive and flexible capital structure. Challenger
Business
Model
NewCo Debt
NewCo
NewCo Financial
Financial Strategy
Strategy $Bn, 2012E (1)
NewCo
NewCo will
will have
have significant
significant financial
financial resources,
resources, $20.4
$18.6
stability
stability and
and access
access to
to capital
capital
– Strong
Strong credit
credit profile
profile will
will reduce
reduce cost
cost of
of
capital
capital
Total Debt Net Debt
– Target
Target credit
credit rating
rating of
of Ba2/BB
Ba2/BB to
to Ba3/BB-
Ba3/BB-
NewCo Post-Synergy EBITDA Leverage Ratio
Deutsche
Deutsche Telekom
Telekom will
will be
be the
the largest
largest holder
holder of
of x 2012E EBITDA (2)
NewCo
NewCo equity
equity and
and debt
debt 2.9x
2.6x
– DT
DT maintains
maintains an
an investment
investment grade
grade credit
credit
rating
rating (Baa1
(Baa1 // BBB+)
BBB+)
– DT
DT to
to roll-over
roll-over existing
existing $15Bn
$15Bn inter-company
inter-company
Total Leverage Net Leverage
loan
loan into
into NewCo
NewCo senior
senior unsecured
unsecured notes
notes
1) Projected total debt of $20.4Bn and net debt of $18.6Bn assuming $1.8Bn of cash at close; excludes $2.4Bn tower financing obligation and $0.4Bn MetroPCS capital leases
2) Based on equity research consensus EBITDA of $7.1Bn (pro forma 2012E EBITDA of $6.3Bn and $0.9Bn of run-rate cost synergies)
30NewCo’s detailed capital structure.
Challenger
Business
Model
Capital Structure
1 Deutsche
Deutsche Telekom
Telekom Financing
Financing $Bn (1)
$15Bn
$15Bn of
of rollover
rollover notes
notes
DT Financing $15.0
–– Average
Average tenor
tenor of
of 8.5
8.5 years
years 1
DT Revolving Credit Facility (Undrawn) 0.0
–– Projected
Projected weighted
weighted average
average yield
yield of
of 8%
8%
Existing MetroPCS Bank Loan 2.5
$0.5Bn
$0.5Bn Revolving
Revolving Credit
Credit Facility
Facility 2
Existing MetroPCS Unsecured Notes 2.0
$5.5Bn
$5.5Bn backstop
backstop (existing
(existing MetroPCS
MetroPCS debt
debt and
and new
new
third
third party
party debt)
debt)
New Third Party Financing 1.0 3
2 Existing Total NewCo Debt $20.4
Existing MetroPCS
MetroPCS Debt
Debt
$2.5Bn
$2.5Bn bank
bank debt
debt (subject
(subject to
to waiver
waiver or
or refinance)
refinance) T-Mobile Tower Leasing Obligation 2.4
–– Variable
Variable rate
rate with
with weighted
weighted average
average ofof 4.6%
4.6% as
as MetroPCS Capital Leasing Obligations 0.4
of
of 6/30/12
6/30/12 and
and maturity
maturity range
range of
of 2013-2018
2013-2018 Total Adjusted NewCo Debt $23.2
$2Bn
$2Bn unsecured
unsecured notes
notes
–– 7.875%
7.875% notes
notes due
due 2018
2018 Less: Expected Cash at Closing (1.8)
–– 6.625%
6.625% notes
notes due
due 2020
2020 Total NewCo Net Debt $18.6
3 New
New 33rdrd Party
Party Debt
Debt Total Adjusted NewCo Net Debt $21.4
$1Bn
$1Bn new
new third
third party
party debt
debt
1) Totals do not reconcile due to rounding
31Creating the Value
Leader in Wireless
Leading
Leading Value
Value Carrier
Carrier in
in U.S.
U.S. Wireless
Wireless Market
Market
Strengthened
Strengthened Spectrum
Spectrum Position
Position to
to Roll-out
Roll-out 4G
4G LTE
LTE
Projected
Projected $6
$6 -- $7Bn
$7Bn Cost
Cost Synergies
Synergies from
from Enhanced
Enhanced Scale
Scale and
and Scope
Scope
Attractive
Attractive Growth
Growth Profile
Profile with
with Projected
Projected 7%
7% -- 10%
10% 5-year
5-year EBITDA
EBITDA CAGR
CAGR
32Back-Up
Estimated Deutsche Telekom group impact from MetroPCS
transaction.
Major Financial Key Performance Indicators (KPIs) 2013
Revenue EBITDA (adj.) ROCE FCF EPS (adj.)
Delta
€ 4.2 Bn € 1.1 Bn 0.4 p.p. € -0.3 Bn € 0.02
Other
Other Effects
Effects
One
One time
time effect
effect 2012:
2012: estimated
estimated negative
negative net
net income
income effect
effect of
of €€ 77 -- 88 Bn
Bn due
due to
to goodwill
goodwill and
and asset
asset
impairment
impairment on
on T-Mobile
T-Mobile asset
asset
FCF
FCF in
in 2013
2013 will
will include
include integration
integration expenses
expenses of
of €€ 0.6
0.6 to
to €€ 0.7
0.7 Bn.
Bn. Positive
Positive accretion
accretion including
including integration
integration
expenses
expenses expected
expected from
from 2014
2014 onwards
onwards
Rating
Rating debt:
debt: the
the transaction
transaction has
has aa non-significant
non-significant impact
impact on
on DT
DT Debt/EBITDA
Debt/EBITDA ratio
ratio
34You can also read


