Laurentian Bank Securities 8th Annual Institutional Investor Conference - April 6, 2021
←
→
Page content transcription
If your browser does not render page correctly, please read the page content below
Laurentian Bank Securities 8th Annual Institutional Investor Conference
                                                             April 6, 2021
Cautionary Statement
Certain statements in this presentation are “forward looking statements,” which reflect the
expectations of management regarding the Company's future growth, results of operations,
performance and business prospects and opportunities. These forward-looking statements are made
as of the date of this presentation and NFI assumes no obligation to update or revise them to reflect
new events or circumstances, except as required by applicable securities laws. See the Appendix to
this presentation for more details about the forward-looking statements.

In addition, certain financial measures used in this presentation are not recognized earnings
measures and do not have standardized meanings prescribed by International Financial Reporting
Standards (“IFRS”). Therefore, they may not be comparable to similar measures presented by other
issuers. See the Appendix to this presentation and the Company’s related Management Discussion
& Analysis (“MD&A”) for more information and detailed reconciliation to the applicable IFRS
measures.

All figures in U.S. dollars unless otherwise noted.

                                                                                                        2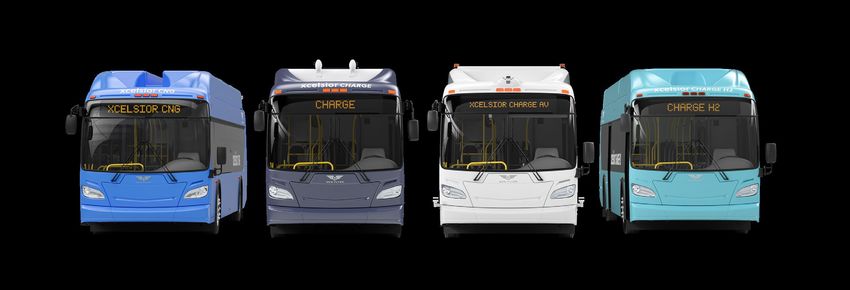
Key Terms
• Buses manufactured by New Flyer and ADL's single and double deck buses are classified as "transit buses". ARBOC manufactures body on-
  chassis or “cutaway” and "medium-duty" buses that service transit, paratransit, and shuttle applications. Collectively, transit buses, medium-
  duty buses and cutaways, are referred to as "buses".
• A “motor coach” or “coach” is a 35-foot to 45-foot over-the-highway bus typically used for intercity transportation and travel over longer
  distances than heavy-duty transit buses, and is typically characterized by (i) one or two axles in the rear (related to the weight of the vehicle), (ii)
  high deck floor, (iii) baggage compartment under the floor, (iv) high-backed seats with a coach-style interior (often including a lavatory), and (v)
  no room for standing passengers.
• Zero-emission buses ("ZEBs") consist of trolley-electric, hydrogen fuel cell-electric, and battery-electric buses.
• One equivalent unit (or “EU”) represents one production slot, being one 30-foot, 35-foot, 40-foot, 45-foot heavy-duty transit bus, one double
  deck bus, one medium-duty bus, one cutaway bus or one motor coach, whereas one articulated transit bus represents two equivalent units. An
  articulated transit bus is an extra-long transit bus (approximately 60-feet in length), composed of two passenger compartments connected by a
  joint mechanism. The joint mechanism allows the vehicle to bend when the bus turns a corner, yet have a continuous interior.
• Many public customer contracts include options to purchase transit buses and motor coaches in the future, and a large portion of the Company’s
  order book is represented by “options” as opposed to “firm orders.”

                                                                                                                                                         3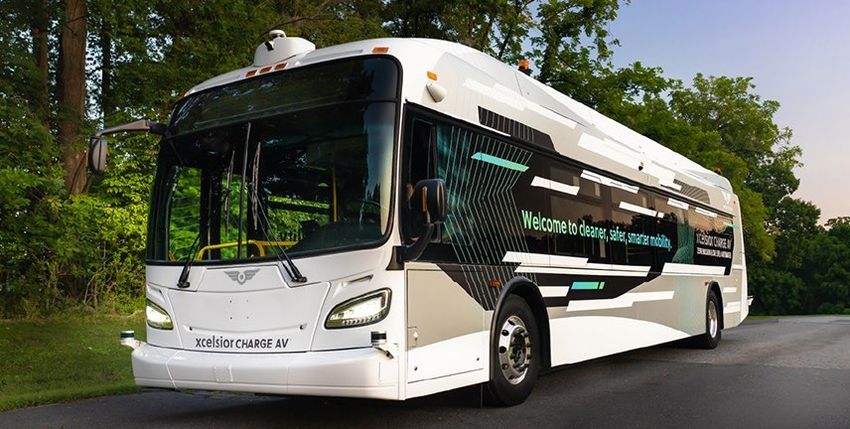
NA Market Leader in Heavy-Duty Transit
                                            Buses and Infrastructure Solutions

NFI is a leading global
independent bus and motor
coach manufacturer driving the             NA Market Leader in Motor Coaches
evolution to zero-emission mobility.

OUR VISION                                 UK Market Leader in Bus and Coach;

To enable the future of mobility with      World Leader in Double Deck Buses

innovative and sustainable solutions.

OUR MISSION
To design and deliver exceptional         NA market leader in Low-floor Cutaway
                                             and medium-duty Shuttle buses
transportation solutions that are safe,
accessible, efficient and reliable.

                                             Market leader in Bus/Coach Parts

                                                                                   4 4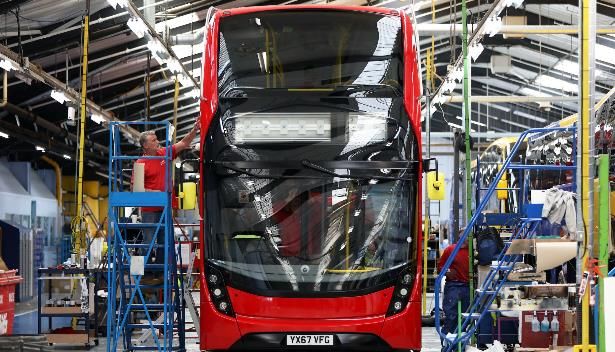
Our history builds the foundation for our future
                  North American Market Rationalization         Diversification and Vertical Integration
                              2010 - 2014                                     2015 – 20191
REVENUE ($M)

                                                                                                                $3,172
                                 10.1% CAGR                                                    19.8% CAGR

                                               $1,451                                 $1,539
                          $984

                                 2010 - 2014                                                    2015 - 2019
ADJ EBITDA ($M)

                                                                                                                  $331

                                 2.4% CAGR                                                      21.7% CAGR

                                                                                       $151
                           $97                  $107
                                                7.4%                                    9.8%                       9.8%
                          9.9%                                                                                     ROS
                          ROS                   ROS                                     ROS

                                 2010 - 2014                                                   2015 - 2019(1)

   Acquisitions
   & Initiatives                                        Parts

                                                                 1   2019 Pro-Forma for a Full Year of ADL’s Results. ADL was acquired on May 28, 2019

                                                                                                                                                 5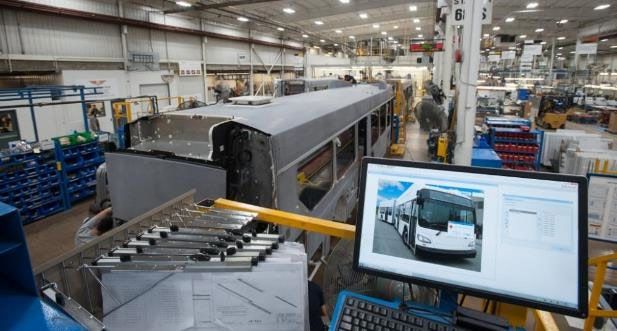
Positioned for growth and margin enhancement
             Recovery, NFI Forward, and Leading the ZEvolution 2020 – 2025

    REVENUE ($M)                                                     $3,900 to $4,100

                                    $2,800 to $2,900
           $2,419

                       16% - 20%                        8%+ CAGR
                        Growth                         (2021-2025)

            2020                         2021                              2025
                                       Guidance                           Target

   ADJ EBITDA ($M)                                                    $400 to $450

                                     $220 to $240
            $158       40% - 50%                       16%+ CAGR
                        Growth                         (2021-2025)

            2020                         2021                              2025
                                       Guidance                           Target

                                                                                        6
Migrated from manufacturer to solutions provider

 Infrastructure   Buses and   Connected Vehicles     Aftermarket,
   Solutions       Coaches     and Diagnostics     Warranty & Service

                                                                        7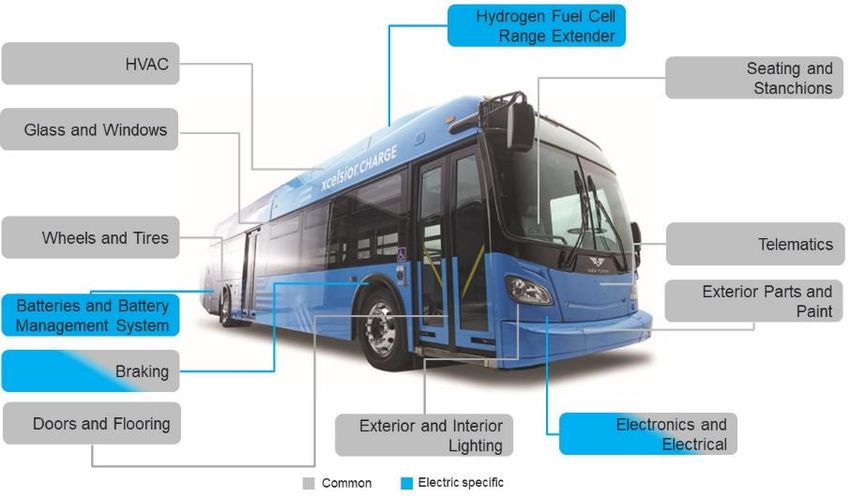
23+ million
                                     Electric service miles since 2015

                                     1,371
Leading                              ZEBs delivered since 2015

Electric Bus Mobility                389
                                     ZEBs delivered in 2020 (9% of total deliveries)

                                     80+
      50+                            Cities with an NFI ZEB in service or on order

                                     632
  years of electric
  bus experience
                       105k          ZEBs in backlog (5.8% of total backlog)
                       vehicles in
                      service (ZEB
                      replacement
                                     $24.7 million
                      opportunity)   Infrastructure Solutions revenue in 2020
       11
   countries with                    20% to 25%
   NFI buses in                      of 2021 production will be ZEBs
      service

                                     8,000
                                     Annual ZEB production capacity

                                                                                       8
Buses and coaches are migrating to electric propulsion
 and NFI will lead the transition
         EV share of global vehicle fleet by segment1                                     Select NFI customers comments on EV transition2

80%

60%                                                                                       “Commitment to 100%            “From 2025 onwards
                                                                                         zero-emissions by 2040”        committed to acquiring
                                                                                                                        100% electric vehicles”

40%

                                                                                       “Committed to a 100% zero-      “Committed to 100% ZEB
20%
                                                                                         emission fleet by 2040”              by 2040”

0%
      2020        2024          2028   2032                2036             2040

             Two-Wheelers                       Passenger Vehicles                      “By 2037 all buses across      “Ambitious goal of an all-
             Light Commercial                   Medium Commercial                      London will be zero emission”     electric fleet by 2035”
                                       1 Bloomberg   New Energy Finance Outlook 2020

                                                                                                                             2 Company   websites and reports

                                                                                                                                                                9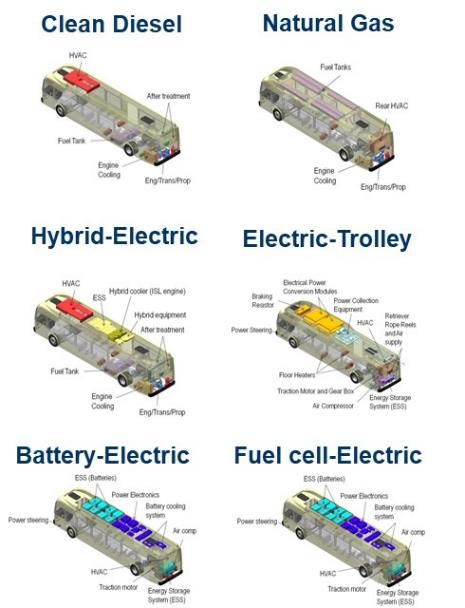
NFI’s zero-emission journey started in 1969

                                            2005
                     1994
                                         First Diesel                                                        2018
                      First              Hybrid with               2012                    2015                                    2020
                   Compressed           BAE and first                                                    Launched NF
                   Natural Gas          Gas Engine              First battery-       Launched NF         Infrastructure           Launched
                    (CNG) bus               Hybrid              electric bus           Connect             Solutions             MCI eCoach

    1969                         1998               2010                     2014                 2017                    2019             2021
  First North               First diesel         20 Fuel Cell                 First           Opened VIC            Acquired ADL
                                                                                                                                         Launched
  American                 hybrid vehicle         buses for               production of       and launched          and launched
                                                                                                                                        Xcelsior AV,
electric trolley           produced with            2010                 fuel-cell range          next               NF Connect
                                                                                                                                       ARBOC Equess
                              Allison             Olympics                  extender           generation                360
                                                                                                                                       CHARGE, ADL
                                                                                                electric-
                                                                                                                                       H2.0 hydrogen,
                                                                                               battery bus
                                                                                                                                       new NF models

                                                                                                                                                10
Structures designed for life with common components
All buses built on common structure >90% of components are shared across legacy and EV platforms
NFI has designed its production to be capable of manufacturing various
propulsion formats on common platforms with shared suppliers
11
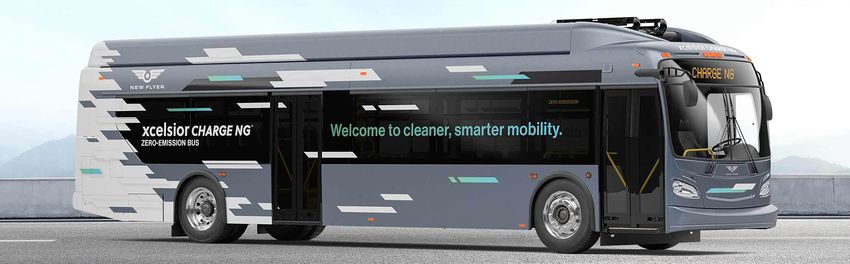
11Industry’s widest range of ZEB’s already exist
Single-Deck
24- & 35-foot Battery-Electric
Electric Equess
35-foot
Long Range &
Rapid Charge
Double-Deck
Battery-Electric
40-foot
Long Range &
Rapid Charge
Double-Deck
40-foot Fuel-Cell Electric
Fuel-Cell
Electric
60-foot
Long Range & Motor Coach
Rapid Charge Electric J4500e
60-foot
Fuel-Cell
Electric Motor Coach
Electric D45 CRTe LE
12The largest ZEB production capacity in North America
and the United Kingdom
8,000 160+
team members weekly production capacity
3,500,000+ 14
sq ft of ZEB-capable
production space production facilities
2 4,371
dedicated new product EUs produced in 2020
development facilities
20% to 25% 35% to 40%
of 2021 production of 2025 production
estimated to be ZEB estimated to be ZEB
Capable of manufacturing battery-electric,
fuel-cell, and electric trolleys. Can produce
Single-Deck, Articulated, Double-Deck,
Medium-Duty, and Cutaway models
13Multiple solutions and approaches to battery technology
NF and MCI’s in-house battery pack production ADL – Partnership and Internal production
Chassis on body
• Since 2016, ADL and BYD have worked in
partnership to develop market-leading EVs
• Continuous focus on battery market research and testing for the UK
• Remain cell agnostic to retain flexibility and the best available cells Integrated chassis
• Significant R&D costs to develop cells and battery modules in-house
• Battery cells and modules when consolidated into battery packs drive
range, performance, cycle life, charge rates and reliability
• Different use cases, on-route vs depot charging, drive decisions for
cell selection
Retain flexibility to provide the best offering to customers
14Full-service offering including infrastructure,
telematics and aftermarket service and support
• Introduced in 2019 to support • Performance analytics • Aftermarket support for NFI’s
NFI North American Electric dashboard for battery-electric fleet of 105,000 vehicles plus
Bus Deployments buses other makes and models
• Provides a cohesive transition • Additional range capability with • Training, detailed vehicle
of bus fleets to zero-emission improved driver performance, manuals and warranty support
bus technology reduced operating cost, and
maximum fleet utilization • Dedicated e-commerce
• Focuses on energy webstores, national and
management optimization, as • Decision-making information to international same-day
well as infrastructure planning optimize charging strategies shipping capabilities from 24
and development and intelligence on preserving stocking locations
Plug-in battery energy throughout the
On-route • 300+ field and technical
day
service technicians plus 24/7
• Enables Over-The-Air support
Software Updates
Depot
15Positive Political Momentum Supports Capital Purchases
Unprecedented government support for zero-emission transit
$14.9B transit funding Proposed $494B Ten Point Plan for a
program (Feb 2021 announcement) INVEST in America Act; Green Industrial
($2.75B of which is including a 5x increase Revolution
dedicated to zero-emission for ZEB procurement (Nov 2020)
transit in 2021-2026) (2020)
£5.0B transit & cycling
funding program
$1.5B CIB financing to “Biden Wants Zero-Emission (Feb 2020)
Public Transit for Cities With
support ZEBs and 100,000+ People” 1
charging infrastructure “15 States follow California’s lead
“The UK government’s National
(Oct 2020 announcement) Bus Strategy will see more than
and agree that transit agencies 4,000 zero-emission vehicles
must purchase all-electric put into service and the creation
buses” 2 of Britain’s first all-electric bus
town” 4
1 Mass Transit Mag, 2 Reuters, 3 CUTRIC, 4 BBC
16
16Projected market adoption rates of ZEBs1 highlight
transition will take time
North American Heavy-Duty Transit UK Transit
45%
37%
30%
20% 21%
15%
11%
7% 8%
5%
2019 2020 2021E 2022E 2023E 2019 2020 2021E 2022E 2023E
North American Coach North American Cutaway
8%
4% 5% 4%
1% 2% 0% 1% 1% 2%
2019 2020 2021E 2022E 2023E 2019 2020 2021E 2022E 2023E
1 Percentage of annual deliveries based on management estimates
If the adoption rate increases, NFI is already there
17NFI is pioneering automated bus technology
New Flyer Xcelsior AV™ ADL’s Automated Double Deck
North America’s first SAE Level 4 (SAE J3016) Automated Heavy- UK’s first Automated Heavy-Duty Transit Bus; pilot project with
Duty Transit Bus leading customer Stagecoach for depot applications
Launched January 2021 Launched Glasgow, Scotland pilot in 2019
18FY 2020: Income statement and balance sheet
FY 2020 Performance FY 2020 Cash Flow & Liquidity
FY 2019 FY 2020 Cash Flow ($M)
Sales $2,893.4M $2,419.2M FY 2019 FY 2020
$322.2 Adjusted EBITDA $322.2 $157.7
Adjusted 11.1% 6.5% Interest Expense ($50.5) ($61.8)
EBITDA ROS $157.7 ROS Current Income Tax ($61.3) ($26.6)
Cash Capital Expenditures plus Lease ($50.0) ($44.6)
EPS (reported) $0.93 ($2.52) Proceeds from disposition of property $0.2 $2.8
Other - -
EPS (Adjusted) $1.65 ($0.75) Free Cash Flow (USD) $160.4 $27.5
FX Rate 1.3180 1.2651
Free Cash Flow (CAD) $211.4 $34.7
Adjusted Dividends (CAD) $105.5 $53.1
FY 2020 Revenue
EBITDA Payout Ratio 49.9% 153.0%
Manufacturing $2,017.7M $102.0M
Liquidity
Aftermarket $401.5M $66.7M
FY 2019 FY 2020
Corporate ($11.0M) Liquidity $209.3 $233.5
19NFI Forward Update
Timing for 2020-2023 Benefits
Cumulative $10.0
($M) $8.6
$6.8 All NFI
Forward
$60 $67 Initiatives
$1.0 $47 At or Above
Targets
$17 In Year
~$30M
In Year
~$13M
In Year
~$7M
2020A 2021E 2022E 2023E Cash Flow on
Track for
Adjusted EBITDA Free Cash Flow (FCF)
$10M+
• Solid NFI Forward progress in Fiscal 2020:
• $17.0 million in Adjusted EBITDA savings from 2019 levels;
additional $1.0 million in annualized Free Cash Flow generation
202021 Guidance
Revenue • Driven by market recovery in NA Bus and
Coach and UK transit
$2.8 billion to $2.9 billion • Continued growth of ARBOC in cutaway and
ZEBs expected to make up 20% to 25% medium-duty markets
of 2021 manufacturing revenue • ADL’s international expansion in Europe and APAC
• Expecting Private markets begin to return to pre-
Adjusted EBITDA COVID levels by 2023
$220M to $240M • Significant volume drop-through with cost base
reductions generated from NFI Forward initiative
Cash Capex including NFI Forward • Estimating $35M for maintenance capex
• Remainder for NFI Forward and other smaller growth
$50M projects
Adjusted ETR • Minimum US taxes drive higher Adjusted Effective
Tax Rate (“ETR”)
~31% • Anticipating improvement beyond 2021
Seasonality • Q1, Q2 and Q3 will be 13-week periods
• Q4 will be a 14-week period
2021: Decline in Q1; YoY growth in Revenue
• ADL and MCI expect higher Q3/Q4 deliveries
and Adjusted EBITDA in Q2, Q3 and Q4
21Longer-term financial targets for 2025
Revenue • Driven by market recovery in NA Bus and
$3.9 billion to $4.1 billion Coach and UK transit
ZEBs expected to make up 35% to 40% • Continued growth of ARBOC in cutaway and medium-
of manufacturing revenue duty markets
• ADL’s international expansion in Europe and APAC
Adjusted EBITDA • Private markets begin to return to pre-COVID
levels in 2023
$400M to $450M
• Significant volume drop-through with cost base
reductions generated from NFI Forward initiative
• Viewed as conservative target
ROIC • Adj. EBITDA performance combined with realizing
upon benefits of investments made in facilities,
>12% products, acquisitions
• Potential tax upside may drive higher ROIC
22Capital allocation priorities
1 DEBT MANAGEMENT & LEVERAGE REDUCTION
INVEST IN HIGHEST RETURN PROJECTS: EPS expansion comes from funding
2 highest ROIC projects
3 DIVIDENDS: Provide dividends to shareholders, as we have since 2005
ACQUISITIONS: Continue to acquire companies that provide diversification,
4 channel expansion, technology, and geography advantages
5 SHARE REPURCHASE (NCIB): Depends on stock price to value
Focused approach to drive value creation
23NFI Investment Thesis
Market dynamics position bus and coach transition to EV; NFI is the industry’s
leader with the deepest customer relationships and in prime position to capitalize Solid Q4 and
FY 2020
on the zero-emission evolution (ZEvolutionTM) results
Strong government support in all core markets
Significant
NFI was built through decades of investment, innovation and product development deleveraging
in Q1 2021
NFI has the largest manufacturing capacity (8,000 EUs annually), largest installed
fleet and most reliable aftermarket network Continued
culture of
innovation
NFI is a turnkey mobility solutions provider supporting the transition from legacy to
EV propulsion: infrastructure solutions, vehicles, telematics, parts support
Focus on NFI
Forward cost
Today, NFI’s Backlog is 5.8% ZEBs, and 30% of our total Public bid universe is savings
ZEBs, driving profitable growth
Management is positioning NFI for market recovery with a streamlined, leaner Deliver 2021
guidance
operation to drive volume leverage through NFI Forward
2021 viewed as a transition year with COVID-19 pandemic continuing to impact
end markets; will take time to recover to pre-COVID-19 levels, but government Recovery and
growth drive
stimulus and vaccines will assist recovery 2025 targets
Leading the ZEvolution. 2025 Targets highlight strong annual growth: Adjusted
EBITDA $400M to $450M, with 35% to 40% of production coming from ZEBs
24Appendices
252007 5,055
-
5,000
10,000
15,000
20,000
25,000
30,000
35,000
Q4 2011 2008 5,284
Q2 2012
2009 6,032
Q4 2012
Q2 2013 2010 5,933
Q4 2013
2011 5,154
Q2 2014
Bids in Process
Q4 2014 2012 5,109
Q2 2015
2013 5,010
Q4 2015
Q2 2016 2014 5,128
Q4 2016
2015 5,373
Bids Submitted
Q2 2017
Q4 2017 2016 5,795
Q2 2018
2017 6,336
Q4 2018
North American Heavy-Duty Transit1
Q2 2019 North American Public Bid Universe (public)3 2018 6,504
Q4 2019 2019
5 Year Forecast
6,717
(1) Metro Magazine and Management Estimates. Final market data for 2020 not yet available
Q2 2020
2020E 5,320 6,062
Q4 2020
Core markets annual deliveries
2007 2,544 2007 1,852
2008 3,220 2008 1,825
(4) Source: SMMT
2009 3,532 2009 1,581
2010 2,284 2010 1,184
2011 2,571 2011 1,510
(2) Source: American Bus Association
2012 3,025 2012 1,648
(3) Management estimates and databases
2013 2,731 2013 1,783
2014 2,485 2014 1,918
2015 2,956 2015 2,274
2016 2,734 2016 2,357
2017 2,536 2017 2,470
2018 2,017 2018 2,305
2019 1,799 2019 2,053
United Kingdom Bus & Coach (public and private)4
North American Motor Coach (public and private)2
2020 1,376 2020 860
26Backlog and Q4 2020 New Vehicle Deliveries
BACKLOG – FIRM AND OPTION BACKLOG – TIMING BACKLOG – BY PRODUCT
Medium-
Firm Options Duty and
Low-Floor
12,157 Cutaway
10,833 10,742 4%
8,504
7,971
7,184 6,518 Motor
5,264 Coach
14%
4,186 3,649 4,224 3,240 Q4 ‘20 YTD Option Conversion Rate = 38%
HD Transit
82%
2017 2018 2019 2020 Q4
Options by year of expiry (2) Options for ARBOC vehicles are held by dealers, rather than the
(1) ADL backlog added in Q2 2019. ADL backlog not included in historic 2017 and
2018 figures operator, and are not included as an option in the NFI backlog.
HEAVY-DUTY TRANSIT MOTOR COACH MEDIUM-DUTY /
LOW-FLOOR CUTAWAY
3,931 420
3,318 348
Q4 ’20 EUs
1,036
1,347 633
913 -16% 389 109 96
-32% YOY -43%
221 -39%
21%
YOY YOY
-12% YOY
YOY
YOY
Q4 '19 Q4 '20 Q4 '19 Q4 '20 Q4 '19 Q4 '20 Q4 '19 Q4 '20 Q4 '19 Q4 '20 Q4 '19 Q4 '20
YTD YTD YTD YTD YTD YTD
Strong Bid Activity Will Help Drive Future Growth
27Net Earnings and Adjusted Net Earnings
Net Earnings ($M) Adjusted Net Earnings ($M)
Q4 '19¹ $34 $0.55 per share Q4 '19 $31 $0.49 per share
Q4 '20¹ $8 $0.14 per share Q4 '20 $8 $0.13 per share
LTM Q4 '19 $58 $0.93 per share LTM Q4 '19 $102 $1.65 per share
LTM Q4 '20 ($158) ($2.52) per share LTM Q4 '20 ($47) ($0.75) per share
Net Earnings to Adjusted Net Earnings Reconciliation(1)
($2.52)
Per Share
($0.75)
Per Share
Net earnings Strategic FX Loss (Gain) Employment, COVID 19 Goodwill Derivative Other Income Tax Adjusted Net
2020 YTD Costs and Compensation Impairment Financial Earnings 2020
Acquisition and Instruments YTD
Related Restructuring
Accounting
FY Impact of COVID & Restructuring (NFI Forward) Impacting Reported Results
(1) Fiscal 2019 figures are not adjusted for impact of IFRS 16 – see slide 4 for details. Detailed quarterly reconciliations for Fiscal 2019 and Fiscal 2018 provided in the Appendix
28Appendix: Non-IFRS Reconciliation (2020)
Reconciliation of IFRS to non-IFRS
As of December 27 2020
First Second Third Forth
In '000 Quarter Quarter Quarter Quarter Full Year
Net Sales $ 710,384 $ 333,334 $ 663,922 $ 711,523 $ 2,419,163
Net Earnings $ (67,239) $ (74,049) $ (24,913) $ 8,465 $ (157,736)
% of net sales -9.5% -22.2% -3.8% 1.2% -6.5%
Adjustment, Gross
Restructuring and Other Corporate Initiatives $ 22 $ 2,307 $ 25,428 $ 1,180 $ 28,937
Goodwill Impairment $ 50,790 $ - $ - $ - $ 50,790
Derivative related $ 23,508 $ 454 $ (2,446) $ (4,243) $ 17,273
Foreign exchange loss/gain $ (43) $ (2,164) $ (3,608) $ (3,235) $ (9,050)
Equity settled stock-based compensation $ 14 $ 551 $ 597 $ 608 $ 1,770
Asset related $ 163 $ 229 $ (191) $ (257) $ (56)
Employment related (past service costs) $ (463) $ 48 $ 1 $ 6 $ (408)
COVID-19 $ - $ 17,557 $ 24,392 $ 5,413 $ 47,362
Other $ (56) $ (30) $ 233 $ 37 $ 184
Income taxes $ (7,176) $ (5,492) $ (13,767) $ 202 $ (26,233)
Net Earnings - Adjusted $ (480) $ (60,589) $ 5,726 $ 8,176 $ (47,167)
% of sales -0.1% -18.2% 0.9% 1.1% -1.9%
Adjustments:
Income taxes $ 11,754 $ (7,415) $ 10,757 $ 12,784 $ 27,880
Finance costs $ 14,657 $ 15,633 $ 18,028 $ 17,871 $ 66,189
Amortization $ 30,140 $ 28,145 $ 26,374 $ 26,125 $ 110,784
Adjusted EBITDA $ 56,071 $ (24,226) $ 60,885 $ 64,956 $ 157,686
% of net sales 7.9% -7.3% 9.2% 9.1% 6.5%
29Appendix: Non-IFRS Reconciliation (2019)
Reconciliation of IFRS to non-IFRS
Year Ending December 29, 2019
First Second Third Fourth Full
In '000 Quarter Quarter Quarter Quarter Year
Net Sales $ 566,995 $ 683,353 $ 725,347 $ 917,741 $ 2,893,436
Net Earnings $ 16,149 $ 8,507 $ (1,085) $ 34,127 $ 57,698
% of net sales 2.8% 1.2% -0.1% 3.7% 2.0%
Adjustments, Gross:
Restructuring and Other Corporate Initiatives $ 5 $ 13,338 $ 342 $ (251) $ 13,434
Acquisition related costs $ - $ 8,690 $ 20,158 $ 2,156 $ 31,004
Derivative related $ 9,447 $ 12,263 $ 5,047 $ (4,454) $ 22,303
Foreign exchange loss/gain $ (935) $ (6,645) $ 4,993 $ (1,640) $ (4,227)
Equity settled stock-based compensation $ 419 $ 558 $ 152 $ 437 $ 1,566
Asset related $ (20) $ 15 $ (93) $ 52 $ (46)
Employment related (past service costs) $ - $ - $ (1,671) $ 70 $ (1,601)
Tax adjustments $ - $ 3,794 $ - $ 300 $ 4,094
Net Earnings - Adjusted $ 25,065 $ 40,520 $ 27,843 $ 30,797 $ 124,225
% of net sales 4.4% 5.9% 3.8% 3.4% 4.3%
Adjustments:
Income taxes $ 7,655 $ 5,869 $ 2,355 $ 26,118 $ 41,997
Finance costs $ 8,601 $ 12,334 $ 14,615 $ 15,826 $ 51,376
Amortization $ 18,981 $ 22,399 $ 32,055 $ 31,134 $ 104,569
Adjusted EBITDA $ 60,302 $ 81,122 $ 76,868 $ 103,875 $ 322,167
% of net sales 10.6% 11.9% 10.6% 11.3% 11.1%
30Forward-Looking Statements
Certain statements in this presentation are “forward-looking statements”, which reflect the current expectations of management
regarding the Company's future growth, financial performance and financial position and the Company’s strategic initiatives, plans,
business prospects and opportunities, including the duration, impact of and recovery from the COVID-19 pandemic. A number of factors
and risks may cause actual results to differ materially from the results discussed in the forward-looking statements (including factors
relating to the Company’s “NFI Forward” initiatives, the global COVID-19 pandemic, and the Company’s January 11, 2021 financial
guidance (the “Guidance”). For more detail regarding the assumptions, factors and risks relating to these “forward looking statements”,
please refer to the Company’s press release and management discussion and analysis (“MD&A”) dated March 4, 2021 and the factors
and risks contained in its Annual Information Form and other materials filed with the Canadian securities regulatory authorities which are
available on SEDAR at www.sedar.com. These forward-looking statements are made as of the date of this presentation and the
Company assumes no obligation to update or revise them to reflect new events or circumstances, except as required by applicable
securities laws.
All figures in U.S. dollars unless otherwise noted.
Non-IFRS Measures
References to “Adjusted EBITDA” are to earnings before interest, income taxes, depreciation and amortization after adjusting for the
effects of certain non-recurring and/or non-operations related items that do not reflect the current ongoing cash operations of the
Company as described in the Company’s disclosure documents available on SEDAR at www.sedar.com. References to "ROIC" are to
net operating profit after taxes (calculated as Adjusted EBITDA less depreciation of plant and equipment, depreciation of right-of-use
assets and income taxes at a rate of 31%) divided by average invested capital for the last 12-month period (calculated as to
shareholders’ equity plus long-term debt, obligations under leases, other long-term liabilities and derivative financial instrument liabilities
less cash).
Management believes Adjusted EBITDA and ROIC are useful measures in evaluating the performance of the Company. However,
Adjusted EBITDA and ROIC are not recognized earnings measures under IFRS and do not have standardized meanings prescribed by
IFRS. Readers of this press release are cautioned that Adjusted EBITDA or ROIC should not be construed as an alternative to net
earnings or loss or cash flows from operating activities determined in accordance with IFRS as an indicator of NFI’s performance.
Historical reconciliations of net earnings to Adjusted EBITDA has been provided in the Company’s disclosure documents available on
SEDAR at www.sedar.com. NFI’s method of calculating Adjusted EBITDA and ROIC may differ materially from the methods used by
other issuers and, accordingly, may not be comparable to similarly titled measures used by other issuers.
31Appendix: Key Definitions
• Adjusted EBITDA: Earnings before interest, income taxes, depreciation and amortization after adjusting for the effects of certain non-
recurring and/or non-operations related items that do not reflect the current ongoing cash operations of the Company. These
adjustments include gains or losses on disposal of property, plant and equipment, fair value adjustment for total return swap, unrealized
foreign exchange losses or gains on non-current monetary items and forward foreign exchange contracts, costs associated with
assessing strategic and corporate initiatives, past service costs and other pension costs, non-recurring restructuring costs, fair value
adjustment to acquired subsidiary company's inventory and deferred revenue, proportion of the total return swap realized, equity settled
stock-based compensation, recovery of currency transactions, prior year sales tax provision, and release of provision related to
purchase accounting
• Free Cash Flow: Defined as net cash generated by operating activities adjusted for changes in non-cash working capital items, interest
paid, interest expense, income taxes paid, current income tax expense, effect of foreign currency rate on cash, defined benefit funding,
non-recurring transitional costs relating to business acquisitions, past service costs, costs associated with assessing strategic and
corporate initiatives, defined benefit expense, cash capital expenditures, proportion of the total return swap realized, proceeds on
disposition of property, plant and equipment, gain received on total return swap settlement, fair value adjustment to acquired subsidiary
company's inventory and deferred revenue and principal payments on capital leases.
• Return on Invested Capital (“ROIC”): Defined as net operating profit after taxes (calculated as Adjusted EBITDA less depreciation of
plant and equipment and income taxes at the expected effective tax rate) divided by average invested capital for the last twelve-month
period (calculated as to shareholders’ equity plus long-term debt, obligations under finance leases, other long-term liabilities, convertible
debentures and derivative financial instrument liabilities less cash).
• Adjusted Net Earnings: Defined as net earnings after adjusting for the after tax effects of certain non-recurring and/or non-operational
related items that do not reflect the current ongoing cash operations of the Company including: fair value adjustments of total return
swap, unrealized foreign exchange loss or gain, unrealized gain or loss on the interest rate swap, portion of the total return swap
realized, costs associated with assessing strategic and corporate initiatives, non-recurring costs or recoveries relating to business
acquisition, fair value adjustment to acquired subsidiary company's inventory and deferred revenue, equity settled stock-based
compensation, gain or loss on disposal of property, plant and equipment, gain on bargain purchase option, past service costs, recovery
on currency transactions, prior year sales tax provision, gain on release of provision related to purchase accounting.
• Adjusted Net Earnings per Share: Defined as Adjusted Net Earnings divided by the average number of Shares outstanding.
3233
You can also read