Q2 2020 Results Presentation - 27 August 2020 - OCI NV

Page created by Norman Gibson
 
CONTINUE READING
Q2 2020 Results Presentation - 27 August 2020 - OCI NV
Q2 2020 Results Presentation

27 August 2020
Q2 2020 Results Presentation - 27 August 2020 - OCI NV
Disclaimer
This presentation ("Presentation") has been prepared by OCI N.V. (the "Company"). By accessing and reading the Presentation you agree to be bound by the following limitations:

This Presentation does not constitute or form a part of, and should not be construed as, an offer for sale or subscription of or solicitation of any offer to purchase or subscribe for any securities in any jurisdiction, and neither this
Presentation nor anything contained herein shall form the basis of, or be relied upon in connection with, or act as an inducement to enter into, any contract or commitment whatsoever.

This Presentation may not be distributed to the press or to any other persons, and may not be redistributed or passed on, directly or indirectly, to any person, or published, in whole or in part, by any medium or for any purpose.
The unauthorized disclosure of this Presentation or any information contained in or relating to it or any failure to comply with the above restrictions may constitute a violation of applicable laws. At any time upon the request of
the Company the recipient must return all copies of this Presentation promptly.

The information contained in this Presentation has not been independently verified and no representation or warranty, express or implied, is made as to, and no reliance should be placed on, the fairness, accuracy, completeness,
reasonableness or correctness of the information or opinions contained herein. Neither the Company nor any of its holding companies, subsidiaries, associated undertakings, controlling persons, shareholders, respective directors,
officers, employees, agents, partners or professional advisors shall have any liability whatsoever (in negligence or otherwise) for any direct, indirect or consequential loss howsoever arising from any use of this Presentation or
otherwise arising in connection with this Presentation. The information contained in this Presentation is provided as at the date of this Presentation and is subject to change without notice and the Company expressly does not
undertake and is not obliged to review, update or correct the information at any time or to advise any participant in any related financing of any information coming to the attention of the Company.

The information in this Presentation does not constitute investment, legal, accounting, regulatory, taxation or any other advice, and this Presentation does not take into account your investment objectives or legal, accounting,
regulatory, taxation or financial situation or other needs. You are solely responsible for forming your own opinions and conclusions on such matters and for making your own independent assessment of the Presentation.

This Presentation does not purport to contain all information that may be required by any party to assess the Company and its subsidiaries and affiliates, its business, financial condition, results of operations and prospects for any
purpose. This Presentation includes information the Company has prepared on the basis of publicly available information and sources believes to be reliable. The accuracy of such information has been relied upon by the
Company, and has not been independently verified by the Company. Any recipient should conduct its own independent investigation and assessment as to the validity of the information contained in this Presentation, and the
economic, financial, regulatory, legal, taxation and accounting implications of that information.

Statements made in this Presentation may include forward-looking statements. These statements may be identified by the fact that they use words such as "anticipate", "estimate", "should", "expect", "guidance", "project",
"intend", "plan", "believe", and/or other words and terms of similar meaning in connection with, among other things, any discussion of results of operations, financial condition, liquidity, prospects, growth, strategies or
developments in the industry in which the Company and its subsidiaries operate. Such statements are based on management's current intentions, expectations or beliefs and involve inherent risks, assumptions and uncertainties,
including factors that could delay, divert or change any of them. Forward-looking statements contained in this Presentation regarding trends or current activities should not be taken as a representation that such trends or
activities will continue in the future. Actual outcomes, results and other future events may differ materially from those expressed or implied by the statements contained herein. Such differences may adversely affect the
outcome and financial effects of the plans and events described herein and may result from, among other things, changes in economic, business, competitive, technological, strategic or regulatory factors and other factors
affecting the business and operations of the company. Neither the Company nor any of its affiliates is under any obligation, and each such entity expressly disclaims any such obligation, to update, revise or amend any forward-
looking statements, whether as a result of new information, future events or otherwise. You should not place undue reliance on any such forward-looking statements, which speak only as of the date of this Presentation. The
Company does not: (i) accept any liability in respect of any forward-looking statements; or (ii) undertake to review, correct or update any forward-looking statement whether as a result of new information, future events or
otherwise. It should be noted that past performance is not a guide to future performance. Interim results are not necessarily indicative of full-year results.

Certain data included in the Presentation are "non-IFRS" measures. These non-IFRS measures may not be comparable to similarly titled financial measures presented by other entities, nor should they be construed as an
alternative to other financial measures determined in accordance with International Financial Reporting Standards or any other generally accepted accounting principles. Although the Company believes these non-IFRS financial
measures provide useful information to users in measuring the financial performance and condition of its business, users are cautioned not to place undue reliance on any non-IFRS financial measures and ratios included in this
Presentation.

Each recipient should be aware that some of the information in this Presentation may constitute "inside information" for the purposes of any applicable legislation and each recipient should therefore take appropriate advice as to
the use to which such information may lawfully be put.

The distribution of this Presentation in certain jurisdictions may be restricted by law. Persons into whose possession this Presentation comes are required to inform themselves about and to observe any such restrictions. No
liability to any person is accepted by the Company, including in relation to the distribution of the Presentation in any jurisdiction.

                                                                                                                                                                                                                                               2
Q2 2020 Results Presentation - 27 August 2020 - OCI NV
Safety First: Commitment to Zero Injuries
    OCI is committed to providing a safe and healthy workplace for all employees and stakeholders by implementing the
    highest international safety standards to avoid any potential risks to people, communities, assets or the environment

▪       Goal to achieve leadership in safety and health standards by fostering culture of zero injuries at allConversion
                                                                                                               productioninto
                                                                                                                          facilities
                                                                                                                               FCF2019
                                                                                                                             Q4
▪       OCI has achieved some of the lowest numbers in our global industry in the past 12 months
▪       12-month rolling recordable incident rate at the end of June was 0.23 incidents per 200,000 manhours
                                                                                                                            End-2019
                           Total TRIR (Total Reportable Incident Rate)1,2                                     COVID-19

0.50
0.45

0.40

0.35                                                                                     ▪ Health and Safety First
0.30
                                                                                         ▪ Production at our plants has not been disrupted by
0.25                                                                                       COVID-19 challenges
0.20
                                                                                         ▪ Plants are heavily automated, essential on-site
0.15
                                                                                           operating and logistics personnel minimal
0.10

0.05

0.00
           Jan Feb Mar Apr May Jun Jul Aug Sep Oct Nov Dec Jan Feb Mar Apr May Jun Jul
                                      2019                                    2020

                                                                                                                                                3
    1   Includes both employees and contractors; 2 Per 200,000 hours worked
Q2 2020 Results Presentation - 27 August 2020 - OCI NV
OCI N.V.’s Commitment to a More Sustainable World
 We seek to provide sustainable solutions to our agricultural and industrial customers. We are committed to investing in a greener
                 future to create value for our communities, our customers, our employees and our shareholders

                                                                                                                                     4
Q2 2020 Results Presentation - 27 August 2020 - OCI NV
Investment Highlights| OCI at a Glance
                    What Differentiates OCI                                     Performance Drivers

 Global leader in nitrogen and methanol with excellent      ▪ Substantial reduction in execution risk, expect healthy volume
 diversification – product & geographical                     ramp-up in 2020
                                                                 ✓    Significant growth capex program completed in 2019
                                                                 ✓    Ramp-up of new methanol capacities on-going
                                                                 ✓    Operational excellence resulting in higher asset
 Delivery of volume ramp-up post end of capex program
                                                                      utilization, following heavy turnaround scope last 15
                                                                      months across various nitrogen plants
                                                                 ✓    Extended turnaround OCIB and BioMCN successfully
                                                                      completed in Feb and Jun 2020 respectively, resulting in
 Robust cash conversion metrics and deleveraging focus                high and steady utilization rates
                                                                 ✓    JV with ADNOC (Fertiglobe) adds to consolidated platform

 Favourable position on the cost curve with state-of-the-   ▪ Benign gas pricing environment in both US and Europe
 art asset base

                                                            ▪ Significant upside potential on price recovery from trough levels
 Highly strategic locations allow for enhanced netback
 pricing globally                                           ▪ Demonstrated commitment to financial discipline and
                                                              deleveraging
                                                                 ✓    Significant capital structure simplification achieved
                                                                 ✓    Will continue to prioritize FCF towards deleveraging
 Supported by positive industry fundamentals
                                                                 ✓    Commitment to 2x net leverage target through the cycle

                                                                                                                                  5
Q2 2020 Results Presentation - 27 August 2020 - OCI NV
Overview Q2 2020 Results: Resilient Earnings and Deleveraging
                                                                           Highlights
                                 Summary                                                                                Key Financials1) and KPIs
                                                                                                                                  Q2 ‘20        Q2 ‘19       %Δ        H1 ‘20       H1 ‘19      %Δ
   Own-produced volumes sold +6% in Q2 2020 vs. Q2 2019
                                                                              Revenue                                              875.4         953.5      (8%)     1,686.5       1,550.0       9%
   •   Nitrogen volumes +8%, inclusion of Fertil in consolidated results      Gross Profit                                         126.7         165.4     (23%)       204.0        217.9      (6%)
   •   Methanol volumes decreased 11%                                         Gross profit margin                                 14.5%         17.3%                 12.1%         14.1%

   Own-produced volumes sold +26% in H1 2020 vs. H1 2019                      Adjusted EBITDA2)                                    219.5         275.1     (20%)       412.5        404.4        2%
                                                                              EBITDA2)                                             221.4         221.6      (0%)       397.5        343.8      16%
   •   Like-for-like, excluding Fertil, +7%                                   EBITDA margin                                       25.3%         23.2%                 23.6%         22.2%
                                                                              Adj. net income (loss) attr. to shareholders         (19.9)         36.9       nm       (101.9)       (45.3)       nm
                                                                              Net income (loss) attr. to shareholders               (2.4)         19.9       nm        (83.8)       (61.3)       nm
   Best-in-class safety record
   •   12-month rolling recordable incident rate 0.23 incidents per           Earnings / (loss) per share ($)

       200,000 manhours                                                       Basic earnings per share                            (0.011)        0.095       nm       (0.400)      (0.293)       nm
                                                                              Diluted earnings per share                          (0.011)        0.095       nm       (0.400)      (0.293)       nm

                                                                                                                              30-Jun ‘20    31 Dec ‘19       %Δ
   Summary of Q2 and H1 2020 performance                                      Total Assets                                        8,962.1      9,419.6      (5%)
   •   Results reflect increase in volumes sold and benefits from low gas     Gross Interest-Bearing Debt                         4,484.8      4,662.3      (4%)
       prices, offset by lower selling prices YoY                             Net Debt                                            3,839.7      4,061.9      (5%)

   •   Revenues -8% and adj. EBITDA -20% in Q2 2020                                                                               Q2 ‘20        Q2 ‘19       %Δ        H1 ‘20       H1 ‘19      %Δ
   •   Revenues +9% and adj. EBITDA 2% in H1 2020                             Free cash flow3)                                     191.1         150.9       27%       105.7         135.0    (22%)

   •   Adjusted net loss of $20 million in Q2 2020                            Capital Expenditure                                    68.1         48.7       40%       163.8         108.4      51%
                                                                               Of which: maintenance capital expenditure             51.9         26.7       94%       142.6          45.3    215%
   •   FCF $191 million before growth capex during the quarter
                                                                              Sales volumes (‘000 metric tons)4)
   •   Net debt $3.84 billion as of 30 Jun 2020, a reduction of $222
                                                                              OCI Product                                         3,264.7      3,084.3        6%      6,002.5      4,778.9      26%
       million compared to 31 Dec 2019
                                                                              Third Party Traded                                   683.3         488.6       40%      1,235.6        964.0      28%
                                                                              Total Product Volumes                               3,948.0      3,572.9       10%      7,238.1      5,742.9      26%

                                                                               1) Unaudited
   Outlook:                                                                    2) OCI N.V. uses Alternative Performance Measures (‘APM’) to provide a better understanding of the underlying
   •   Selling prices for urea and methanol have rebounded significantly       developments of the performance of the business. The APMs are not defined in IFRS and should be used as
                                                                               supplementary information in conjunction with the most directly comparable IFRS measures. A detailed
       since reaching trough levels in Q2                                      reconciliation between APM and the most directly comparable IFRS measure can be found in this report
                                                                               3) Free cash flow is an APM that is calculated as cash from operations less maintenance capital expenditures less
   •   Outlook for end markets has recently improved                           distributions to non-controlling interests plus dividends from non-controlling interests, and before growth capital
                                                                               expenditures and lease payments
                                                                               4) Fully consolidated, not adjusted for OCI ownership stake in plants, except OCI’s 50% share of Natgasoline volumes
                                                                                                                                                                                                      6
Q2 2020 Results Presentation - 27 August 2020 - OCI NV
Financial Highlights – Record Volumes, Prices Reach Trough Levels Q2
                                      Total own-produced volumes sold by product (million metric tons) Q2'20 vs Q2'19

                               +45%

                                      1.24                 +8%
               -41%                                                                    +8%
                                                                                                                       -11%
                            0.86
                                                                 0.67                                                                                             0%
         0.59                                       0.62                                                                               -11%
                                                                                0.46     0.50
                                                                                                                0.40     0.35
                     0.35
                                                                                                                                                           0.13      0.13
                                                                                                                                0.03         0.03

          Ammonia                  Urea                    CAN                         UAN                        Methanol        Melamine                        DEF

                                                                        Benchmark prices Q2'20 vs Q2'19

                                                Nitrogen                                                                                                  Methanol

        -16%                       -18%                          -15%                              -20%                                      -25%                             -27%
  227                       274                            193                               249                                       421                              350
               190                        226                           164                               198                                       316                              255

 Ammonia FOB                  Urea FOB                     CAN Germany                   UAN US Midwest                            US Methanol CP                  EU Methanol CP
Middle East ($/mt)           Egypt ($/mt)                    (EUR/mt)                        ($/mt)                                    ($/mt)                         (EUR/mt)

                                                                              Q2’19           Q2’20
                                                                                                                                                                                           7
Q2 2020 Results Presentation - 27 August 2020 - OCI NV
Net Debt Reduced by $222 Million
                                                            Net Debt bridge H1 ‘20 ($ million)

                                                                         -222

 Net Debt        Reported    Net Operating         Capex      Net Financing     Taxed Paid   Cash Received     Finance   Other   Net Debt
 31 Dec 19        EBITDA     Working Capital   (Maintenance +   Expense                      ADNOC Closing      Lease            30 Jun 20
                                Change            Growth)        (Cash)                       Settlement      Payments

• FCF before growth capex of $191 million during Q2 2020 and $106 million during H1 2020
         • Reversal of working capital in second quarter from the high seasonal levels in the first quarter
         • Offset by capex and semi-annual interest payments in Q2
• Cash consideration received in Q1’20 from ADNOC ($167m) related to the acquisition of Fertil
• Net debt reduced by $128 Million during Q2 2020 and $222 million during H1 2020

                                                                                                                                             8
Q2 2020 Results Presentation - 27 August 2020 - OCI NV
Capital Expenditure and Production Capacity

                             Capex and production capacity                                                     Capex and production capacity
                                                                                                                    Conversion intoQ4
                                                                                                                                    FCF2019

Total capex (US$ m)                                                        Total capacity (mtpa)                                    End-2019

    1,200                                                                                  18

                                                                                           16      ▪ Growth capital expenditure program finalized in
    1,000                                                                                            2019
                                                                                           14
                                                                                                   ▪ Production capacity has doubled from c.8m tons
      800                                                                                  12        per annum in 2015 to c.16 million in 2020

                                                                                           10
      600
                                                                                           8

      400                                                                                  6

                                                                                           4
      200
                                                                                           2

        0                                                                                  0
              2015    2016          2017             2018           2019         2020

                               Production capacity          Capex

                                                                                                                                                       9
Q2 2020 Results Presentation - 27 August 2020 - OCI NV
OCI is Well-Placed to Benefit from Recovery of Selling Prices
                                                                        Key Themes

 Volume growth in 2020                                                                                                                End-2019

 o   Growth capital expenditure program complete
 o   Ramp-up of new methanol capacities on-going
 o   Inclusion of Fertil
 o   Focus on operational excellence

 Significant upside from recovery in selling prices
 o   Outlook for OCI’s end markets has become more positive in recent months:
           o   Strong demand from major importing countries, recent strengthening of outlook for US, increases in global corn demand
           o   Industrial nitrogen markets recovering
           o   Methanol demand strengthening: higher Methanol-to-Olefins utilization rates in China and recovery of global downstream demand
 o   Selling prices reached trough levels in Q2 2020, with some recovery in Q3: methanol up >50% and urea >30% up from recent lows
 o   Partial recovery of $25 / ton increase for all products can add >$330m to group adj. EBITDA on an annual basis, all else equal

 Cash conversion helped by favourable metrics
 o   Resilient Q2 and H1 results supported by record volumes, dand espite selling prices reaching trough cycle levels during the quarter
 o   Reduction of net debt by $222 million in H1 2020
 o   High netbacks as result of OCI’s strategic locations
 o   OCI is one of lowest cost producers globally of both nitrogen fertilizers and methanol
 o   Capex at sustainably low levels
 o   Optimization of capital structure results in lower cash interest
                                                                                                                                                 10
OCI - Overview

                 11
Nitrogen Production Capacity and Commercial Footprint
                                                                                        Nitrogen Footprint

          Iowa Fertilizer Company (IFCo) - Iowa, US                                                                                               Egyptian Fertilizer Co (EFC) – Egypt
▪ Production and sales started                                                                                                          ▪ Acquired: 2008
  April 2017
                                                                                                                                          Product              ktpa
 Product2                  ktpa                                                                                                           Urea                 1,648
 Ammonia (net)              195
 UAN                       1,757
 Urea                       438
 DEF                       1,019
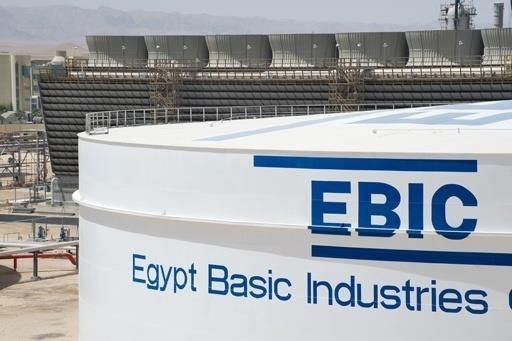
                                                                                                                                              Egypt Basic Industries Corp (EBIC) – Egypt
                               N-7 JV
                                                                                                                                        ▪ Acquired: 2009
▪ Established: May 2018
▪ 50/50 JV between OCI and Dakota
  Gasification Company
▪ Ammonia, Urea, UAN, and DEF
▪ Since Jan 2020 exclusive marketer of
  Dyno Nobel products in North America                                                                                                    Product              ktpa
                                                                                                                                          Ammonia               730

                  OCI Nitrogen – Netherlands                                            Sorfert Algerie – Algeria                                           Fertil (Abu Dhabi)
▪ Acquired: 2010                                                        ▪ Commissioned: 2013                                             ▪ Commissioned: 1980
                                                                                                                                           (Fertil 1) & 2009 (Fertil 2)
 Product2                    ktpa
 Ammonia (net)                350                                       Product               ktpa                                        Product                  Ktpa
 CAN                         1,549                                      Urea                  1,259                                       Urea                     2,100
 UAN                          730                                       Ammonia (net)          803
 Melamine                     219

                                                                                                 Perimeter of Fertiglobe JV (58% OCI / 42% ADNOC)

                                           Production footprint facilitates a global approach to our commercial strategy

   1   Capacities are maximum proven daily capacity (MPC) achievable x 365 days; 2 Maximum downstream capacities cannot be all achieved at the same time                                   12
Methanol Production Capacity and Commercial Footprint
                                                             United States                                                                                   Global
                  OCI Beaumont (Texas, US)                                                                                                       OCI Methanol Marketing
                                    Product              ktpa                                                                      ✓ Wholly owned subsidiary marketing OCI’s 3.0Mt of
                                    Methanol            1,0451                                                                       methanol portfolio globally
                                    Ammonia              356                                                                       ✓ The distribution platform’s global footprint and
                                                                                                                                     distribution allows it to optimize trade flows to enhance
                                                                                                                                     netback pricing
✓ Strategically located on the Texas Gulf Coast
                                                                                                                                   ✓ Distribution offices in Houston, New York and
✓ Completion of CO2-related debottlenecking project in                                                                               Amsterdam, with centralized commercial decision-
  July 2019 which adds 125ktpa, i.e. c.13% of capacity                                                                               making
  (project cost: c.$10m)

                       Natgasoline LLC (Texas, US)                                                   OCI Fuels                                               Europe
                                                                                   ✓ Wholly owned trading entity supplying                       BioMCN (The Netherlands)
                                Product               ktpa
                                                                                     biogas to OCI Beaumont to process into bio-
                                Methanol             1,825                                                                                                     Product                ktpa
                                                                                     methanol
                                                                                                                                                               Methanol (I)           496
▪   Ownership:     50%2                                                            ✓ Securing sizeable amounts of biogas from
✓ Commercial production started in June 2018                                         various landfills, anaerobic digesters and                                Methanol (II)          496
                                                                                     waste-water treatment plants
✓ One of the world’s largest methanol plants                                                                                       ▪   Acquired: 2015
                                                                                                                                   ✓ Connected to the national natural gas grid – itself
                                                                                                                                     connected to the integrated NW Europe network
                                                                                                                                   ✓ Easy logistical access to major European end markets
                                                                                                                                     via rail and sea freight from Delfzijl and road and barge
                                                                                                                                     from terminal in Rotterdam
                                                                                                                                   ✓ Winner of Dutch National Enlightenmentz Awards for
                                                                                                                                     an innovative green methanol production process
                                                                                                                                     converting carbon dioxide and hydrogen into bio-
                                                                                                                                     methanol
                                                                                                                                   ✓ BioMCN’s second line M2 started production in Q3
                                                                                                                                     2019
          1.   Includes 125ktpa added in July 2019 as a result of debottlenecking project                                                                                                    13
          2. JV   with Consolidated Energy Ltd
Flexible Production Capabilities to Maximize Production of Most Profitable
Products
Max. Proven Capacities¹
('000 metric tons)
                                                                                                                                                    Total                                         Total                        Total2)
Plant                                        Country              Ammonia Ammonia                      Urea            UAN            CAN      Fertilizer     Melamine4             DEF      Nitrogen       Methanol          OCI NV
                                                                   (Gross)  (Net)3
Iowa Fertilizer Company5                     USA                          914            195             438          1,757                -        2,390                -         1,019          3,409                -        3,409

OCI Nitrogen5                                Netherlands                1,184            350                -           730          1,549          2,629             219                -        2,848                -        2,848

Egyptian Fertilizers Company                 Egypt                        876                -        1,648                 -              -        1,648                -               -        1,648                -        1,648

Egypt Basic Industries Corp.                 Egypt                        730            730                -               -              -          730                -               -          730                -           730

Sorfert Algérie                              Algeria                    1,606            803          1,259                 -              -        2,062                -               -        2,062                -        2,062

Fertil                                       UAE                        1,205                -        2,100                 -              -        2,100                -               -        2,100                -        2,100

OCI Beaumont                                 USA                          356            356                -               -              -          356                -               -          356          1,045          1,401

BioMCN                                       Netherlands                      -              -              -               -              -             -               -               -              -          991             991

Natgasoline LLC                              USA                              -              -              -               -              -              -              -               -              -        1,825          1,825

Total MPC                                                               6,871          2,434          5,445           2,487          1,549         11,915             219          1,019        13,153           3,861         17,014

Excluding 50% of Natgasoline                                                                                                                                                                                      -913            -913

Total MPC with 50% of
                                                                        6,871          2,434          5,445           2,487          1,549         11,915             219          1,019        13,153           2,948         16,101
Natgasoline

Notes:
1 Capacities are maximum proven capacities (MPC) per line at 365 days. OCI Beaumont's capacity addition is an estimate of 2,853 tpd x 365 and BioMCN’s M2 capacity is an estimate based on 1,250 tpd x 365 days; 2 Total capacity is
not adjusted for OCI’s ownership stakes or downstream product mix limitations (see below), except OCI’s 50% stake in Natgasoline; 3 Net ammonia is estimated sellable capacity based on a certain product mix; 4 Melamine capacity
split as 164 ktpa in Geleen and 55 ktpa in China. OCI Nitrogen owns 49% of a Chinese melamine producer, and exclusive right to off-take 90%; 5 OCI Nitrogen and IFCo each cannot achieve all downstream production simultaneously
(i.e.: OCI Nitrogen cannot maximize production of UAN, CAN and melamine simultaneously, and IFCo cannot maximize production of UAN, urea and DEF simultaneously)

                                                                                                                                                                                                                                       14
Q2 2020 Details

                  15
Financial Highlights - Consolidated Statement of Income*)
$ million                                          Q2 2020    Q2 2019    H1 2020     H1 2019
Net revenue                                          875.4      953.5     1,686.5     1,550.0

Cost of Sales                                       (748.7)    (788.1)   (1,482.5)   (1,332.1)

Gross profit                                         126.7      165.4       204.0       217.9

SG&A                                                 (52.1)     (51.9)    (109.2)       (98.5)

Other Income                                          (0.4)      (0.5)       13.4         2.8

Other expense                                         (0.3)      (2.9)       (0.3)       (3.2)

Adjusted EBITDA                                      219.5      275.1       412.5       404.4

EBITDA                                               221.4      221.6       397.5       343.8

Depreciation & amortization                         (147.5)    (111.5)    (289.6)     (224.8)

Operating profit                                      73.9      110.1       107.9       119.0

Interest income                                        1.0        1.4         2.6         3.1

Interest expense                                     (68.9)     (69.8)    (118.3)     (147.9)

Other finance income / (cost)                         22.1        2.1         4.9       (13.0)

Net finance costs                                    (45.8)     (66.3)    (110.8)     (157.8)

Income from equity-accounted investees               (20.1)       1.8       (27.4)       (7.9)

Net income before tax                                  8.0       45.6       (30.3)      (46.7)

Income tax expense                                    (6.2)      (6.0)       (3.4)        4.1

Net profit / (loss)                                    1.8       39.6       (33.7)      (42.6)

Non-Controlling Interest                              (4.2)     (19.7)      (50.1)      (18.7)

Net profit / (loss) attributable to shareholders      (2.4)      19.9       (83.8)      (61.3)

* Unaudited

                                                                                             16
Financial Highlights – Reconciliation of Adjusted EBITDA and Adjusted Net Income
Reconciliation of reported operating income to adjusted EBITDA
$ million                                                         Q2 ‘20    Q2 ‘19    H1 ‘20    H1 ‘19    Adjustment in P&L

Operating profit as reported                                        73.9     110.1     107.9    119.0
Depreciation and amortization                                      147.5     111.5     289.6    224.8
EBITDA                                                             221.4     221.6     397.5    343.8
APM adjustments for:
Natgasoline                                                          2.4      33.9      23.8      42.0    OCI’s share of Natgasoline EBITDA
Unrealized result natural gas hedging                              (4.3)      10.6      (0.9)      8.7    COGS
Gain on purchase related to Fertiglobe                                 -         -    (13.3)         -    Other income
Expenses related to expansion projects                                 -       0.5       1.9       1.0    SG&A / other expenses
Other including provisions                                             -       8.5       3.5       8.9
Total APM adjustments                                              (1.9)      53.5      15.0      60.6
Adjusted EBITDA                                                    219.5     275.1     412.5    404.4

Reconciliation of reported net income to adjusted net income
$ million                                                         Q2 ‘20    Q2 ‘19    H1 ‘20    H1 ‘19    Adjustment in P&L

Reported net loss attributable to shareholders                      (2.4)     19.9     (83.8)    (61.3)
Adjustments for:
Adjustments at EBITDA level                                         (1.9)     53.5      14.9      60.6
Add back: Natgasoline EBITDA adjustment                             (2.4)    (33.9)    (23.8)    (42.0)
Result from associate (change in unrealized gas hedging Natgas)      0.7       6.6      (0.8)     (1.4)   Finance expenses
Accelerated depreciation                                             1.2          -       1.2         -   Depreciation
Impairment of PP&E                                                      -      1.9          -      1.9
Forex gain/loss on USD exposure                                    (21.0)     (6.9)    (16.3)      2.9    Finance income and expense
Non-controlling interest adjustment / release interest accrual       5.9      (1.7)       7.2     (0.8)   Interest expense / minorities
Tax effect of adjustments                                               -     (2.5)     (0.5)     (5.2)   Income tax
Total APM adjustments at net income level                          (17.5)     17.0     (18.1)     16.0
Adjusted net loss attributable to shareholders                     (19.9)     36.9    (101.9)    (45.3)

                                                                                                                                          17
Segment Information
Segment overview Q2 2020
 $ million                  Nitrogen                                                      Total                                             Total       Other       Elim.
                                                                                                     Methanol US                                                               Total
                                  US      Europe        Fertiglobe*       Elim.       Nitrogen                      Europe    Elim.**    Methanol

 Total revenues                165.3        229.9             374.2       (21.6)            747.8           97.9      49.0      (9.4)        137.5         0.5     (10.4)      875.4

 Gross profit                   27.3         43.3              47.7         0.9             119.2           (3.4)     (0.9)     11.1           6.8         0.7          -      126.7

 Operating profit               23.2         34.0              28.7         0.9              86.8           (7.5)     (1.0)     11.9           3.4      (16.3)          -          73.9

 D&A                           (34.9)       (19.6)           (66.8)            -        (121.3)            (37.9)     (6.9)     19.5         (25.3)      (0.9)          -     (147.5)

 EBITDA                         58.1         53.6              95.5         0.9             208.1           30.4       5.9      (7.6)         28.7      (15.4)          -      221.4

 Adj. EBITDA                    58.1         53.6              95.5         0.9             208.1           22.8       5.9      (2.0)         26.7      (15.3)          -      219.5

Segment overview Q2 2019
 $ million                  Nitrogen                                                      Total         Methanol                            Total       Other       Elim.      Total
                                  US      Europe        Fertiglobe*       Elim.       Nitrogen             US***    Europe    Elim.**    Methanol

 Total revenues                211.0        272.7             313.6       (38.9)            758.4          162.3      64.1     (22.8)        203.6           -      (8.5)      953.5

 Gross profit                   56.7         41.3              80.0         2.0             180.0           (6.6)      2.9      (7.1)        (10.8)      (3.8)          -      165.4

 Operating profit               54.3         30.5              69.9         2.0             156.7          (12.3)     (0.1)     (5.5)        (17.9)     (28.7)          -      110.1

 D&A                           (32.6)       (16.5)           (44.7)            -            (93.8)         (31.7)     (2.5)     17.5         (16.7)      (1.0)          -     (111.5)

 EBITDA                         86.9         47.0             114.6         2.0             250.5           19.4       2.4     (23.0)         (1.2)     (27.7)          -      221.6

 Adj. EBITDA                    86.9         48.9             114.6         2.0             252.4           34.9       2.9        2.3         40.1      (17.4)          -      275.1

* Previously Nitrogen MENA segment. Fertil consolidated from Q4 2019
** Mainly related to elimination of Natgasoline, which is included in Methanol US segment
*** Until 2019 OCI Fuels Ltd. was included in segment Methanol US. Effective 1 January 2020, OCI Fuels Ltd. will be combined with OCI Fuels B.V. in the segment Methanol Europe.
The comparative numbers of Q1 2019 are restated to reflect that change.

                                                                                                                                                                                     18
Segment Information
Segment overview H1 2020
 $ million                  Nitrogen                                                      Total                                             Total       Other      Elim.
                                                                                                    Methanol US                                                                    Total
                                  US       Europe       Fertiglobe*       Elim.       Nitrogen                     Europe    Elim.**     Methanol

 Total revenues                284.0        392.3             737.5       (33.5)        1,380.3           227.9     130.8     (29.7)         329.0        0.7      (23.5)     1,686.5

 Gross profit                   37.5         57.8             110.3         1.9             207.5          (4.6)     (2.8)      4.1           (3.3)      (0.2)          -          204.0

 Operating profit               28.9         39.4              72.0         1.9             142.2         (17.4)     (4.6)      9.2          (12.8)     (21.5)          -          107.9

 D&A                           (70.3)       (39.5)          (133.6)            -        (243.4)           (70.0)    (12.4)     38.2          (44.2)      (2.0)          -     (289.6)

 EBITDA                         99.2         78.9             205.6         1.9             385.6          52.6       7.8     (29.0)          31.4      (19.5)          -          397.5

 Adj. EBITDA                    99.2         78.9             209.1         1.9             389.1          50.2       7.8      (4.4)          53.6      (30.2)          -          412.5

Segment overview H1 2019
 $ million                  Nitrogen                                                      Total        Methanol                              Total      Other      Elim.           Total
                                  US       Europe       Fertiglobe*       Elim.       Nitrogen            US***    Europe    Elim.**      Methanol

 Total revenues                302.2        466.4             467.0       (56.0)        1,179.6           297.6     122.9     (34.5)         386.0           -     (15.6)     1,550.0

 Gross profit                   69.3         65.0              99.4        (0.5)            233.2          11.8      (9.4)    (10.9)          (8.5)      (6.8)         -           217.9

 Operating profit               60.9         44.1              80.0        (0.5)            184.5           0.9     (12.2)     (7.4)         (18.7)     (46.8)         -           119.0

 D&A                           (66.3)       (33.8)           (87.6)            -        (187.7)           (63.2)     (5.2)     33.5          (34.9)      (2.2)         -      (224.8)

 EBITDA                        127.2         77.9             167.6        (0.5)            372.2          64.1      (7.0)    (40.9)          16.2      (44.6)         -           343.8

 Adj. EBITDA                   127.2         79.8             167.6        (0.5)            374.1          72.4      (6.0)     (0.7)          65.7      (35.4)         -           404.4

* Previously Nitrogen MENA segment. Fertil consolidated from Q4 2019
** Mainly related to elimination of Natgasoline, which is included in Methanol US segment
*** Until 2019 OCI Fuels Ltd. was included in segment Methanol US. Effective 1 January 2020, OCI Fuels Ltd. will be combined with OCI Fuels B.V. in the segment Methanol Europe.
The comparative numbers of Q1 2019 are restated to reflect that change.

                                                                                                                                                                                      19
Product Sales Volumes (‘000 metric tons)
                                                      Q2 2020   Q2 2019    %Δ     H1 2020   H1 2019    %Δ

 Own Product

 Ammonia                                                346.8     592.1   (41%)     888.3     959.6    (7%)

 Urea                                                 1,240.7     857.1    45%    2,357.0   1,305.3    81%

 Calcium Ammonium Nitrate (CAN)                         670.6     618.1     8%      840.8     726.8    16%

 Urea Ammonium Nitrate (UAN)                            496.1     459.2     8%      836.1     699.1    20%

 Total Fertilizer                                     2,754.2   2,526.5     9%    4,922.2   3,690.8    33%

 Melamine                                                29.3      32.9   (11%)      59.8      68.1   (12%)

 DEF                                                    129.0     128.9     0%      269.4     225.9    19%

 Total Nitrogen Products                              2,912.5   2,688.3     8%    5,251.4   3,984.8    32%

 Methanol1)                                             352.2     396.0   (11%)     751.2     794.1    (5%)

 Total Own Product Sold                               3,264.7   3,084.3     6%    6,002.6   4,778.9    26%

 Traded Third Party

 Ammonia                                                 70.3      22.6   211%      144.6     112.4    29%

 Urea                                                   297.8     114.5   160%      455.9     186.2   145%

 UAN                                                      6.7       3.4    96%       12.5      10.2    23%

 Methanol                                                88.6     151.1   (41%)     188.4     247.6   (24%)

 Ammonium Sulphate (AS)                                 169.6     177.2    (4%)     328.2     379.0   (13%)

 DEF                                                     50.3      19.8     nm      106.0      28.6     nm

 Total Traded Third Party                               683.3     488.6    40%    1,235.6     964.0    28%

 Total Own Product and Traded Third Party             3,948.0   3,572.9    11%    7,238.2   5,742.9    26%

1) Including OCI’s 50% share of Natgasoline volumes

                                                                                                          20
For OCI N.V. investor relations enquiries contact:

Hans Zayed
hans.zayed@oci.nl
T +31 (0) 6 18 25 13 67

OCI N.V. corporate website: www.oci.nl

                                                     21
You can also read