FY2020 Investor Presentation - 18 AUGUST 2020 - Bell Direct
←
→
Page content transcription
If your browser does not render page correctly, please read the page content below

FY2020
Investor Presentation
18 AUGUST 2020
Important Notice and Disclaimer

Important information                                                                             Future performance
The information in this presentation is general in nature and does not purport to be              This presentation may contain certain ‘forward-looking statements’. Forward-looking
complete. It has been prepared by SG Fleet Group Limited (the “Company”) with due care but        statements include those containing words such as: ‘anticipate’, ‘believe’, ‘expect’, ‘project’,
no representation or warranty, express or implied, is provided in relation to the accuracy,       ‘forecast’, ‘estimate’, ‘likely’, ‘intend’, ‘should’, ‘could’, ‘may’, ‘target’, ‘plan’, ‘consider’,
reliability, fairness or completeness of the information, opinions or conclusions in this         ‘foresee’, ‘aim’, ‘will’ and other similar expressions. Any forward-looking statements, opinions
presentation. The Company has not verified any of the contents of this presentation.              and estimates (including forecast financial information) provided in this presentation are
Statements in this presentation are made only as of the date of this presentation unless          based on assumptions and contingencies which are subject to change without notice and
otherwise stated and the information in this presentation remains subject to change without       involve known and unknown risks and uncertainties and other factors which are beyond the
notice. Neither the Company, nor any Limited Party (as defined below) is responsible for          control of the Company. This includes any statements about market and industry trends,
updating, nor undertakes to update, this presentation. Items depicted in photographs and          which are based on interpretations of current market conditions. Forward-looking statements
diagrams are not assets of the Company, unless stated.                                            may include indications, projections, forecasts and guidance on sales, earnings, dividends,
Not financial product advice or offer                                                             distributions and other estimates.
This presentation is for information purposes only and is not a prospectus, product disclosure    Forward-looking statements are provided as a general guide only and should not be relied
statement or other offer document under Australian law or the law of any other jurisdiction.      upon as an indication or guarantee of future performance. Actual results, performance or
This presentation is not financial product or investment advice, a recommendation to acquire      achievements may differ materially from those expressed or implied in such statements and
securities or accounting, legal or tax advice. It has been prepared without taking into account   any projections and assumptions on which those statements are based. These statements
the objectives, financial or tax situation or needs of individuals. Readers should consider the   may assume the success of the Company’s business strategies.
appropriateness of the information having regard to their own objectives, financial and tax       The success of any of these strategies is subject to uncertainties and contingencies beyond
situation and needs and seek independent legal, taxation and other professional advice            the Company’s control, and no assurance can be given that any of the strategies will be
appropriate for their jurisdiction. This presentation is not and should not be considered as an   effective or that the anticipated benefits from the strategies will be realised in the period for
offer or invitation of securities. In particular, this document does not constitute an offer to   which the forward-looking statement may have been prepared or otherwise. Readers are
sell, or a solicitation of an offer to buy, any securities in the United States.                  cautioned not to place undue reliance on forward-looking statements and except as required
                                                                                                  by law or regulation, the Company assumes no obligation to update these forward-looking
Financial data
                                                                                                  statements. To the maximum extent permitted by law, the Company and its related bodies
All dollar values are in Australian dollars ($ or A$) unless stated otherwise.
                                                                                                  corporate, officers, employees, agents and advisers (the “Limited Parties”):
Effect of rounding                                                                                • disclaim any obligations or undertaking to release any updates or revisions to the
A number of figures, amounts, percentages, estimates, calculations of value and fractions in         information to reflect any change in expectations or assumptions;
this presentation are subject to the effect of rounding. Accordingly, the actual calculation of   • do not make any representation or warranty, express or implied, as to the accuracy,
these figures may differ from the figures set out in this presentation.                              reliability, fairness or completeness of such information, or likelihood of fulfilment of any
Past performance                                                                                     forward-looking statement or any event or results expressed or implied in any forward-
Past performance and pro-forma financial information given in this presentation is given for         looking statement; and
illustrative purposes only and should not be relied upon as (and is not) an indication of the     • disclaim all responsibility and liability for these forward-looking statements (including,
Company’s views on its future financial performance or condition. Past performance of the            without limitation, liability for negligence).
Company cannot be relied upon as an indicator of (and provides no guidance as to) future
Company performance.

                                                                                                                                                     FY20 Results Investor Presentation          2
Overview

                                    • Enhanced customer focus on service quality and value-add during crisis period

Financial Results                   • Company delivered seamless service continuity by maintaining operational
NPAT                                  scale
$36.8m
                                    • Strong business development performance across the Group to yield benefits in
(Pre-COVID-19 guidance $48-51m)       current and coming periods

                                    • Consumer business recovery towards period end after marked impact at start
                                      of Q4

                                    • Structural trend towards outsourcing and mobility evolution accelerate in
                                      COVID-19 environment
Fleet Balance
                                    • Further growth in product penetration
+2.4% vs. FY19
+1.5% 2H20 vs. 1H20                 • Innovation continues as leasing and mobility landscape evolves

                 Leadership position in both Corporate and Consumer limits COVID-19 impact

                                                                                           FY20 Results Investor Presentation   3
Operational Review – AUS Q3

     Corporate                                                 Consumer

 • Opportunities pipeline strong                          • Continued weakness in new car sales

 • Strong win rate across range of industries and         • Insurance product review
   segments
                                                          • Strong rate competition
 • Competitive environment rational
                                                          • Sizeable customer wins in private and
 • Decision process remains lengthy                         public sector, combined with retention of all
                                                            key accounts

                                                          • Driver marketing increasingly moves online

                                   Start of period in line with first half

                                                                                    FY20 Results Investor Presentation   4
Operational Review – Group Q4

 Business continuity approach                         Business impact

 • Focus on ensuring wellbeing of staff and           • Extensions up 31%
   customers                                            • Temporary impact on funding commissions

 • Cashflow and financial management aided by         • Auction activity levels impacted
   annuity-style income profile                         • Lower frequency AU
                                                        • Suspension UK/NZ
 • Voluntary reduction in remuneration
                                                      • Disposal volumes -35% in Q4, up 2% in June
 • Workforce adapts rapidly to new environment
   and changing customer requirements                 • Average disposal profit significantly lower in Q4

                                                      • Recovery as period progresses with marked
                                                        bounce-back since June

                                                      • Some segments less impacted

                      Rapid BCP implementation minimised initial COVID-19 impact

                                                                                 FY20 Results Investor Presentation   5
Operational Review – AUS Q4

     Corporate                                            Consumer

 • Exposure to unaffected industries ensures          • Immediate focus on assisting drivers in
   activity levels largely maintained                   hardship - travel segment impacted

 • Opportunities pipeline remains healthy             • Driver engagement moves online

 • Targeted campaigns to assist customers             • Customers continue to tender – high win rate
                                                      • COVID-19 impact on enquiries from mid-March,
                                                        recovery from May

                                                                        Consumer Funded Deliveries
                                                           6000
                                                                      4807
                                                           5000
                                                           4000                                  3191
                                                           3000
                                                           2000
                                                           1000
                                                             0
                                                                     Q4 2019                    Q4 2020

                                        Impact evolves over Q4

                                                                                   FY20 Results Investor Presentation   6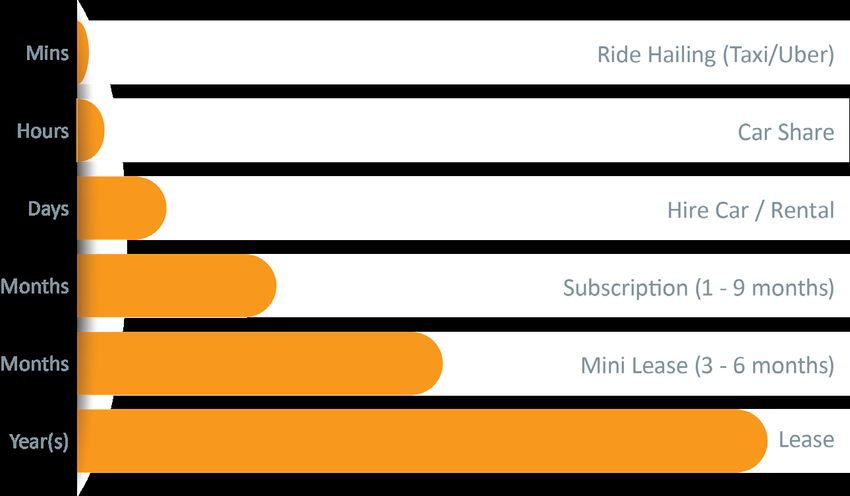
Operational Review – UK

 Q3                                                     Q4

 • Business confidence improving post-elections         • Recovery from late May after marked impact
                                                          on economic activity levels, registrations and
 • Opportunities pipeline stronger                        residual values
 • Second-hand market begins to recover                 • Disposals temporarily halted by full lockdown
 • Targeted marketing campaigns                         • Deliveries to essential services customers
   • Local SME segment                                    growing
   • Crown Commercial Services network
                                                        • Tender activity grows strongly
 • Higher product penetration
   • Motrak                                             • Break-through fleet management contract and
   • Short-term hire                                      large delivery vehicle wins

                              Strong order bank despite temporary disruption

                                                                                  FY20 Results Investor Presentation   7
Operational Review – NZ
Q3 Q4
• Activity levels in line with first half • Sharp initial drop in new registrations -
disposals suspended
• Northpower contract live
• Residual values recover from June
• Significant win in utility industry
• Public sector exposure ensures stable activity
• Disposal volumes and values strong until late levels
March
• New tender activity at record levels
• Sale and leasebacks in high demand
Sharp business activity recovery towards period end
FY20 Results Investor Presentation 8Customer Base and Products & Services Offering – Update
Tenders • 2H AU/NZ tender activity level higher than
1H across Corporate and Consumer
• Multiple un-tendered contract renewals and
38 40% 69% extensions
• Impact on FY21 deliveries
Number of tender 2H20 2H20
submissions Corporate win rate1 Consumer win rate1
awaiting decision1 (1H20: 27%) (1H20: 33%)
1. AU/NZ
• Telematics penetration accelerates
Product Penetration
• Bookingintelligence user and transaction
numbers grow exponentially
42% 88% 51% 120000
100000
Bookingintelligence Transactions
103977
80000
60000 49748
of customers of Top 40 customers of Top 40 customers 40000 25063 30208
take up 2 or take up 2 take up 3 20000
more products1 or more products1 or more products1 0
(1H20: 36%) (1H20: 75%) (1H20: 38%) Apr-20 May-20 Jun-20 Jul-20
1. Legal entity basis – Corporate business
FY20 Results Investor Presentation 9Innovation
Product & Services Development SG Fleet in the Mobility Landscape
Subscription services
3 - 6 month leases
Repair portal for fleet managers
Global research initiative
Zero Emission Vehicles
UK Industry Awards
• Product development across evolving leasing and mobility landscape
• Focus on providing greater flexibility for users
• Provides access to wider pool of customers
FY20 Results Investor Presentation 10Financial Results
FY20 Results Investor Presentation 11Financial Summary
A$m FY2020 FY2019 Variance
Revenue 452.9 509.7 (11.1%)
• Passenger car sales in Australia
Cost of Revenue (280.6) (300.7) 6.7%
down 13.8% vs. pcp
Net Revenue 172.3 209.0 (17.6%)
Operating Expenses (97.3) (94.6) (2.9%) • Material changes to add-on
Operating EBITDA 75.0 114.5 (34.5%) insurance portfolio
Depreciation and amortisation expense (16.8) (16.1) (4.3%)
• Q4 impact – 42% reduction in
Operating Income 58.2 98.4 (40.8%)
Net Revenue
Interest on Corporate Debt (5.8) (6.8) 14.7%
Underlying Net Profit Before Income Tax 52.4 91.6 (42.8%) • Not entitled to JobKeeper due
Tax (15.6) (27.1) 42.4%
to GST turnover definition –
engaging with ATO/Treasury for
Underlying Net Profit After Tax1 36.8 64.5 (42.9%)
discretion to be applied
Reported Net Profit After Tax 36.8 60.5 (39.2%)
• Underlying NPAT - $36.8m vs.
Underlying Net Profit After Tax 1
36.8 64.5 (42.9%) pre-COVID-19 guidance of
Amortisation of Intangibles 6.9 6.8 (1.5%) $48m-$51m
Underlying NPATA2 43.7 71.3 (38.7%) • On track vs. guidance forecast
until end March 2020
Underlying EPS (cents) 14.01 24.76 (43.4%)
Reported EPS (cents) 14.01 23.20 (39.6%)
Underlying Cash EPS (cents) 16.66 27.35 (39.1%)
1: Underlying Net Profit After Tax = Net Profit After Tax before significant non-recurring items.
2: Underlying NPATA = Net Profit After Tax before acquisition-related expenses incurred during the reported period and excluding amortisation and impairment of intangible assets on an after tax basis.
FY20 Results Investor Presentation 12Fleet Movement
200,000
180,000
47,053 43,720
160,000
140,000
120,000
100,000
80,000
139,945 143,278
60,000
40,000
20,000
-
Opening Balance 1st July 2019 Deliveries & Extensions Terminations Closing Balance 30th June 2020
FY20 Results Investor Presentation 13Fleet Mix
June 2020 June 2019
26% 29%
39%
43%
31%
32%
Operating Finance Fleet Managed Operating Finance Fleet Managed
June 2020 June 2019
33% 34%
67% 66%
Corporate Salary Packaging Corporate Salary Packaging
FY20 Results Investor Presentation 14Revenue Analysis
Management and Maintenance Income 8.1%
120.0
92.5 93.3 94.5 • Impacted by 2.6% decline in average funded fleet
100.0 86.8
80.0 69.8
• Further reduction in number of fully-maintained
60.0 vehicles
40.0
20.0
• COVID-19 impact:
-
• Not material due to annuity nature
FY2016 FY2017 FY2018 FY2019 FY2020
Additional Products and Services 17.0%
120.0 104.0 107.1
95.2 88.9
• Impact of changes to add-on insurance product
100.0
70.5
portfolio
80.0
• Reduction in margins
60.0
• Spreading of income
40.0
• Certain products exited in 1H
20.0
- • COVID-19 impact:
FY2016 FY2017 FY2018 FY2019 FY2020 • Lower deliveries in Q4
Funding Commission 21.8%
120.0
100.0
• Impact of soft vehicle sales in Australia
80.0 • Credit rejections remain elevated
56.1 54.8 50.6
60.0 41.2 39.6 • COVID-19 impact:
40.0
• 42% decline in new funded deliveries vs.
20.0
pcp
-
• 31% growth in extensions in Q4 vs. pcp
FY2016 FY2017 FY2018 FY2019 FY2020
FY20 Results Investor Presentation 15Revenue & Direct Costs Analysis
Net End of Lease Income 20.1%
120.0 • Resilient pre-COVID-19
100.0 • COVID-19 impact:
80.0 • Fewer returning vehicles due to growth in
60.0 extensions
40.0
17.6 17.6
• Fewer auctions in AU, suspension of
12.6 10.7 14.1
20.0 auctions in UK/NZ
- • 35% fall in disposal volumes and sharp fall
FY2016 FY2017 FY2018 FY2019 FY2020 in average profit vs. pcp
Net Rental Income 4.5%
120.0
• Lower volumes on short-term rental in UK business
100.0
in lead-up to election
80.0
60.0 • COVID-19 impact:
40.0 • Temporary reduction in demand for short-
20.0 5.2
11.9 11.9 10.6 10.1 term hire in UK
-
FY2016 FY2017 FY2018 FY2019 FY2020
Fleet Management Costs 7.5%
120.0
• Maintenance costs lower due to reduction in
100.0
70.8 74.0 75.1 number of fully-maintained commercial vehicles
80.0 69.5
60.0 51.6 • COVID-19 impact:
40.0 • Lower vehicle maintenance costs due to
20.0
reduced usage
• Increase in inventory impairment provision
-
FY2016 FY2017 FY2018 FY2019 FY2020
FY20 Results Investor Presentation 16Net Revenue Analysis
Net Revenue
211.6 209.0
200.1
172.3
17.6%
200.0
153.3
150.0
100.0
50.0 • Net Revenue = Gross Revenue less
- direct costs (fleet management costs,
FY2016 FY2017 FY2018 FY2019 FY2020 vehicle cost of sale, short-term rental
cost of sale and depreciation and
FY20 FY19
interest on lease portfolio)
Upfront Over the Upfront
Over the Life
Life
31%
52%
37%
• Reduction in new deliveries and
58% changes to insurance product portfolio
increase annuity income proportion
and shift weighting of revenue
End of End of towards Corporate business
Life Life
11% 11%
• Improvement in product mix
Retail
Retail
52.6%
47.6%
Corporate
Corporate 47.4%
52.4%
FY20 Results Investor Presentation 17Expense Analysis
Operating Expenses 2.9%
120.0
93.3 97.9 94.6 97.3 • Continued investment in technology and
100.0
80.0 69.4 innovation
• Includes $800k impairment of investment in
60.0
Collaborate Corporation Limited
40.0
• Employment costs include $1.3m in redundancy
20.0
costs
-
FY2016 FY2017 FY2018 FY2019 FY2020
• No JobKeeper benefit included in P&L
Depreciation and Amortisation 4.3%
120.0
100.0 • Growth attributable to growth in capex in recent
80.0
years
60.0 • Full impact of AASB16 now reflected in current
40.0 period and pcp
10.7 16.1 16.8
20.0 4.7 9.6
-
FY2016 FY2017 FY2018 FY2019 FY2020
Corporate Interest Cost 14.7%
120.0
100.0 • Full-year impact of improved terms on refinance
80.0 of corporate debt
60.0 • Pcp includes the accelerated amortisation of
40.0 previously capitalised debt transaction costs
20.0 5.3 7.3 7.0 6.8 5.8
-
FY2016 FY2017 FY2018 FY2019 FY2020
FY20 Results Investor Presentation 18Securitisation Update
• Go-live deferred as project management and development resources diverted to manage impact of
COVID-19
• Implementation of automated credit decisioning system, incorporating on-line application form,
credit bureau report and serviceability assessment, nearing completion
• Systems changes to cater for securitisation requirements, including reporting, close to final
• Senior funder selected
• Some transaction documents executed, remainder to be executed immediately prior to go-live
• Autonomy 2020-1 Warehouse Trust established
• Targeting to originate first lease in 1H21
FY20 Results Investor Presentation 19Balance Sheet, Cashflow and Dividend
• Net corporate debt1 – $26.0m ($38.8m pcp)
• Pro forma net leverage ratio2
• Total leverage – 0.9x Statutory EBITDA (0.6x pcp)
• Corporate leverage – 0.3x Statutory EBITDA (0.3x pcp)
• Cash conversion – 118% of Statutory EBITDA
• Final dividend of 3.053 cents per share fully franked.
• Full-year dividend 9.996 cents per share fully franked
• Full-year payout ratio of 60% of Reported NPATA (65% pcp)
1: Net corporate debt excludes lease portfolio borrowings
2: Leverage ratio calculated on Pro forma EBITDA excluding significant non-recurring transactions
FY20 Results Investor Presentation 20Operational Update
& Outlook
FY20 Results Investor Presentation 211H21 Update
Group
• Office environment normalising
• June RV rebound accelerates as preference for private transport drives interest in second hand vehicles
• Lower new car sales restricts supply of trade-ins
• New vehicles, parts and accessories supply disruption is spreading out deliveries for large 4Q20 wins
over 1H21
AUS Corporate AUS Consumer
• Significant wins at start of period • Leads and orders ahead of initial expectations
• Opportunities pipeline grows as companies • Consumer confidence varies by State
and organisations review fleet approach
• Continued support of customers in industries
• Focus on efficiencies driving interest in impacted by employment situation
specialised providers
• Activity levels will remain vulnerable to
• Sale and leasebacks address cashflow volatility in environment and sentiment
imperatives
• High demand for delivery vehicles
Improving outlook but uncertainty remains
FY20 Results Investor Presentation 221H21 Update
UK NZ
• Strong exposure to segments benefiting • Companies conducting business
from government infrastructure spending reviews in pursuit of efficiencies
• Strong second-hand vehicle market • Tender activity levels at all time high – pursuit
focused on larger contracts
• Fulfilling 4Q20 orders in context of constrained
production levels • Opportunities in finance and government
sector
• Focus on wins through Crown Commercial
channel, contract extensions, additional services • Potential conversion of large unfunded
contracts to funded
• Relaunch courier lease product into strong
demand channel
• Business of the Year Award win
High activity levels in UK and NZ businesses
FY20 Results Investor Presentation 23Emerging and Accelerating Trends
Fear of infection and Fleet management services – General: situation favours use of closed pool of vehicles for tool-of-trade
shift away from public or movements over reliance on public/shared transport because vehicle hygiene can be managed and external
shared transport towards exposure is reduced
single-occupancy transport Leasing – Novated: renewed preference for owned/leased vehicles over public/shared
modes that support social Leasing – Mini-lease / Carly / Short-term hire (UK): demand for short-term single vehicle or single
distancing occupancy vehicle arrangements to replace reliance on public transport, ride share, or multiple passengers
fleetintelligence / bookingintelligence: introduction of sanitisation datapoint
Greater focus on Inspect365: WH&S focus on sanitisation and introduction of sanitisation checkpoint
vehicle and trip safety,
Fleet management services – Aftermarket: demand for vehicle sanitisation kits
including hygiene
DingGo: contactless repair process and vehicle sanitisation
Expansion of eCommerce Fleet management / Corporate Leasing – General: demand as consequence of expansion of delivery fleets
and last mile delivery Leasing – Mini-lease / Carly / Short-term hire (UK): short-term fleet expansions to cover seasonal peak
implications periods
Shift towards greater
acceptability of people and IVAM / telematics: greater requirement for vehicle tracking
vehicle movement tracking bookingintelligence: greater ability to identify asset user / driver in case of infection
to manage emergencies
Economic impact on
business activity levels and Leasing – Mini-lease / Carly: preference for shorter-term commitments
uncertain business outlook
Economic impact on
corporate finances and Leasing – General: increased appeal of outsourcing, demand for sale and leaseback arrangements
resulting management of Fleet management services / Leasing – General: greater cost focus and receptiveness to fleet efficiency
balance sheet, cashflow advice and solutions
and costs
Fleet management and leasing value-add addresses additional corporate and consumer requirements
FY20 Results Investor Presentation 24Summary
Australia – Corporate Australia – Consumer Outlook
• Service continuity ensured • Significant impact at start of Q4, • Interest in consumer products
followed by gradual recovery recovering
• Positive response to increased
towards period end
customer demand for assistance • Corporate business focused on
• Customer tender activity continued fulfilling large order books
• Strong pipeline continues
• Strong win rate • High level of extensions in Q4 will
require replacement in short to
medium term
UK New Zealand • Need for fleet efficiencies is driving
• Initial economic recovery halted by • BAU returns by period end broadening interest in outsourced
COVID-19 – recovery begins towards services
• Exposure to public sector ensures
end of Q4 • Range of solutions suitable for
stable activity levels
• Strong customer wins throughout current environment
• Opportunities pipeline strong
period build up significant order book
• Increased focus on service quality
and value-add
• Company position strengthened on
Customers Innovation 1H20
• Tender win rates well in excess of • Product development across evolving • Positive growth scenario remains
current market share leasing and mobility landscape vulnerable to short-term
developments
• Product and services penetration • Focus on providing greater flexibility
continues to rise for users
FY20 Results Investor Presentation 25Questions
FY20 Results Investor Presentation 26Annexure
FY20 Results Investor Presentation 27Annexure
A$m FY 2020 FY 2019 Variance
Management and Maintenance Income 86.8 94.5 (8.1%)
Additional Products and Services 88.9 107.1 (17.0%)
Finance Commission 39.6 50.6 (21.8%)
End Of Lease Income 196.6 213.4 (7.9%)
Rental Income 38.8 40.5 (4.2%)
Other Income 2.2 3.7 (39.3%)
Total Revenue 452.9 509.7 (11.1%)
Fleet Management Costs 69.5 75.1 7.5%
Short Term Hire Costs 10.8 11.6 6.9%
Cost of End of Lease Income 182.5 195.8 6.8%
Operating Lease Depreciation 15.6 15.5 (0.6%)
Direct Interest 2.3 2.8 17.6%
Total Expenses 280.6 300.7 6.7%
Net Revenue 172.3 209.0 (17.6%)
Net Revenue excluding End of Lease Income 158.2 191.5 (17.4%)
Net End of Lease Income 14.1 17.6 (20.1%)
Employee Benefits Expense 73.5 75.1 2.1%
Occupancy Costs 2.3 2.6 13.0%
IT and Communication Costs 11.2 7.9 (42.2%)
Other Expenses 10.3 9.0 (14.7%)
Total Operating Expenses 97.3 94.6 (2.9%)
Operating EBITDA 75.0 114.5 (34.5%)
Depreciation and amortisation expense 16.8 16.1 (4.3%)
Operating Income 58.2 98.4 (40.8%)
Interest on Corporate Debt 5.8 6.8 14.7%
Underlying Net Profit Before Income Tax 52.4 91.6 (42.8%)
Tax 15.6 27.1 42.4%
Underlying Net Profit After Tax1 36.8 64.5 (42.9%)
One Off Costs - 4.0 100.0%
Reported Net Profit After Tax 36.8 60.5 (39.2%)
Amortisation of Intangibles 6.9 6.8 (1.5%)
Underlying NPATA2 43.7 71.3 (38.7%)
1: Underlying Net Profit After Tax = Net Profit After Tax before significant non-recurring items.
2: Underlying NPATA = Net Profit After Tax before acquisition-related expenses incurred during the reported period and excluding amortisation and impairment of intangible assets on an after tax basis.
FY20 Results Investor Presentation 28You can also read