INVESTOR PRESENTATION - AUGUST 10, 2021 - INVESTOR RELATIONS | TASKUS

 
CONTINUE READING
INVESTOR PRESENTATION - AUGUST 10, 2021 - INVESTOR RELATIONS | TASKUS
Investor
Presentation
August 10, 2021
INVESTOR PRESENTATION - AUGUST 10, 2021 - INVESTOR RELATIONS | TASKUS
Disclaimer
This presentation contains “forward-looking statements” within the meaning of the Private Securities Litigation Reform Act of 1995. Forward-looking statements include all statements that are not historical facts, and further include, without limitation, statements
reflecting our current views with respect to, among other things, our operations, our financial performance, our industry, the impact of the COVID-19 global pandemic on our business, and other non-historical statements including the statements in the “Third Quarter
and Full Year 2021 Outlook” section of this press release. In some cases, you can identify these forward-looking statements by the use of words such as “outlook,” “believes,” “expects,” “potential,” “continues,” “may,” “will,” “should,” “could,” “seeks,” “predicts,”
“intends,” “trends,” “plans,” “estimates,” “anticipates” or the negative version of these words or other comparable words. Such forward-looking statements are subject to various risks and uncertainties.

Accordingly, there are or will be important factors that could cause actual outcomes or results to differ materially from those indicated in these statements. These factors include but are not limited to:the dependence of our business on key clients; the risk of loss of
business or non-payment from significant clients; our failure to cost-effectively acquire new, high-growth clients; the risk that we may provide inadequate service or cause disruptions in our clients’ businesses or fail to comply with the quality standards required by our
clients under our agreements; unauthorized or improper disclosure of personal or other sensitive information, or security breaches and incidents; negative publicity or liability or difficulty retaining and recruiting employees; our failure to detect and deter criminal or
fraudulent activities or other misconduct by our employees; global economic and political conditions, especially in the social media and meal delivery and transport industries from which we generate most of our revenue; the dependence of our business on our
international operations, particularly in the Philippines and India; our failure to comply with applicable privacy and data security laws and regulations; substantial increases in the costs of technology and telecommunications services or our inability to attract and retain
the necessary technologists; our inability to adapt our services and solutions to changes in technology and client expectations; fluctuations against the U.S. dollar in the local currencies in the countries in which we operate; our inability to maintain and enhance our
brand; competitive pricing pressure; our dependence on senior management and key employees; the limited experience of our management team in managing a public company; the ongoing COVID-19 pandemic, including the resulting global economic uncertainty
and measures taken in response to the pandemic; the control of affiliates of The Blackstone Group Inc. and our Co-Founders over us; and the dual class structure of our common stock. Additional risks and uncertainties include but are not limited to those described
under “Risk Factors” in the Company’s prospectus, dated June 10, 2021,s filed with the Securities and Exchange Commission (the “SEC”) pursuant to Rule 404(b)(4) of the Securities Act of 1933, as amended,on June 14, 2021, as such factors may be updated from
time to time in our periodic filings with the SEC, which are accessible on the SEC’s website at www.sec.gov. These factors should not be construed as exhaustive and should be read in conjunction with the other cautionary statements that are included in the
prospectus. Forward-looking statements herein speak as of the date hereof and TaskUs undertakes no obligation to publicly update or review any forward-looking statement, whether as a result of new information, future developments or otherwise, except as
required by law.

This presentation includes certain financial measures not presented in accordance with generally accepted accounting principles in the United States (“GAAP”), including Adjusted Net Income, Adjusted Net Income Margin, EBITDA, Adjusted EBITDA and Adjusted
EBITDA Margin, which are used by management in making operating decisions, allocating financial resources, and internal planning and forecasting, and for business strategy purposes, have certain limitations, and should not be construed as alternatives to financial
measures determined in accordance with GAAP. The non-GAAP measures as defined by us may not be comparable to similar non-GAAP measures presented by other companies. Our presentation of such measures, which may include adjustments to exclude
unusual or non-recurring items, should not be construed as an inference that our future results will be unaffected by other unusual or non-recurring items. A reconciliation is provided elsewhere in this presentation for each historical non-GAAP financial measure to the
most directly comparable financial measure stated in accordance with GAAP.

Because GAAP financial measures on a forward-looking basis are not accessible, and reconciling information is not available without unreasonable effort, we have not provided reconciliations for forward-looking non-GAAP measures. For the same reasons, we are
unable to address the probable significance of the unavailable information, which could be material to future results.

This presentation includes market and industry data and forecasts that we have derived from independent consultant reports, publicly available information, various industry publications, other published industry sources and our internal data and estimates.
Independent consultant reports, industry publications and other published industry sources generally indicate that the information contained therein was obtained from sources believed to be reliable. Although we believe that these third-party sources are reliable, we
do not guarantee the accuracy or completeness of this information, and we have not independently verified this information. Some market data and statistical information are also based on our good faith estimates, which are derived from management’s knowledge
of our industry and such independent sources referred to above. Certain market, ranking and industry data included elsewhere in this presentation, including the size of certain markets and our size or position and the positions of our competitors within these
markets, including our services relative to our competitors, are based on estimates of our management. These estimates have been derived from our management’s knowledge and experience in the markets in which we operate, as well as information obtained from
surveys, reports by market research firms, our clients, suppliers, trade and business organizations and other contacts in the markets in which we operate and have not been verified by independent sources. Unless otherwise noted, all of our market share and market
position information presented in this presentation is an approximation. Our market share and market position in each of our lines of business, unless otherwise noted, is based on our sales relative to the estimated sales in the markets we served. References herein
to our being a leader in a market or product category refer to our belief that we have a leading market share position in each specified market, unless the context otherwise requires. As there are no publicly available sources supporting this belief, it is based solely on
our internal analysis of our sales as compared to our estimates of sales of our competitors. In addition, the discussion herein regarding our various end markets is based on how we define the end markets for our products, which products may be either part of larger
overall end markets or end markets that include other types of products and services. Our internal data and estimates are based upon information obtained from trade and business organizations and other contacts in the markets in which we operate and our
management’s understanding of industry conditions. Although we believe that such information is reliable, we have not had this information verified by any independent sources. All trademarks, service marks, and trade names appearing in this presentation are the
property of their respective holders.

                                                                                                                                                                                                        Investor Presentation | 2
INVESTOR PRESENTATION - AUGUST 10, 2021 - INVESTOR RELATIONS | TASKUS
Outsourcing reimagined
 for the innovation age.

                     Investor Presentation | 3
INVESTOR PRESENTATION - AUGUST 10, 2021 - INVESTOR RELATIONS | TASKUS
4

                                                                                                                            Client Satisfaction
                                                                    Q2 2021 Growth & Margin
           Our goal is                                                                                                          75                           125%
           to build                                                        $180m                         57.4%               2020 cNPS                   2018-2020 average net
                                                                                                                                                          revenue retention rate

           the world’s                                                    Q2 2021 revenue              Revenue growth YoY

           largest                                                                            24.5%                         Scale & Delivery
           tech                                                                                Q2 2021 Adj.
                                                                                              EBITDA margin1

           enabled                                                                                                           100+              3
                                                                                                                                                              31.5k
                                                                                                                                                               Employees2
           service                                                                                                          Clients globally

           provider.                                                                                                                           96%
                                                                           Employee Obsession                                            % of 2020 revenue
                                                                                                                                          from Non-Voice,
                                                                                                                                              Digital or

1
                                                                                   72                      4.7                             Omni-Channel

2
  See appendix for reconciliation to most comparable GAAP measure
  As of June 30, 2021
                                                                                2020 eNPS              Glassdoor Score2
3
  As of December 31, 2020                                           1
                                                                        As of December 2020

                                                                                                                             Investor Presentation | 4
INVESTOR PRESENTATION - AUGUST 10, 2021 - INVESTOR RELATIONS | TASKUS
Service Offerings

                   Investor Presentation | 5
INVESTOR PRESENTATION - AUGUST 10, 2021 - INVESTOR RELATIONS | TASKUS
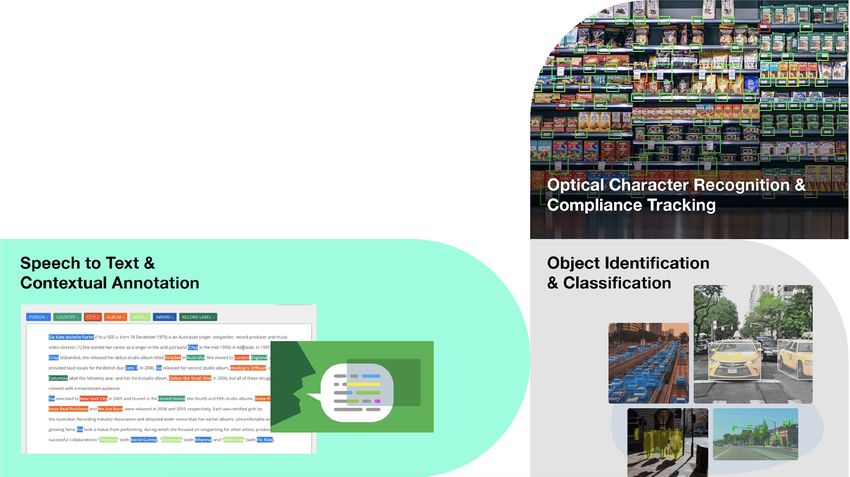
Digital Offerings Powered by Differentiated Technology Solutions

                   Digital
                                                          Content Security           AI Operations
             Customer Experience

                            63%                               27%                           10%

Note: Percentages based on contribution to 2020 revenue

                                                                             Investor Presentation | 6
INVESTOR PRESENTATION - AUGUST 10, 2021 - INVESTOR RELATIONS | TASKUS
SOLUTIONS:

      Digital Customer Experience                                        Omni-Channel Care                              Customer Acquisition

                                                                         Trust & Safety                                 Technical Support
Ever-increasing user expectations and competition necessitate world
class customer care. Founded on innovation and people-first culture,      New Product or Market Launches                 Consulting Services
TaskUs delivers consistently excellent CX support for the world’s
leading brands. The digital nature of the support we provide allows us
to automate a greater portion of these interactions, support multiple
interactions concurrently and use support staff based in higher margin,
offshore markets.
                                                                                                     20%
                                                                                                     Omni-Channel

                                                                                          7%
                                                                                          Voice
                          2020 Revenue:
                            $300mm
                               63%                                                                                        73%
                                                                                                                        Non-Voice

                                                                                          Note: Percentage based on 2020 Digital CX revenue

                                                                                                          Investor Presentation | 7
INVESTOR PRESENTATION - AUGUST 10, 2021 - INVESTOR RELATIONS | TASKUS
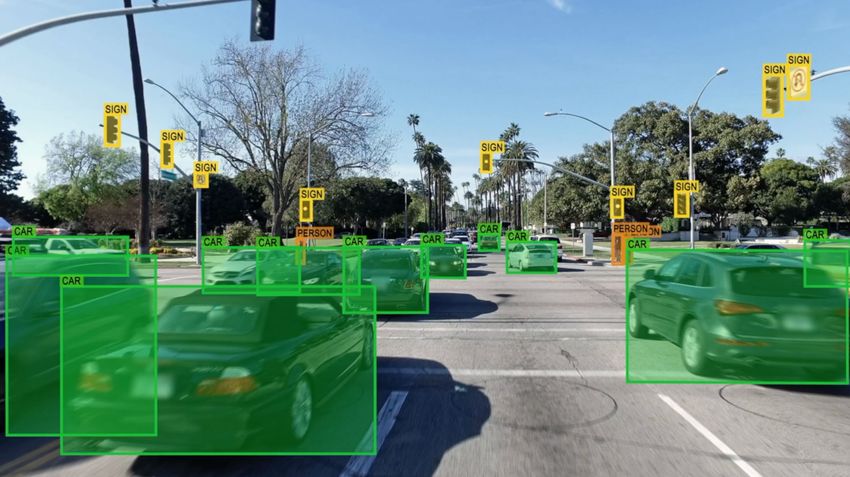
Content Security: The Digital First Responders
User generated content is growing at an exponential rate. Wherever
content is created by users, platforms must review and enforce policy
guidelines to protect their communities. Today TaskUs teammates
review content posted by users and advertisers across these social      Policy Development
networks as well as dating apps, job sites and marketplaces.            We go beyond content moderation to apply best practices
                                                                        to policy development and distribution, product design,
                                                                        quality, and training.

                                                                        Tools & Innovation
                                                                        We work with our client’s development teams to build tools
                                                                        to identify and remove harmful content. Our proprietary
                                                                        workflow tools improve the efficiency and accuracy of our
                                                                        Content Security professionals.
                         2020 Revenue:
                           $128 mm                                      Resiliency Studio
                             27%                                        A clinician-led program, backed by an in-house research
                                                                        team, with over 100 mental health professionals delivering
                                                                        support to TaskUs teammates on the frontlines of content
                                                                        moderation.

                                                                                        Investor Presentation | 8
INVESTOR PRESENTATION - AUGUST 10, 2021 - INVESTOR RELATIONS | TASKUS
AI Operations
In our AI Operations practice our teammates tag and annotate data sets to
create the raw material that artificial intelligence is built on. Nearly every AI
application being built today requires these kinds of custom data sets curated
by professional annotators. We leverage technology, automation, and
advanced training design to optimize results for our clients.

                                                                                                                      Optical Character
                                                                                                                      Recognition
                                                                                                                      Compliance Tracking

                       2020 Revenue: $50
                             mm
                              10%

                                                                                                                              Speech to Text &
                                                                                                                                   Contextual
                                                                                   Object Identification                            Annotation
                                                                                   & Classification

                                                                                                  Investor Presentation | 9
INVESTOR PRESENTATION - AUGUST 10, 2021 - INVESTOR RELATIONS | TASKUS
Realizing our $100 Billion Market Opportunity

                                                                                  Content Security

 Digital Customer
                                                                                  $5bn                                                Artificial
                                                                                  Market Size                                 Intelligence (AI)
 Experience
                                                                                                                                   Operations

 $77bn                                                                            40-50%
                                                                                  CAGR: 2016 - 2021                           $18bn
 Market Size                                                                                                                       Market Size

  20-25%                                                                                                                                   20%
  CAGR: 2018 - 20211                                                                                                                 CAGR: 2020 - 2024

Sources: IDC; JC Market Research; Everest Group
1
  Represents growth of the Digital CX segment of the Customer Experience market

                                                                                                      Investor Presentation | 10
Our Tech Products

     Better Management                         Better Productivity                        Better Workflow

     To optimize the management of             Free from time - and energy -          Since the very beginning, we have
     day-to-day work, the ConnectUs        consuming procedural and regulatory      been fascinated, if not obsessed, with
   suite offers technological advances         steps, your team members can              Task Automation and Intelligent
       that streamline much of the            operate in hyper-mode with the            Operations. With the rise of AI,
     administration and routine steps.         AssistUs suite of tools. We are          Machine Learning, and Robotic
      From assigning tasks, to tech        constantly building and refining tools          Process Automation we find
    support, to schedule management         that augment our teammates’ skills         ourselves increasingly delegating
       and sharing of our extensive          and training, allowing your team to     entire segments of our operations to
     knowledge, our tools allow your       operate at the highest level and allow      technology tools that get the job
    management team more available            more time to innovate and bring         done; smarter, faster and cheaper.
   time to do their job more effectively.   demonstrable ROI to the bottom line.

                                                                                          Investor Presentation | 11
TaskUs Digital Innovation In Action

           Digital CX                         Content Security                           Cross Platform

           CX CHATBOT                                TAGALL!                           OMNI SUPERVISOR
         Browser based chatbot                  Browser extension to            RPA enabled productivity alert system
 leveraging NLP for suggested answers   highlight and contextualize key terms   designed to support W@H managers

   Avg Handle Time reduction of 20%     Processing time improvement of 13%          Tasks Per Hour increase from
       CSAT improvement of 5%              Accuracy improvement of 6%                       2.77 to 3.68

                                                                                   Investor Presentation | 12
Our Clients -
High Growth Technology
Disruptors

                         Investor Presentation | 13
Technology is Transforming our Lives
                 THEN             NOW                           THEN                             NOW

               CABLE +        STREAMING                     LANDLINES +                      VIDEO CALL +
 ENJOY                                        COMMUNICATE
              SATELLITE         MEDIA                       CELL PHONES                       CHAT APPS

             WEB 1.0 CHAT    TODAY’S SOCIAL                                                 FOOD DELIVERY
SOCIALIZE                                        DINE       RESTAURANTS
               GROUPS            MEDIA                                                        PLATFORMS

                                                            MALL-BASED                      ECOMMERCE +
  STAY         HOTELS        HOME SHARING        SELL
                                                              RETAIL                        MARKETPLACE

                             RIDESHARING +                                                  HEALTHTECH
            RENTAL CARS +                                   TRADITIONAL
  MOVE                        DRIVERLESS        HEALTH                                      EXCHANGES +
                TAXIS                                       HEALTHCARE
                                VEHICLES                                                     WELLNESS

                              SEGMENTED                     BIG RETAIL +
            PAPER + ONLINE                                                                    CRYPTO +
  LOVE                        DATING AND        INVEST      INVESTMENT
                 ADS                                                                        DIGITAL BANKS
                              GROUP APPS                       BANKS

                                                               Investor Presentation | 14
TaskUs was Uber’s first     TaskUs’ flexibility and                         TaskUs is a real partner.
    outsourced partner and     ability to scale rapidly                       They’ve been able to
    in many ways grew up       was critical to keep                           interpret data from
    with Uber. Today, with a   up with our demand                             customer interactions
    large network of global    this year.                                     and deliver back
    vendor partners, we rely                                                  valuable insights that
    on TaskUs to support                                                      help improve our
    some of our most                                                          operations and core
    critical markets.                                                         product.

Lisa Stoner                                                 Nick Chong     Casper Sorensen
Global Head of Support Ops           Head of Global Support and Services   VP, Customer Experience
Uber                                                              Zoom     Coinbase

                                                                             Investor Presentation | 15
Expertise: Focused on Hi-Tech Clients & the Digital Economy

TARGET MARKETS                                              CLIENT HIGHLIGHTS

                                                            100+ Clients globally
                                                            3 of the top 4 social media sites
  Social Media     E-commerce   Gaming    Streaming Media   #1 audio and #1 video streaming
                                                            service providers

                                                            3 of the top 4 food delivery apps
                                  $
                                                            12 disruptive FinTechs
 Food Delivery &     HiTech     FinTech      HealthTech
  Ride Sharing
                                                                                Note: Client highlights as of December 2020

                                                              Investor Presentation | 16
Our Client Verticals                                                                        Client Count by Vertical
      Projected 2019 - 2023 CAGR                                                                                                  5%       5%
                                                                                                                          7%
                                                                                                                6%                                          13%
      26%         26%

                              20%          19%

                                                       16%                                              12%
                                                                  15%       14%
                                                                                       12%                                      2020
                                                                                                                                                                  12%

                                                                                                                20%
                                                                                                                                                      20%

                                                                                                     Social Media                  Retail + E-Commerce             Other

                                                                                                     On Demand Travel +
   Social media   Fintech   Digital Health Streaming   Online   eCommerce On-Demand     Food                                       FinTech
                                                                                                     Transportation
                                            services   mobile              transport   delivery
                                                       gaming                                        Entertainment +
                                                                                                                                   HealthTech
                                                                                                     Gaming
Sources: The Business Research Company; TechSci Research;                                                                          Professional Services
Technavio; Allied Market Research; and eMarketer.
                                                                                                     Hi-Tech
                                                                                                                                   + Industry

                                                                                                                               Investor Presentation | 17
Why We Win

Expertise                             Culture                                Speed
   We specialize in the unique      We have built a culture that feels     We are agile, flexible and
  disruptive industry segments      much more like our tech clients       responsive. Our clients are
of our clients. We build teams of    than the service providers we        growing exponentially. We
experts, processes and tools for            compete with.                understand “speed matters.”
          each segment.

                                                                         Investor Presentation | 18
Strong Track Record of Sales Wins Across New
    and Existing Clients

            Win Rate ($ basis) as %*                                                              New Clients Won (#)                                                          Average Deal Duration (Days)*

                                                     57%

      55%
                                                                                                                                                                                       119
                                                                                                                                      36                                                                113
                                                                                                                                                                                                                         107
      50%
                                                                                                                     27
                                   45%                                                               24

      45%

               42%
      40%

               2018               2019               2020                                         2018              2019            2020                                              2018             2019             2020

*Win Rates and Average Deal Duration include opportunities from both New and Existing Clients; Deal duration includes number of days between the creation of an opportunity in our opportunity management system and when contract is signed

                                                                                                                                                                              Investor Presentation | 19
Compounding Success

Clients Generating $500K+                 72
per Year in Revenue
                                   57
                            49
                  40

                 2017       2018   2019   2020

                                                 Investor Presentation | 20
Culture: Unique Culture Drives Employee and Client Satisfaction

                       TaskUs 2020                                                                        15%
                      employee NPS                                                                        Voluntary
                                                                                                          Attrition1
                                               72                                                                                          #40 Glassdoor 2019
                                                                                                                                           Best Places to Work

                                                                          TaskUs 2020
                                                                          client NPS

                                                                          75                                                                          4.7
                                                                                                                                   Glassdoor Score2

1
    Voluntary annualized attrition rate in 2020 for employees working for TaskUs for more than 180 days
2
    As of June 2021

                                                                                                                       Investor Presentation | 21
Culture: Unique Culture Drives Employee and Client Satisfaction

   5.0        4.7

                                   4.2   4.2
                                                  4.0
   4.0
                                                            4.0
                                                                    3.8
                                                                             3.8
                                                                                      3.6        3.6
                                                                                                                3.5
                                                                                                                             3.2
   3.0

   2.0

   1.0

    0

            TaskUs             Globant   EPAM   Accenture   Appen   Telus   Genpact   TDCX   24/7 Intouch Teleperformance   Webhelp
         Ratings as of June 2021

                                                                                             Investor Presentation | 22
Expanding Our Global Footprint
                                                             USA
                                                             New Braunfels                            Greece
                                                             San Antonio                              Thessaloniki
                                                             Rio Grande Valley
                                                                                                                                 Taiwan
                                                                                       Ireland                                   Taipei
                                                                                       Dublin                India
                                                                                                             Indore
                                                                                                             Gurugram
                                                                                                             Mohali
                                                         Mexico
                                                         Tijuana

                                                                                 Colombia
      as of June 30, 2021                                                        Cali                                                      Philippines
      Our Global Count                                                                                                                     La Union
                                                                                                                                           BGC, Taguig City

      31,500+                                                                                                                              Anonas
                                                                                                                                           Bulacan
                                                                                                                                           Antipolo
                                                                                                                                           Cavite
                                                                                                                                           Clark, Pampanga
                                                                                                                                           Batangas
                                                                                                                                           Bohol

                                                                                                 Work@Home

Note: Approximate employee numbers as of June 30, 2021

                                                                                                                        Investor Presentation | 23
Financials

             Investor Presentation | 24
Key Financial Highlights

                                                                                                   Recurring revenue model
      FYE 2020                                                        Q2 2021
                                                                                                   Consistent track record of growth and
      $478m                                                           $180m                        profitability
      FY 2020 Revenue                                                 Q2 2021 Revenue

                                                                                                   Strong operating leverage
      32.9%                                                           57.4%                        Focus on high growth technology
      FY 2020 Revenue Growth YoY                                      Q2 2021 Revenue Growth YoY
                                                                                                   disruptors

      22.4%                                                           24.5%                        Significant cross-sell opportunity
      FY 2020 Adj. EBITDA Margin1                                     Q2 2021 Adj.EBITDA Margin1
                                                                                                   High free cash flow conversion
1
    See appendix for reconciliation to most comparable GAAP measure

                                                                                                                 Investor Presentation | 25
Organic and Diversified Growth

                           Revenue by Service Line (%)                                                    Revenue by Delivery (%)                        USD Million

       AI Operations                                                                 RoW
       Content Security                                                       $478   United States                                                   $478
       Digital Customer Experience                                                   Philippines
                                                                            10%                                                                    8%
       All Service Lines                               0   %                         All Delivery Sites                    0 %
                                                 G  R6                                                            G     R6
                                               CA                $360                                           CA                     $360
                                                                            27%                                                                    36%
                                                               14%                                                                  5%

                                                               29%                                                                 37%
                                            $254                                                               $254

                                                                            63%                                                                    56%
                $117                                                                         $117
                                                               57%                                                                 58%

                2017                         2018                    2019     2020           2017              2018                    2019          2020

Note: Numbers may not sum to 100% due to rounding

                                                                                                                      Investor Presentation | 26
Attractive Profitability and Margin Expansion

                                          Adjusted EBITDA1 ($mm)                                        Adjusted Net Income1 ($mm)

                                                                                                                                   15%           15%
                                                                                                             13%
                                                 22%                  21%    22%
       Margin (%)                                                                   Margin (%)

                       18%                                                                       7%

                                                                             $107                                                                $69
                                                                  %                                                         1%
                                                              R 72                                                     R 10
                                                        CAG                                                        CAG
                                                                                                                                    $53
                                                                      $74

                                                  $57                                                        $32

                        $21                                                                      $9

                       2017                      2018                 2019   2020                2017        2018                   2019         2020

1
    See Appendix for reconciliation to most comparable GAAP measure

                                                                                                                    Investor Presentation | 27
Q2 Financial Performance

                   $180.0M                                            57.4%            $44.1M        24.5%                     67.3%
                   Q2 ‘21 Revenue                                     Q2 ‘21 YoY       Q2 ‘21 Adj.   Q2 ‘21 Adj.               Q2 ‘21 Adj.
                                                                      Revenue Growth   EBITDA1       EBITDA Margin1            EBITDA YoY
                                                                                                                               Growth1

                       $114.4M                                        34.2%            $26.4M        23.1%                     56.2%
                       Q2 ‘20 Revenue                                 Q2 ‘20 YoY       Q2 ‘20 Adj.   Q2 ‘20 Adj.               Q2 ‘20 Adj.
                                                                      Revenue Growth   EBITDA1       EBITDA Margin1            EBITDA YoY
                                                                                                                               Growth1

1
    See appendix for reconciliation to most comparable GAAP measure

                                                                                                                 Investor Presentation | 28
Financial Outlook

                                               2021 Outlook

                                   Third Quarter                Full Year

Revenue (in millions)               $182 to $186           $705 to $709

Revenue growth (YoY) at midpoint       50.3%                       47.9%

Adjusted EBITDA Margin             23.1% to 23.5%       23.7% to 24.1%

                                                      Investor Presentation | 29
Appendix

           Investor Presentation | 30
Non-GAAP Reconciliations
      Adjusted EBITDA                                                                                                  USD Thousand

                                           For
                                            Forthe
                                                thethree
                                                    three months endedJune
                                                          months ended June30,
                                                                            30,           For
                                                                                           Forthe
                                                                                                thesix
                                                                                                    six months  endedJune
                                                                                                        months ended  June 30,
                                                                                                                          30,
                                              2021                     2020                  2021                      2020
Net (loss) income                                 $ (105,943)                  $ 8,008              $ (89,436)                 $ 9,523
Provision for (benefit from) income taxes               (7,020)                    1,629                 (3,461)                  1,968
Financing expenses                                       1,594                    1,959                   3,175                  4,202
Depreciation                                             6,729                    5,815                 12,932                  10,529
Amortization of intangible assets                        4,712                    4,712                   9,424                  9,424
EBITDA                                             $ (99,928)                 $ 22,123              $ (67,366)                $ 35,646
Offering costs                                            2,432                       —                    5,761                     —
Foreign currency gains                                 (1,595)                  (1,114)                    (808)                   290
Loss (gain) on disposal of assets                            1                       —                       28                     (5)
COVID-19 related expenses                                3,711                    1,320                   6,105                  3,759
Severance costs                                             —                       472                       —                    570
Natural disaster                                            —                        —                      442                     —
Contingent consideration                                    —                     3,570                       —                  3,570
Phantom share bonus                                  129,362                         —                129,362                       —
Teammate recognition bonus                               4,361                       —                    4,361                     —
Stock based compensation expense                         5,771                       —                    5,771                     —
Adjusted EBITDA                                      $ 44,115                 $ 26,371               $ 83,656                 $ 43,830
Net (Loss) Income Margin                              -58.9%                      7.0%                 -26.9%                    4.4%
Adjusted EBITDA Margin                                  24.5%                    23.1%                   25.1%                  20.2%

                                                                                          Investor Presentation | 31
Non-GAAP Reconciliations
      Adjusted Net Income                                                                                          USD Thousand

                                    For
                                     Forthe
                                         thethree
                                             three months  endedJune
                                                   months ended  June30,
                                                                      30,             For
                                                                                       Forthe
                                                                                           thesix  monthsended
                                                                                               six months endedJune
                                                                                                                June 30,
                                                                                                                    30,

                                       2021                     2020                     2021                      2020
Net (loss) income                          $ (105,943)                  $ 8,008                 $ (89,436)                 $ 9,523
Amortization of intangible assets               4,712                        4,712                   9,424                  9,424
Offering costs                                   2,432                            0                   5,761                        0
Foreign currency gains                         (1,595)                      (1,114)                   (808)                   290
Loss (gain) on disposal of assets                   1                            0                      28                     (5)
COVID-19 related expenses                       3,711                        1,320                   6,105                  3,759
Severance costs                                     0                          472                        0                   570
Natural disaster costs                              0                            0                     442                        0
Contingent consideration                            0                        3,570                        0                 3,570
Phantom share bonus                           129,362                            0                129,362                         0
Teammate recognition bonus                      4,361                            0                   4,361                        0
Stock based compensation expense                5,771                            0                   5,771                        0
Tax impact of adjustments                     (11,440)                           0                (11,440)                        0
Adjusted Net Income                           $ 31,372                 $ 16,968                  $ 59,570                 $ 27,131
Net (Loss) Income Margin                       -58.9%                        7.0%                  -26.9%                    4.4%
Adjusted Net Income Margin                     17.4%                        14.8%                   17.9%                  12.5%

                                                                                      Investor Presentation | 32
Non-GAAP Reconciliations
  Adjusted earnings per share

                                                       For Three
                                                           the three months
                                                                 months     ended
                                                                        ended     June
                                                                               June 30, 30,              Six months
                                                                                                     For the        ended
                                                                                                             six months   JuneJune
                                                                                                                        ended  30, 30,

                                                          2021                    2020                 2021                       2020

GAAP diluted EPS                                                   $ (1.14)               $ 0.09               $ (0.97)                  $ 0.10

Per share adjustments to net (loss) income¹                           1.48                    0.09                 1.61                    0.20

Per share adjustments for GAAP anti-dilutive shares²                 (0.02)                   0.00                (0.01)                  (0.00)

Adjusted EPS                                                        $ 0.32                $ 0.18                 $ 0.63                  $ 0.30

Weighted-average common stock outstanding - Diluted           92,957,493              91,737,020           92,347,257                91,737,020

GAAP anti-dilutive shares²                                       4,599,736                      0           2,299,868                         0

Adjusted weighted-average shares outstanding                  97,557,229              91,737,020           94,647,125                91,737,020

                                                                                                     Investor Presentation | 33
Reconciliations of Adjusted Net Income
                                                                                                                            USD Million

                                                            Jan 1, 2018    Oct 1, 2018
                                                2017
                                                           through Sep    through Dec    Full Year 2018       2019            2020
                                             (unaudited)
                                                             30, 2018       31, 2018

 Net Income (loss)                              $9.0          $33.1          $(0.9)          $32.2            $33.9          $34.5
 Amortization of intangible assets                                            4.7             4.7              18.8           18.8
 Offering costs                                   0.0                                                           0.0             0.90
 Transaction related costs                                     3.7            5.8             9.5
 Foreign currency (gains) losses                (0.4)          1.7            (0.4)           1.3              (2.0)          (1.5)
 Loss (gain) on disposal of assets               0.0           (0.0)          0.6             0.6              2.2            1.1

 Tax benefit from transaction related costs                    (15.9)                         (15.9)            0.0             0.0

 COVID-19 related expenses                                                                                                     7.5

 Severance costs                                                                                                               2.6

 Lease termination costs                                                                                                       1.8

 Natural disaster costs

 Contingent consideration                                                                                                      3.6
 Adjusted Net Income                            $8.6          $22.6           $9.8           $32.4            $53.0          $69.4
 Net Income (Loss) Margin                       7.7%         19.6%          (1.0)%          12.7%             9.4%           7.2%
 Adjusted Net Income Margin                     7.3%         13.4%           11.4%          12.7%            14.7%           14.5%

                                                                                               Investor Presentation | 34
Reconciliations of Adjusted EBITDA                                                                                             USD Million

                                                               Jan 1, 2018    Oct 1, 2018
                                                   2017
                                                              through Sep    through Dec    Full Year 2018       2019            2020
                                                (unaudited)
                                                                30, 2018       31, 2018

 Net Income (loss)                                 $9.0          $33.1          $(0.9)          $32.2            $33.9          $34.5
 Provision for (benefit from) income taxes           5.0           (9.0)          3.4            (5.5)             (4.4)           9.9
 Financing expenses                         0       0.3           0.5            1.5             2.0             07.4.0           7.50
 Depreciation                                       7.1           8.6            3.7            12.2              16.3           20.2
 Amortization of intangible assets                                               4.7             4.7              18.8           18.8
 EBITDA                                            $21.4         $33.2          $12.4           $45.6            $72.1           $90.9
 Offering costs                                                                                                    0.0             0.9
 Transaction related costs                                        3.7            5.8             9.5
 Foreign currency (gains) losses                   (0.4)          1.7            (0.4)           1.3              (2.0)           (1.5)
 Loss (gain) on disposal of assets                  0.0           (0.0)          0.6             0.6              2.2             1.1
 Settlement of 2018 Credit Facility                                                                               2.0
 COVID-19 related expenses                                                                                                        7.5
 Severance costs                                                                                                                  2.6
 Lease termination costs                                                                                                          1.8
 Natural disaster costs
 Contingent consideration                                                                                                         3.6
 Adjusted EBITDA                                  $21.0          $38.6          $18.4           $57.0            $74.2          $106.9
 Net Income (Loss) Margin                          7.7%         19.6%          (1.0)%          12.7%             9.4%           7.2%
 Adjusted EBITDA Margin                           17.9%         22.9%           21.4%          22.4%            20.6%           22.4%

                                                                                                  Investor Presentation | 35
You can also read