Penn National Gaming, Inc - Second Quarter 2021 Earnings Presentation August 5, 2021
←
→
Page content transcription
If your browser does not render page correctly, please read the page content below

ibdroot\projects\IBD-NY\hadley2020\662888_1\Investor Presentation\Template (From PNG)\Project Fastbreak Investor
Presentation (Part 1).pptx

                 Penn National Gaming, Inc                                                                         .
                   Second Quarter 2021
                   Earnings Presentation

                   August 5, 2021

                                                                                                                       1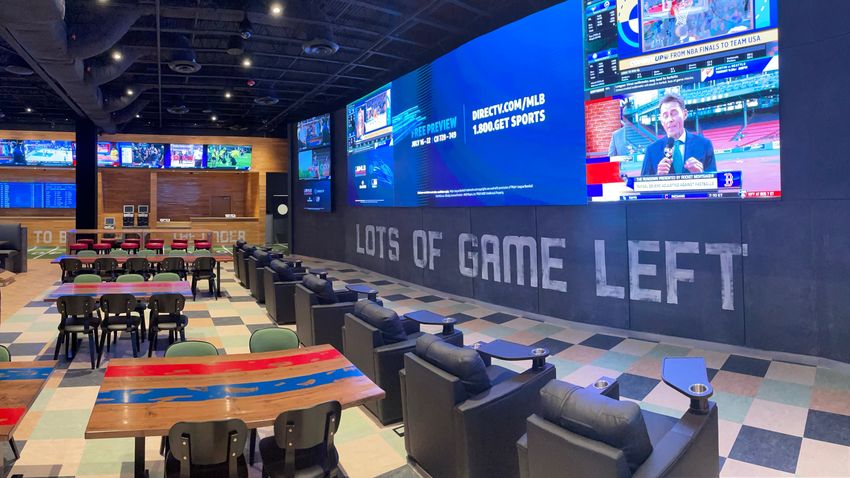
ibdroot\projects\IBD-NY\hadley2020\662888_1\Investor Presentation\Template (From PNG)\Project Fastbreak Investor
        Presentation (Part 1).pptx

 Non-GAAP Financial Measures
In addition to GAAP financial measures, management uses Adjusted EBITDA, Adjusted EBITDAR, Adjusted EBITDAR margin, Combined Revenues, Combined Adjusted EBITDA, Combined Adjusted EBITDAR and Combined Net Income as non-GAAP financial
measures. These non-GAAP financial measures should not be considered a substitute for, nor superior to, financial results and measures determined or calculated in accordance with GAAP. Each of these non-GAAP financial measures is not calculated in
the same manner by all companies and, accordingly, may not be an appropriate measure of comparing performance among different companies. We define Adjusted EBITDA as earnings before interest expense, net; income taxes; depreciation and
amortization; stock-based compensation; debt extinguishment and financing charges; impairment losses; insurance recoveries, net of deductible charges; changes in the estimated fair value of our contingent purchase price obligations; gain or loss on
disposal of assets, the difference between budget and actual expense for cash-settled stock-based awards; pre-opening expenses; and other. Adjusted EBITDA is inclusive of income or loss from unconsolidated affiliates, with our share of non-operating
items (such as interest expense, net; income taxes; depreciation and amortization; and stock-based compensation expense) added back for Barstool Sports, Inc. (“Barstool Sports”) and our Kansas Entertainment, LLC joint venture. Adjusted EBITDA is
inclusive of rent expense associated with our triple net operating leases (the operating lease components contained within our triple net master lease dated November 1, 2013 with Gaming and Leisure Properties, Inc. (“GLPI”) and the triple net master lease
assumed in connection with our acquisition of Pinnacle Entertainment, Inc. (primarily land), our individual triple net leases with GLPI for the real estate assets used in the Operation of Tropicana Las Vegas Hotel and Casino, Inc. and Meadows Racetrack and
Casino, and our individual triple net leases with VICI Properties Inc. for the real estate assets used in the operations of Margaritaville Casino Resort and Greektown Casino-Hotel. Although Adjusted EBITDA includes rent expense associated with our triple net
operating leases, we believe Adjusted EBITDA is useful as a supplemental measure in evaluating the performance of our consolidated results of operations. Adjusted EBITDA has economic substance because it is used by management as a performance
measure to analyze the performance of our business, and is especially relevant in evaluating large, long-lived casino-hotel projects because it provides a perspective on the current effects of operating decisions separated from the substantial
nonoperational depreciation charges and financing costs of such projects. We present Adjusted EBITDA because it is used by some investors and creditors as an indicator of the strength and performance of ongoing business operations, including our ability
to service debt, and to fund capital expenditures, acquisitions and operations. These calculations are commonly used as a basis for investors, analysts and credit rating agencies to evaluate and compare operating performance and value companies
within our industry. In order to view the operations of their casinos on a more stand-alone basis, gaming companies, including us, have historically excluded from their Adjusted EBITDA calculations of certain corporate expenses that do not relate to the
management of specific casino properties. However, Adjusted EBITDA is not a measure of performance or liquidity calculated in accordance with GAAP. Adjusted EBITDA information is presented as a supplemental disclosure, as management believes that
it is a commonly-used measure of performance in the gaming industry and that it is considered by many to be a key indicator of the Company’s operating results.

We define Adjusted EBITDAR as Adjusted EBITDA (as defined above) plus rent expense associated with triple net operating leases (which is a normal, recurring cash operating expense necessary to operate our business). Adjusted EBITDAR is presented on a
consolidated basis outside the financial statements solely as a valuation metric. Management believes that Adjusted EBITDAR is an additional metric traditionally used by analysts in valuing gaming companies subject to triple net leases since it eliminates
the effects of variability in leasing methods and capital structures. This metric is included as supplemental disclosure because (i) we believe Adjusted EBITDAR is traditionally used by gaming operator analysts and investors to determine the equity value of
gaming operators and (ii) Adjusted EBITDAR is one of the metrics used by other financial analysts in valuing our business. We believe Adjusted EBITDAR is useful for equity valuation purposes because (i) its calculation isolates the effects of financing real
estate; and (ii) using a multiple of Adjusted EBITDAR to calculate enterprise value allows for an adjustment to the balance sheet to recognize estimated liabilities arising from operating leases related to real estate. However, Adjusted EBITDAR, when
presented on a consolidated basis, is not a financial measure in accordance with GAAP and should not be viewed as a measure of overall operating performance or considered in isolation or as an alternative to net income because it excludes the rent
expense associated with our triple net operating leases and is provided for the limited purposes referenced herein.

Adjusted EBITDAR margin is defined as Adjusted EBITDAR on a consolidated basis (as defined above) divided by revenues on a consolidated basis. Adjusted EBITDAR margin is presented on a consolidated basis outside the financial statements solely as a
valuation metric.

The Company defines Combined Revenues as revenues of Penn National and Greektown, assuming that Greektown was a part of Penn National during the historical periods beginning on January 1, 2019; further, Combined Revenues are adjusted to
assume that Resorts Casino Tunica was not a part of Penn National during the historical periods beginning on January 1, 2019 as Resorts Casino Tunica ceased operations on June 30, 2019. The Company defines Combined Adjusted EBITDA as Adjusted
EBITDA (as defined above) of Penn National and Greektown, assuming that Greektown was a part of Penn National during the historical periods beginning on January 1, 2019; further, Combined Adjusted EBITDA is adjusted to assume that Resorts Casino
Tunica was not a part of Penn National during the historical periods beginning on January 1, 2019 as Resorts Casino Tunica ceased operations on June 30, 2019. The Company defines Combined Adjusted EBITDAR as Adjusted EBITDAR (as defined above) of
Penn National and Greektown, assuming that Greektown was a part of Penn National during the historical periods beginning on January 1, 2019; further, Combined Adjusted EBITDAR is adjusted to assume that Resorts Casino Tunica was not a part of Penn
National during the historical periods beginning on January 1, 2019 as Resorts Casino Tunica ceased operations on June 30, 2019. The Company defines Combined Net Income as net income of Penn National and Greektown, assuming that Greektown was
a part of Penn National during the historical periods beginning on January 1, 2019; further, Combined Net Income is adjusted to assume that Resorts Casino Tunica was not a part of Penn National during the historical periods beginning on January 1, 2019
as Resorts Casino Tunica ceased operations on June 30, 2019. Management believes that presenting Combined Revenues, Combined Adjusted EBITDA, Combined Adjusted EBITDAR and Combined Net Income for the three and six month period ended
June 30, 2019 is useful for investors to evaluate the Company’s performance for the three and six month period ended June 30, 2021. These results do not reflect any cost savings from potential operating efficiencies or associated costs to achieve such
savings or synergies that are expected to result from these transactions. The Company does not provide reconciliations of Combined Adjusted EBITDA and Combined Adjusted EBITDAR to net income (loss) on a forward-looking basis because the Company
is unable to forecast the amount or significance of certain items required to develop meaningful comparable GAAP financial measures without unreasonable efforts. These items include gains or losses on sale or consolidation transactions, accelerated
depreciation, impairment charges, gains or losses on retirement of debt, which are difficult to predict and estimate and are primarily dependent on future events, but which are excluded from the Company’s calculations of Adjusted EBITDA and Adjusted
EBITDAR.

In addition, this presentation includes estimated operating trends of the Company compared to the same periods in 2019 using monthly property level financials and internally generated daily operating reports. These trends are based on management
estimates only using currently available information, which has not been reviewed by the Company’s auditors, is not subject to the Company’s normal control procedures and has not been prepared in accordance with GAAP. The Company does not
prepare monthly or intra-month property level financials on the same basis as its reported GAAP results and, as a result, the trends reported are based on information that may not be indicative of full quarter or full month results, respectively, for the
Company’s operating segments.

                                                                                                                                                                                                                                                                2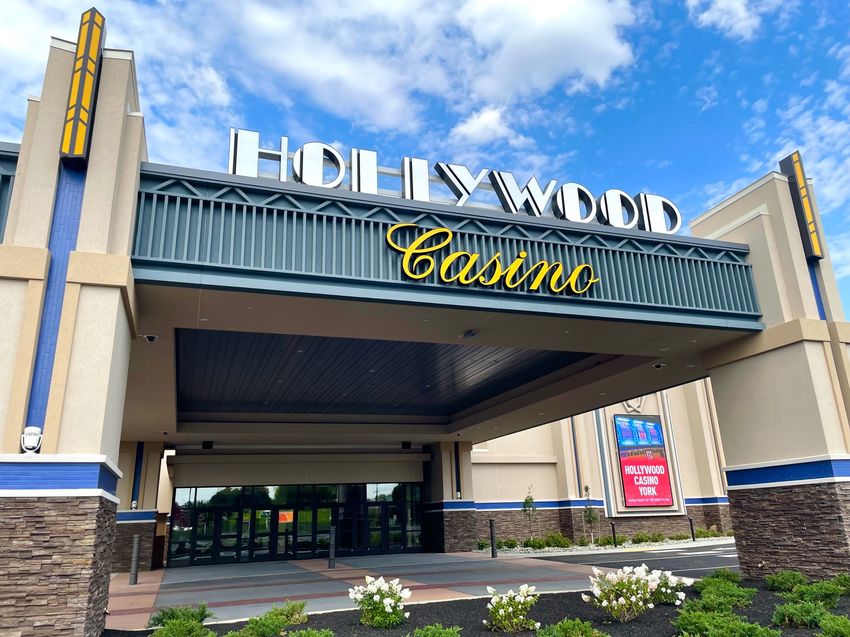
ibdroot\projects\IBD-NY\hadley2020\662888_1\Investor Presentation\Template (From PNG)\Project Fastbreak Investor
         Presentation (Part 1).pptx

   Forward-Looking Statements
This presentation contains “forward-looking statements” within the meaning of the Private Securities Litigation Reform Act of 1995. These statements can be identified by the use of forward-looking terminology such as
“expects,” “believes,” “estimates,” “projects,” “intends,” “plans,” “goal,” “seeks,” “may,” “will,” “should,” or “anticipates” or the negative or other variations of these or similar words, or by discussions of future events,
strategies or risks and uncertainties. Specifically, forward-looking statements include, but are not limited to, statements regarding: COVID-19; continued demand for the gaming properties that have reopened and the
possibility that the Company’s gaming properties may be required to close again in the future due to COVID-19; the impact of COVID-19 on general economic conditions, capital markets, unemployment, and the
Company’s liquidity, operations, supply chain and personnel; the potential benefits of the Perryville transaction with Gaming and Leisure Properties, Inc.; the potential benefits of the Hitpoint transaction; the
Company’s estimated cash burn and future liquidity, future revenue and Adjusted EBITDAR, including from the Company’s iGaming business in Pennsylvania and Michigan; the expected benefits and potential
challenges of the investment in Barstool Sports; the expected launch of the Barstool-branded mobile sports betting product in future states and its future revenue and profit contributions; the Company’s expectations
of future results of operations and financial condition, including margins; the Company’s expectations for its properties and the potential benefits of the cashless, cardless and contactless (“3Cs”) technology; the
Company’s development projects or its iGaming initiatives; the timing, cost and expected impact of planned capital expenditures on the Company’s results of operations; the anticipated opening dates of the
Company’s retail sportsbooks in future states; the Company’s expectations with regard to acquisitions, potential divestitures and development opportunities, as well as the integration of and synergies related to any
companies the Company have acquired or may acquire; the outcome and financial impact of the litigation in which the Company is or will be periodically involved; the actions of regulatory, legislative, executive or
judicial decisions at the federal, state or local level with regard to our business and the impact of any such actions; the Company’s ability to maintain regulatory approvals for its existing businesses and to receive
regulatory approvals for its new business partners; the Company’s expectations with regard to the impact of competition in online sports betting, iGaming and retail/mobile sportsbooks as well as the potential impact
of this business line on the Company’s existing businesses; and the performance of the Company’s partners in online sports betting, iGaming and retail/mobile sportsbooks, including the risks associated with any new
business, the actions of regulatory, legislative, executive or judicial decisions with regard to online sports betting, iGaming and retail/mobile sportsbooks and the impact of any such actions. Such statements are all
subject to risks, uncertainties and changes in circumstances that could significantly affect the Company’s future financial results and business.

Accordingly, the Company cautions that the forward-looking statements contained herein are qualified by important factors that could cause actual results to differ materially from those reflected by such
statements. Such factors include, but are not limited to: (a) the magnitude and duration of the impact of the COVID-19 pandemic on general economic conditions, capital markets, unemployment, consumer
spending and the Company’s liquidity, financial condition, supply chain, operations and personnel; (b) industry, market, economic, political, regulatory and health conditions; (c) disruptions in operations from data
protection breaches, cyberattacks, extreme weather conditions, medical epidemics or pandemics such as the COVID-19, and other natural or man-made disasters or catastrophic events; (d) the Company’s ability
to access additional capital on favorable terms or at all; (e) the Company’s ability to remain in compliance with the financial covenants of its debt obligations; (f) actions to reduce costs and improve efficiencies to
mitigate losses as a result of the COVID-19 pandemic that could negatively impact guest loyalty and the Company’s ability to attract and retain employees; (g) the outcome of any legal proceedings that may be
instituted against the Company or its directors, officers or employees; (h) the impact of new or changes in current laws, regulations, rules or other industry standards; (i) the ability of the Company’s operating teams to
drive revenue and margins; (j) the impact of significant competition from other gaming and entertainment operations; (k) the Company’s ability to obtain timely regulatory approvals required to own, develop and/or
operate its properties, or other delays, approvals or impediments to completing its planned acquisitions or projects, construction factors, including delays, and increased costs; (l) the passage of state, federal or local
legislation that would expand, restrict, further tax, prevent or negatively impact operations in or adjacent to the jurisdictions in which the Company does or seek to do business; (m) the effects of local and national
economic, credit, capital market, housing, and energy conditions on the economy in general and on the gaming and lodging industries in particular; (n) our ability to identify attractive acquisition and development
opportunities (especially in new business lines) and to agree to terms with, and maintain good relationships with partners and municipalities for such transactions; (o) the costs and risks involved in the pursuit of such
opportunities and our ability to complete the acquisition or development of, and achieve the expected returns from, such opportunities; (p) the risk of failing to maintain the integrity of our information technology
infrastructure and safeguard our business, employee and customer data (particularly as our iGaming division grows); (q) with respect to new casinos, risks relating to construction, and its ability to achieve its expected
budgets, timelines and investment returns; (r) the Company may not be able to achieve the anticipated financial returns from the acquisition of Score Media & Gaming, Inc. (“theScore”), including due to fees, costs
and taxes in connection with the integration of theScore and expansion of its betting and content platform; (s) the closing of the acquisition of theScore may be delayed or may not occur at all, for reasons beyond
the Company’s control; (t) the requirement to satisfy the closing conditions in the agreement with theScore, including receipt of regulatory approvals and the approval of shareholders of theScore; (u) there is
significant competition in the interactive gaming market; (v) potential adverse reactions or changes to business or regulatory relationships resulting from the announcement or completion of the acquisition of
theScore; (w) the ability of the Company or theScore to retain and hire key personnel; (x) the occurrence of any event, change or other circumstances that could give rise to the right of one or both of the Company
and theScore to terminate the agreement between the companies; (y) the outcome of any legal proceedings that may be instituted against the Company, theScore or their respective directors, officers or
employees; and (z) other factors as discussed in the Company’s Annual Report on Form 10-K for the year ended December 31, 2020, subsequent Quarterly Reports on Form 10-Q and Current Reports on Form 8-K,
each as filed with the U.S. Securities and Exchange Commission. The Company does not intend to update publicly any forward-looking statements except as required by law. In light of these risks, uncertainties and
assumptions, the forward-looking events discussed in this presentation may not occur.

                                                                                                                                                                                                                               3
ibdroot\projects\IBD-NY\hadley2020\662888_1\Investor Presentation\Template (From PNG)\Project Fastbreak Investor
 Presentation (Part 1).pptx

Second Quarter Financial Highlights
     Second quarter results surpassed 2019 pre-COVID levels by a wide margin. Customer
     visitation has improved over previous quarters and our talented property teams have
                      continued to deliver meaningful margin improvement.

Revenues                                                                                   Net Income                                                                                      Adjusted EBITDAR1
($ in millions)                                                                            ($ in millions)                                                                                 ($ in millions)
                                                                                                                                       $199
                                  $1,546                                                                                                                                                                                           $587
                                                                                                                                                                                                             $424
        $1,369                                                                                                                      +237%                                                                                        +38%
                                 +13%
                                                                                                            $59

                                                                                                      2Q 2019                      2Q 2021                                                               2Q 2019                 2Q 2021
      2Q 2019                   2Q 2021
                             Note: Q2 2019 Revenues, Net Income, Adjusted EBITDA, and Adjusted EBITDAR include proforma adjustments for Greektown and Resorts Casino Tunica. The operating results of                 1   2Q 2021 Adjusted EBITDA was
                             Greektown were derived from historical financial information. The operating results were adjusted to conform to Penn’s methodology of allocating certain corporate expenses to
                             properties. Additionally, the operating results were adjusted to assume that Resorts Casino Tunica was not a part of Penn during the historical periods beginning on January 1, 2019, as     $470m compared to 2Q 2019
                             Resorts ceased operations on June 30, 2019. Q2 2019 metrics are referred to as “Combined Revenues,” “Combined Net Income,” “Combined Adjusted EBITDA,” and “Combined Adjusted                Adjusted EBITDA of $326m
                             EBITDAR.” 2Q 2021 reflects a gross-up of licensing revenue and expenses with respect to reimbursement revenue derived from Skin arrangements, of which $46.0 million was related to
                             gaming taxes. There is no P&L impact as a result of the aforementioned gross-up related to gaming taxes.
                                                                                                                                                                                                                                                     4
ibdroot\projects\IBD-NY\hadley2020\662888_1\Investor Presentation\Template (From PNG)\Project Fastbreak Investor
 Presentation (Part 1).pptx

June + July Operating Trends
  We have seen very strong performance in July, and Adjusted EBITDAR for the two-month
   period ending July 2021 is projected to exceed the same period in 2019 by 40% due
             to higher revenue trends and significant margin improvement.

Revenues                                                                                   Adjusted EBITDAR                                                                                 Adjusted EBITDAR Margin
($ in millions)                                                                            ($ in millions)
                                    $1,043                                                                                             $386                                                                                             37.0%
           $897
                                                                                                        $275                                                                                                                             +632
                                   +16%                                                                                             +40%                                                                  30.7%
                                                                                                                                                                                                                                         bps

          Jun/Jul                 Jun/Jul                                                             Jun/Jul                      Jun/Jul                                                              Jun/Jul                      Jun/Jul
           2019                    2021E                                                               2019                         2021E                                                                2019                         2021E

                             Note: The operating results were adjusted to assume that Resorts Casino Tunica was not a part of Penn National during the historical periods beginning on January 1, 2019, as Resorts Casino Tunica ceased operations on June 30, 2019.
                             June + July 2021 reflects a gross-up of licensing revenue and expenses with respect to reimbursement revenue derived from Skin arrangements , and $29.6 million related to gaming taxes. There is no P&L impact as a result of the
                             aforementioned gross-up related to gaming taxes.
                                                                                                                                                                                                                                                                       5
ibdroot\projects\IBD-NY\hadley2020\662888_1\Investor Presentation\Template (From PNG)\Project Fastbreak Investor
 Presentation (Part 1).pptx

Strong Free Cash Flow Conversion
                    FCF conversion trends highlight Penn’s strong EBITDAR growth and efficient
                                       use of maintenance capex dollars.

Adjusted EBITDAR                                                                          Conversion %                                                                                   Free Cashflow
($ in millions)                                                                           ($ in millions)                                                                                ($ in millions)

                                                                                                                                                                                                                                          $262
                                                                                                                                      45%
                                   $587

                                                                                                                                  +1,407                                                                                                +102%
          $424                  +38%
                                                                                                                                   bps
                                                                                                         31%                                                                                                   $130

    2Q 2019                   2Q 2021                                                               2Q 2019                      2Q 2021                                                                   2Q 2019                      2Q 2021
                              Note: Q2 2019 Adjusted EBITDAR includes proforma adjustments for Greektown and Resorts Casino Tunica (“Combined Adjusted EBITDAR”). The operating results of Greektown were derived from historical financial information.
                              The operating results were adjusted to conform to Penn’s methodology of allocating certain corporate expenses to properties. Additionally, the operating results were adjusted to assume that Resorts Casino Tunica was not a part
                              of Penn during the historical periods beginning on January 1, 2019, as Resorts ceased operations on June 30, 2019. Free cashflow excludes project capex.
                                                                                                                                                                                                                                                                   6
ibdroot\projects\IBD-NY\hadley2020\662888_1\Investor Presentation\Template (From PNG)\Project Fastbreak Investor
 Presentation (Part 1).pptx

Improved Balance Sheet and Liquidity
Our balance sheet and liquidity have improved meaningfully since pre-pandemic periods,
       which positions us well to pursue a variety of long-term growth opportunities.

                                                                                                                                                              Lease-Adjusted
 Total Liquidity                                                                    Traditional Net Debt                                                      Net Leverage1
 ($ in millions)                                                                    ($ in millions)

                                                                                            $2,173                                                                     5.8x
                                    $2,947
                                                                                                                                                                                                 4.0x
                                       $672

            $769                     $2,275
             $390                                                                                                    $116
             $379
         2Q 2019                   2Q 2021                                                 2Q 2019                  2Q 2021                                         2Q 2019                 2Q 2021
         Cash and Cash Equivalent            Revolver Available

                                                                                                                       1    Lease-Adjusted Net Leverage based on Trailing-Twelve-Month Period.
                                                                                                                                                                                                        7
ibdroot\projects\IBD-NY\hadley2020\662888_1\Investor Presentation\Template (From PNG)\Project Fastbreak Investor
   Presentation (Part 1).pptx

Segment Performance Breakdown
We saw strong performance in 2Q across all of our segments, with the South leading the way
                     with Adjusted EBITDAR growth of ~90% v. 2019.

                                               Revenues                                            Adjusted EBITDAR
($ in millions)                          For the three months                                         For the three months            * Other Segment Notes:
                                            ended June 30                                                ended June 30

                                     2021               2020              2019                  2021                  2020    2019     • Strong year-over-year
Northeast                                                                                                                                revenue growth, driven by
                                    $ 653               $ 103             $ 599                  $ 232                $ (4)   $ 186
                                                                                                                                         Penn Interactive
South                                   368                  122               282                   177                44      93
West                                                                                                                                   • Adjusted EBITDAR
                                        140                    18              165                     62               (3)     51
                                                                                                                                         declined due to an
Midwest                                 295                    36              268                   142                (4)     98       increase in corporate
Other*                                    98                   27                  9                (26)                (9)    (21)      overhead, with Penn
Intersegment                                                                                                                             Interactive operating
Eliminations                               (8)                —                 —                                                        above 1Q 2021 levels and
Total                           $ 1,546                 $ 306 $ 1,323                          $ 587                   $24    $407       near ”break-even”
                                                                                                                                         Adjusted EBITDA
                                                                                                                                                                     8
ibdroot\projects\IBD-NY\hadley2020\662888_1\Investor Presentation\Template (From PNG)\Project Fastbreak Investor
 Presentation (Part 1).pptx

Barstool
Penn     Sportsbook
     Interactive Well Launches
                      Positi oned/ for
                                    Upgrades
                                       Growth
We plan to launch the Barstool Sportsbook app in an additional four or five states in time for
football season. By the end of the year, we expect to be live in at least 10 states, while also
                        introducing several new features to the app.

                                                                                                                    Same-Game Parlay   Shareable Betslip
                                                                                                                       Est. 3Q 2021      Est. 3Q 2021

                                                                                                                                                           9
ibdroot\projects\IBD-NY\hadley2020\662888_1\Investor Presentation\Template (From PNG)\Project Fastbreak Investor
   Presentation (Part 1).pptx

Unique Approaches to Marketing
As we head into football season, we will be more aggressive in executing on creative marketing
          campaigns to further widen the funnel into our omnichannel ecosystem.

                                                                                                                      10
ibdroot\projects\IBD-NY\hadley2020\662888_1\Investor Presentation\Template (From PNG)\Project Fastbreak Investor
Presentation (Part 1).pptx
Penn Interactive
Upcoming WellMilestones
iCasino Positi oned for Growth
We are implementing meaningful enhancements to our Barstool-branded iCasino product
beginning this Fall, which we believe will help drive additional market share.
Milestone Anticipated Date
Implementation of ”cash at cage” Sept 2021
withdrawal of funds at Greektown Casino
Addition of more third-party slots and table Fall 2021
games to the app
Launch of custom Barstool-branded live Fall 2021
dealer studio in New Jersey
Introduction of first Barstool-themed games Q4 2021
developed in-house by Penn Game Studios
11ibdroot\projects\IBD-NY\hadley2020\662888_1\Investor Presentation\Template (From PNG)\Project Fastbreak Investor
Hollywood Casino York
Presentation (Part 1).pptx
We expect to open Hollywood Casino York on August 12, pending final regulatory approval. This
facility will feature 500 slots, 24 table games, a Barstool Sportsbook and our new 3Cs technology.
12ibdroot\projects\IBD-NY\hadley2020\662888_1\Investor Presentation\Template (From PNG)\Project Fastbreak Investor
Technology Update
Presentation (Part 1).pptx
Our journey to digitally transform our core gaming business is proceeding rapidly as we
implement technology to improve the customer experience.
Cardless, Cashless and Contactless Key Features
• Mobile card-in to slot machine
• Utilize digital wallet for slots and tables
• Transfer funds between wallet and slot machine
• Fund wallet with debit/credit card, bank ACH –
mobile, at cage with cash or from a kiosk
• Buy-in and redemption of chips at table games
• Responsible Gaming features by jurisdiction
We are now live with the “3Cs” at our two Pennsylvania properties, with
Hollywood York and Hollywood Morgantown to follow upon opening
13ibdroot\projects\IBD-NY\hadley2020\662888_1\Investor Presentation\Template (From PNG)\Project Fastbreak Investor
ESG Update
Presentation (Part 1).pptx
In the second quarter, we awarded the first round of scholarships from the Penn Diversity
Scholarship Program, while continuing to increase our recruiting efforts and support of Historic
Black Colleges and Universities
We awarded
$1,050,000
in total scholarships to
58
children of team members
57%
are first-generation college students
14ibdroot\projects\IBD-NY\hadley2020\662888_1\Investor Presentation\Template (From PNG)\Project Fastbreak Investor
Celebrating Our Diversity
Presentation (Part 1).pptx
• In April, we hosted company-wide “Days of Listening” to gather feedback from team
members on all matters of diversity and inclusion
• In May, we celebrated Asian American & Pacific Islander Heritage Month
• In June, we celebrated Pride Month by sharing stories throughout the organization of
LGBTQ+ champions who have helped change our world
15ibdroot\projects\IBD-NY\hadley2020\662888_1\Investor Presentation\Template (From PNG)\Project Fastbreak Investor
Saluting our Heroes
Presentation (Part 1).pptx
In honor of Armed Forces Day, we launched the “myheroes” program to provide exclusive
discounts and offers at Penn properties to veterans, active-duty military and first responders. On
Memorial Day we announced the creation of the Harold Cramer Memorial Scholarship Fund.
Established to honor one of our first Board members, who had a
decorated career in the U.S. Military, the Harold Cramer
Memorial Scholarship Fund provides financial support to veterans
attending the University of Pennsylvania Carey Law School.
16ibdroot\projects\IBD-NY\hadley2020\662888_1\Investor Presentation\Template (From PNG)\Project Fastbreak Investor
Presentation (Part 1).pptx
Appendix
17ibdroot\projects\IBD-NY\hadley2020\662888_1\Investor Presentation\Template (From PNG)\Project Fastbreak Investor
GAAP to Non-GAAP Reconciliation
Presentation (Part 1).pptx
(1) During 2019, 2020 and during the first quarter of 2021, acquisition costs were included within pre-opening and acquisition costs. As of and for the quarter ended June 30, 2021, acquisition
costs are presented as part of other expenses.
(2) Consists principally of interest expense, net; income taxes; depreciation and amortization; and stock-based compensation expense associated with Barstool Sports, Inc. and our Kansas
Entertainment, LLC joint venture. We record our portion of Barstool Sports, Inc.'s net income or loss, including adjustments to arrive at Adjusted EBITDAR, one quarter in arrears.
(3) Consists of finance transformation costs associated with the implementation of our new Enterprise Resource Management system, other non-recurring transaction costs, and non-recurring
restructuring charges (primarily severance) associated with a company-wide initiative, triggered by the COVID-19 pandemic, designed to (i) improve the operational effectiveness across
our property portfolio; (ii) improve the effectiveness and efficiency of our Corporate functional support area. 18ibdroot\projects\IBD-NY\hadley2020\662888_1\Investor Presentation\Template (From PNG)\Project Fastbreak Investor
GAAP to Non-GAAP Reconciliation
Presentation (Part 1).pptx
Reconciliation of Comparable GAAP Financial Measure to Combined Adjusted EBITDA
and Combined Adjusted EBITDAR
(1) See the “Non-GAAP Financial Measures” section above for more information, including the definition of Combined Adjusted EBITDA and Combined Adjusted
EBITDAR.
19ibdroot\projects\IBD-NY\hadley2020\662888_1\Investor Presentation\Template (From PNG)\Project Fastbreak Investor
GAAP to Non-GAAP Reconciliation
Presentation (Part 1).pptx
Reconciliation of Comparable GAAP Financial Measure to Combined Revenues and
Combined Net Income
(1) The operating results of Greektown were derived from historical financial information. In addition, the operating results were adjusted to conform to Penn National’s
methodology of allocating certain corporate expenses to properties.
(2) The operating results were adjusted to assume that Resorts Casino Tunica was not a part of Penn National during the historical periods beginning on January 1, 2019,
as Resorts Casino Tunica ceased operations on June 30, 2019.
20You can also read