2019 Investor Presentation - FOURTH QUARTER - Regency ...
←
→
Page content transcription
If your browser does not render page correctly, please read the page content below

FOURTH QUARTER
          2019 Investor Presentation

Mellody Farm | Chicago, IL
Table of
                             Contents
                             1
                                 Regency Centers:
                                 A Sector Leader

                             2
                                 Why Invest in
                                 REITs and Retail

                             3
                                 Why Invest in
                                 Regency Centers

                                                  FOURTH QUARTER
                                                                    2
Midtown East | Raleigh, NC             2019 INVESTOR PRESENTATION
1
                         Regency Centers:
                         A Sector Leader

                                             FOURTH QUARTER
                                                               3
The Abbot | Boston, MA            2019 INVESTOR PRESENTATION
REGENCY CENTERS: A SECTOR LEADER

     Regency Overview

                                                   R E G E N C Y AT A G L A N C E

                     1963                   REG           S&P 500             $15B+                  419
                      Founded                Nasdaq           Member           Market Cap      properties located
                                                                                               across the country

                   >95%                    56M+ SF          9000+              $22+                80%
                        Leased              Total GLA       Total Tenants     PSF Average      of properties are
                                                                            Annual Base Rent   grocery anchored

                                                                                                               FOURTH QUARTER
                                                                                                                                    4
Village at La Floresta | Los Angeles, CA                                                            2019 INVESTOR PRESENTATION
REGENCY CENTERS: A SECTOR LEADER

     Consistent Growth of Net Operating Income

Sources: Regency's pro-rate share, company filings as of 12/31/2019.                 FOURTH QUARTER
                                                                                                          5
i Effective 3/1/2017, Regency merged with Equity One.                     2019 INVESTOR PRESENTATION
REGENCY CENTERS: A SECTOR LEADER

Regency Centers: The Leading National Shopping Center REIT
Unequaled Competitive Advantages Position Regency for Superior Growth

          PREEMINENT NATIONAL PORTFOLIO                              SUPERIOR TENANT & MERCHANDISING MIX

       nnLargest shopping center REIT with 400+ properties            nnFocus on necessity, value, convenience, and
          located in the nation's most vibrant markets                    service-oriented retailers
       nnNeighborhood and community shopping centers                  nnPortfolio strength and tenant quality demonstrated by
          primarily anchored by highly productive grocers                 resilience to store closures and leading Same Property
                                                                          NOI performance
       nnWell located in highly affluent and dense infill
          trade areas positioned for growth

                                                               Unequaled
                                                             Combination of
                                                                Strategic
                                                              Advantages                 SELF-FUNDING,
          BEST-IN-CLASS PLATFORM                                                     OPPORTUNISTIC CAPITAL
            FOR VALUE CREATION                                                       ALLOCATION STRATEGY &
                                                                                    BALANCE SHEET STRENGTH
     nnNational platform of 22 local offices creates
        unequaled boots-on-the-ground and local
        expertise advantages                                           nnFree cash flow is the foundation of our self-funded
                                                                         leverage neutral capital allocation strategy
     nnIntense asset management is the foundation of
        Regency's ability to achieve Same Property NOI growth          nnOpportunistically sell minimal level of lower growth
        at or near the top of the shopping center sector                  assets to further enhance portfolio quality and
                                                                          Same Property NOI growth
     nnRegency's in-process projects, pipeline, and key tenant
        and local relationships create value through                   nnWell-capitalized and flexible balance sheet to
        the development and redevelopment of premier                      support growth
        shopping centers

                                                                                                                               FOURTH QUARTER
                                                                                                                                                    6
                                                                                                                    2019 INVESTOR PRESENTATION
REGENCY CENTERS: A SECTOR LEADER

     Sustained Dividend Growth

                                               Regency is committed to growing dividends per share
                                                  while maintaining a conservative payout ratio.

Source: Company filings                                                                                            FOURTH QUARTER
                                                                                                                                        7
i Peers are BRX, SITC, FRT, KIM, ROIC, RPAI, and WRI                                                    2019 INVESTOR PRESENTATION
REGENCY CENTERS: A SECTOR LEADER

     Strong Balance Sheet Position

  S&P Credit Rating              BBB+ (Positive Outlook)

  Moody’s Credit Rating          Baa1 (Positive Outlook)

  Net Debt to EBITDAre           5.4x

  Fixed Charge Coverage Ratio    4.3x

  Debt as a % of Market Cap      31%

                                                           Village at Tustin Legacy | Tustin, CA
                                                                                                                 FOURTH QUARTER
                                                                                                                                      8
Company Filings as of 12/31/19                                                                        2019 INVESTOR PRESENTATION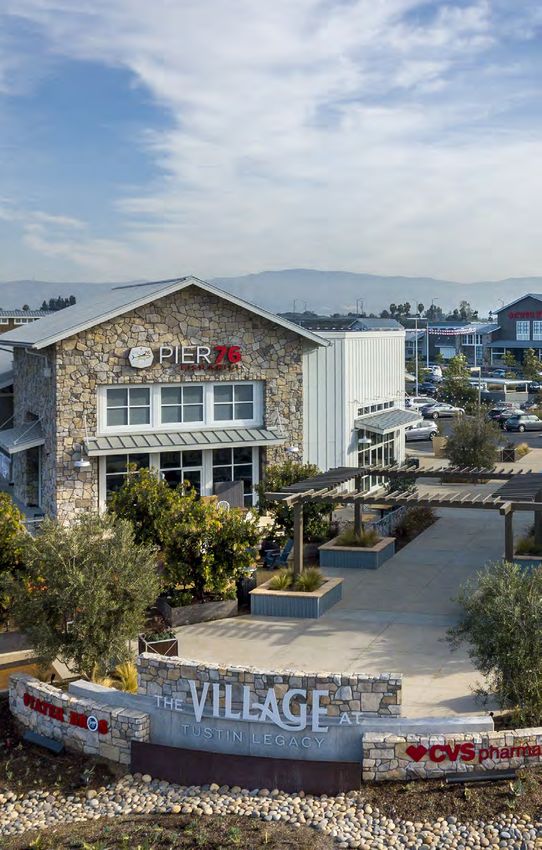
REGENCY CENTERS: A SECTOR LEADER

    Well-Laddered Debt Maturity Schedule

                          UNCONSOLIDATED DEBT - SECURED                            CONSOLIDATED DEBT - SECURED                    UNSECURED DEBT - BONDS   UNSECURED DEBT - BANK

                                                                                 Wtd Avg Interest Rate:                              3.8%

                                                                                 Wtd Avg Yrs to Maturity:                           9+ Yrs

                                                                                 Total Pro Rata Debt:                               $4.4B

(i) Unsecured revolving credit facility maturity date through 2022, the Company has two 6 month options to extend through 2023.                                               FOURTH QUARTER
                                                                                                                                                                                                   9
Source: Company Filings as of 12/31/2019                                                                                                                           2019 INVESTOR PRESENTATION
REGENCY CENTERS: A SECTOR LEADER

 Leading Corporate Responsibility Practices

                                       OUR                                ETHICS AND                       ENVIRONMENTAL
      OUR PEOPLE                       COMMUNITIES                        GOVERNANCE                       STEWARDSHIP
nnGreater than 85%               nnNearly $1.4M in employee      nnISS Quality Score of          nnAchieved GRESB Green Star
   engagement score from             & company donations.             1 for Governance.                5 consecutive years.
   annual employee survey.
                                  nnMore than 95% of              nn27% female representation     nnAchieved 41% cumulative
nnRecognized by Quantum             employees give to the            on Board of Directors.           reduction in Greenhouse Gas
   Workplace as one of the top       annual United Way                                                 emissions since 2011.
                                                                   nnEstablished a Corporate
   20 organizations with the         campaign.
                                                                      Responsibility Committee to   nnAchieved a 28% cumulative
   Employee Voice Award.
                                  nnMore than 75% of                 lead ESG initiatives.           reduction in energy
nnRecipient of the First Coast      employees give their time                                        consumption since 2011.
   Healthiest Companies Award        to Regency-sponsored
                                                                                                    nnIncreased composting by
   for 11 consecutive years.         community service projects.
                                                                                                       44% over 2017.
nnRegency employees
   average over 20 hours of
   training per year.
                                                                                                                        FOURTH QUARTER
                                                                                                                                          10
                                                                                                             2019 INVESTOR PRESENTATION
2
Why Invest in
REITs and Retail
FOURTH QUARTER
11
Carytown Exchange | Richmond, VA 2019 INVESTOR PRESENTATIONWHY INVEST IN REITS AND RETAIL
REITs Provide Solid Long-Term Investment Performance
20-Year Total Returns by Sector
REITs historically have delivered competitive total returns,
with consistent dividend income and long-term capital appreciation
REITs represent the FTSE NAREIT Equity REITs Index and is a free-float adjusted, market capitalization-weighted index of U.S. equity REITs. Constituents of the index include all tax-qualified
REITs with more than 50 percent of total assets in qualifying real estate assets other than mortgages secured by real property. Sector returns are derived from GICS Sector Indexes. FOURTH QUARTER
12
Source: Bloomberg, Represents data from June 30,1999 - June 30, 2019. 2019 INVESTOR PRESENTATIONWHY INVEST IN REITS AND RETAIL
Fact: Retail Real Estate is Thriving
$541B 8,500+ 56%
increase in brick & mortar Net increased store of chains added
retail sales since 2014 count since 2017 stores in 2019
5:1 75%
of all store
ratio of retailers opening closings came from
stores versus closing just 20 companies
in 2019
FOURTH QUARTER
13
IHL Study: 1660 retailers and restaurant chains with 50 or more stores. 2019 INVESTOR PRESENTATIONWHY INVEST IN REITS AND RETAIL
Retail & Value of Physical Locations
Retailers continue to validate the importance of physical store locations
as a critical component to any successful omnichannel strategy.
As consumer shopping patterns through various channels BOPIS (Buy Online Pickup In Store) is bringing increased
continue to evolve, retailers are placing an increased emphasis foot traffic to retail centers. According to research, over 50%
on having physical locations in the most well-located and of adult shoppers use BOPIS, with more than 2/3 of those
best-in-class merchandised centers in desirable trade areas consumers then buying additional items from the retailer
with purchasing power. when picking up their online purchases in store.
Online sales increase by an average of 30-70% when a retailer
also has physical locations in that trade area.
FOURTH QUARTER
14
2019 INVESTOR PRESENTATIONWHY INVEST IN REITS AND RETAIL
Shoppers are Increasing Visits to Grocery Anchored Retail Centers
Change in Frequency of Visits to Retail Locations
SHOPPING CENTER WITH A SUPERMARKET AS THE MAIN STORE OUTLET MALLS LARGE REGIONAL SHOPPING MALLS
SHOPPING CENTER WITH ANOTHER TYPE OF ANCHOR STORES THAT ARE NOT PART OF A SHOPPING CENTER OR MALL
FOURTH QUARTER
15
Sources: UBS Evidence Lab 2019 INVESTOR PRESENTATIONWHY INVEST IN REITS AND RETAIL
Grocery-Anchored Advantage
nnA focus on necessity, service, convenience, and value is
increasingly critical in today’s retail landscape.
nnGrocery stores are the foundation of retail and the most visited of
any retail category. The average consumer goes to the grocery
store 1.6x per week.
nnGrocery anchored centers are more resistant to store
rationalization from disruptors, including e-commerce.
nnLast mile delivery is costly and not profitable. Grocery anchored
centers located close to the customer are the foundation of a
successful multi-channel strategy, allowing customers to buy
online and pick-up in store, or conveniently access the store for an
in-store experience.
The Field at Commonwealth | Washington, D.C.
FOURTH QUARTER
16
2019 INVESTOR PRESENTATIONWHY INVEST IN REITS AND RETAIL
Connecting with Thriving Grocers
Top grocers are investing in their physical footprint to provide a seamless and
differentiated shopping experience to meet the evolving needs of their customers.
68 REG Locations 56 REG Locations 33 REG Locations 46 REG Locations 4 REG Locations
Albertsons/Safeway
Publix continues to Kroger is partnering
Amazon has is investing $1 billion Wegmans
invest in both new and with Ocado, one of
announced an annually related to is partnering with
existing locations with the largest online
aggressive roll out in store remodel Door Dash to offer
plans to redevelop grocery delivery
of physical locations, and technology delivery of the grocer's
many stores as part companies in the
including a new enhancements, prepared foods.
of their $1.5B capital world to build 20
35K SF full service including partnering They plan to open
plan. On average, the fulfillment centers
grocery store in with Takeoff 15 new stores in 2020
company has open over the next 3 years
addition to their Technologies to and beyond. Wegmans
~30 new stores a year to better service
acquisition of Whole build microfulfillment average store size is
for the last 6 years. their customers.
Foods in 2017. centers within over 100K SF.
select stores.
FOURTH QUARTER
17
Green Street Advisors, Company Filings & Websites, Creditntell 2019 INVESTOR PRESENTATIONWHY INVEST IN REITS AND RETAIL
Expanding Retailers
Best-in-Class Operators Opening New Locations in High-Quality Centers
Many relevant retailers are prospering, offering innovative merchandising and compelling value
propositions all supported by strong balance sheets and expanding store counts.
62 REG Locations 6 REG Locations 19 REG Locations 26 REG Locations
Expects ~230 new
Anticipate current
store openings in Long-term goal of
remodel pace of ~300
2020. They believe 1,500 to 1,700 new Opened 100 new
stores in 2020, and
their long-term stores, with 80 new stores in 2019
150 to 200 stores per
potential is another stores added in 2019.
year beyond 2020.
1,800 stores.
35 REG Locations 10 REG Locations 2 REG Locations 8 REG Locations
Opened 150 Currently has over
Opened 110 stores
Vision is to open new stores in 1,800 locations
in 2019 and plans to
250-300 new studios 2019 and announced and expects to
open an additional
a year. plans to open 180 reach 4,000 gyms
100 stores in 2020.
new in 2020. nationwide long-term.
FOURTH QUARTER
18
Sources: Green Street Advisors, Company Filings, Creditntell special Analysis 2019 INVESTOR PRESENTATION3
Why Invest in
Regency Centers
FOURTH QUARTER
19
Ballard Blocks | Seattle, WA 2019 INVESTOR PRESENTATIONWHY INVEST IN REGENCY CENTERS
Strategic Objectives
HIGH-QUALITY PORTFOLIO
Long-Term Average Annual NOI Growth of 3%+
High-quality portfolio of shopping centers with
enduring competitive advantage from desirable
trade areas and highly productive grocers
ASTUTE CAPITAL ALLOCATION
Deliver $1.25 to $1.50 billion of development
and redevelopment starts and deliveries over
the next 5 years at attractive returns and fortify
NOI growth by astute asset recycling
SECTOR-LEADING FORTRESS
BALANCE SHEET
Provides funding flexibility and cost advantages
BEST-IN-CLASS BUSINESS
PRACTICES AND SYSTEMS
Implement operating systems, including
Environmental, Social and Governance practices,
which are widely recognized as best in class
STRONG BRAND AND CULTURE
Engage an exceptional team of professionals
and best-in-class business practices that are
recognized as industry-leading
FOURTH QUARTER
20
2019 INVESTOR PRESENTATIONWHY INVEST IN REGENCY CENTERS
Strong Organic Growth Generating Solid Long-Term Returns
Long-term Strategic Objective to Average Annual Total Shareholder Returns of 8%+
Long-Term
Strategic Objective
Long-Term Same Property NOI Growth 3.0%+
Net Investment Activity + 1.0%+
Core Operating Earnings Annual Growth* = 4.0%+
Dividend Growth + 4.0%+
Average Annual Total Return = 8.0% - 10%+
*Core Operating Earnings (COE): An additional performance measure used by Regency as the computation of NAREIT FFO includes certain non-comparable items that affect the Company's
period-over-period performance. Core Operating Earnings excludes from NAREIT FFO: (i) transaction related income or expenses (ii) gains or losses from the early extinguishment of debt;
(iii) certain non-cash components of earnings derived from above and below market rent amortization, straight-line rents, and amortization of mark-to-market of debt adjustments; and (iv) FOURTH QUARTER
21
other amounts as they occur. The Company provides a reconciliation of Net Income Attributable to Common Stockholders to NAREIT FFO to Core Operating Earnings. 2019 INVESTOR PRESENTATIONWHY INVEST IN REGENCY CENTERS
Roadmap to 3.0%+ Average Annual Same Property NOI Growth
Same Property NOI Growth
FOURTH QUARTER
22
2019 INVESTOR PRESENTATIONWHY INVEST IN REGENCY CENTERS
Operational Best Practices
Same Property NOI Growth
Fresh Look® isn't just a philosophy; it's Local Sharpshooters – We have Big Data - Smart phone tracking
the driving force behind creating ideal 22 regional offices located in the technology allows us to see the number
locations with best-in-class retailers markets we operate. This gives us an of visits to our centers each day/
representative of the communities we unmatched local expertise that allows week/year, who our visitors are (via
serve. We combine unique placemaking us to make the best strategic decisions demographic insights), and our center’s
designs with the right merchandising within each market. relative competitive position within
mixes, and connect with our shoppers each trade area. By tracking these
through community outreach and an metrics, we can make inferences on
active social media presence. These how to constantly improve our centers’
innovative destinations are crafted one merchandising mix, performance, and
at a time by our team. the community it serves.
FOURTH QUARTER
23
2019 INVESTOR PRESENTATIONWHY INVEST IN REGENCY CENTERS
Significant Presence in Top Markets with Strategic Advantages
from National Breadth and Local Expertise
Same Property NOI Growth
TOP REGIONS/STATES TOP 5 MARKETS ATTRACTIVE OVERALL DEMOGRAPHICS*
% of NOI
>25% of NOI
Regency Peersi
San Francisco 11%
Average trade area population 145,000 132,000
11% - 25% of NOI Miami 9%
Washington, DC 9% Average household income $122,000 $110,000
5% - 10% of NOI
Los Angeles 8% College educated 49% 43%WHY INVEST IN REGENCY CENTERS
Premier Asset Quality and Trade Areas
Same Property NOI Growth
Premier centers are those with inherent characteristics that will position a
center for long-term competitive advantages, resulting in superior NOI growth,
including strong trade areas that feature buying power and spending growth
surrounding a shopping center with a top competitive position.
Asset Quality DNAi
FOURTH QUARTER
25
Company proprietary data 2019 INVESTOR PRESENTATIONWHY INVEST IN REGENCY CENTERS
Sector Leading Asset Quality
Same Property NOI Growth
i. Weighted average based on total pro rata GLA. FOURTH QUARTER
26
ii. Company filings through period end 12/31/2019, WRI's still reflects 3Q19 results. 2019 INVESTOR PRESENTATIONWHY INVEST IN REGENCY CENTERS
High-Performing Tenants with Strong Financial Credit
Same Property NOI Growth
Moody's PRIVATE Baa1 PRIVATE A2 A3 BAA2 BAA1 PRIVATE BA2 A2
S&P PRIVATE BBB PRIVATE A+ AA- BBB BBB PRIVATE BB A-
FOURTH QUARTER
27
i. Annualized base rent as of 12/31/2019 2019 INVESTOR PRESENTATIONWHY INVEST IN REGENCY CENTERS
Superior Merchandising Mix
Same Property NOI Growth
A necessity, service, convenience, and
value focus is increasingly critical in
today’s retail landscape and resistant
to store rationalization from disruptors,
including e-commerce.
Regency’s thoughtful and strategic mix of
diverse merchants across our portfolio of
400+ centers provides us with the ability
to attract best-in-class tenants in each
category while limiting the possibility of
over exposure to any one type of retailer.
FOURTH QUARTER
28
2019 INVESTOR PRESENTATIONWHY INVEST IN REGENCY CENTERS
Highly Productive Grocers
Same Property NOI Growth
Regency’s portfolio is 80% grocer anchored, with grocer sales that average ~$650 PSF
annually versus the national average of $450 PSF. A testament to the locations,
relevance of grocers, and enduring quality of our centers.
Note: Sales for grocers that report.
i. 2016 adjusted to 52 week year. FOURTH QUARTER
29
*Pro-rata share of base rent from grocers as of 12/31/2019 2019 INVESTOR PRESENTATIONWHY INVEST IN REGENCY CENTERS
Sector Leading Performance - Strong Occupancy
Same Property NOI Growth
Company filings as of 09/30/2019.
Peers are AKR, BRX, SITC, FRT, KIM, ROIC, RPAI, UE, WRI. FOURTH QUARTER
30
*Shop tenant represent any tenant occupying less than 10,000 SF. 2019 INVESTOR PRESENTATIONWHY INVEST IN REGENCY CENTERS
Track Record of Sustained Outperformance
Same Property NOI Growth
Regency has a proven track record of sector-leading same property NOI growth
over the long term. We are confident in our ability to achieve our objective of
averaging same property NOI growth of 3%+ over the long-term.
Source: Citi, theHunter for 2019E growth, Company filings FOURTH QUARTER
31
Note: Peer Avg excludes REG. REG reflects actuals through 2019 2019 INVESTOR PRESENTATIONWHY INVEST IN REGENCY CENTERS
Disciplined Capital Allocation Strategy
Accretive Net Investment Activity
Sources of Capital Uses of Capital
Development &
Redevelopment spend
Free cash flow Free Cash Flow is the
Foundation of our Self-
on projects at
accretive yields
after capitals
$250M+
Funded Leverage Neutral
and dividends Capital Allocation Strategy
ANNUALLY
Additional Additional
Discretionary Sources Discretionary Uses
EQUITY
DISPOSITION
when priced SHARE
OF LOWER ACQUISITIONS
attractively REPURCHASES
GROWTH ASSETS with superior
DEBT when priced
~1% of $15B growth
on a leverage attractively
portfolio
neutral basis
FOURTH QUARTER
32
2019 INVESTOR PRESENTATIONWHY INVEST IN REGENCY CENTERS
Development & Redevelopment Leading to Significant Value Creation
Accretive Net Investment Activity
Regency invests in Premier Shopping Centers in dense infill and affluent areas
with dominant anchors and a focus on long-term growth potential.
Average Annual Development & Redevelopment Activity
Strategic Objective to Deliver $1.25 billion to $1.50 billion of development
~$250M and redevelopments over the next 5 years
~7.0% Yield on Developments & Redevelopments
~1.0% Incremental COE per share growth
FOURTH QUARTER
33
Company filings as of 12/31/2019. 2019 INVESTOR PRESENTATIONWHY INVEST IN REGENCY CENTERS
Major Redevelopment Pipeline Contributing $45M+ of NOI
Over the Next 5+ Years
Accretive Net Investment Activity
2018 2019 2020 2021 2022 2023 2024 2025 2026
Market Common Clarendon START INITIAL NOI STABILIZED
The Abbot START INITIAL NOI STABILIZED
Serramonte Center Phase I START INITIAL NOI STABILIZED
START
Serramonte Center Phase II STABILIZED
INITIAL NOI
Serramonte Center Phase III START INITIAL NOI STABILIZED
Westbard Square START INITIAL NOI STABILIZED
Gateway Plaza at Aventura START INITIAL NOI STABILIZED
Town & Country Center START INITIAL NOI STABILIZED
Costa Verde Center START INITIAL NOI STABILIZED
Hancock Center START INITIAL NOI STABILIZED
ESTIMATED PROJECT START ESTIMATED INITIAL NOI COMMENCEMENT ESTIMATED STABILIZATION YEAR
FOURTH QUARTER
34
2019 INVESTOR PRESENTATIONWHY INVEST IN REGENCY CENTERS
Select In-Process Major Redevelopments
Accretive Net Investment Activity
Market Common Clarendon The Abbot Serramonte Center
Market Washington, D.C. Boston, MA San Francisco, CA
Incremental
Cost
$54M $52M $125M - $135M
Incremental
Stabilized Yield
8.9% 9.3% 5.5%
Initial Rent
Commencement/Est. 2020/2023 2021/2022 2020/2024
Stabilization Year
NOI Disruption None ~$1M in 2019 ~$1.5M in 2020
Description Modernizing a 1960's era Generational mixed-use Redevelopment consists of
office building into a mixed-use redevelopment of 3 historic 3 projects phased over 4 years:
building anchored by a luxury buildings in the heart of Addition of Regal theater and
fitness club user; two- Harvard Square relocation of Crunch Fitness,
story of creative office, modernization of mall interior,
and ground floor retail to and redevelopment of the
compliment the established JCPenney box
community retail center
FOURTH QUARTER
35
2019 INVESTOR PRESENTATIONWHY INVEST IN REGENCY CENTERS
Select Near-Term Major Redevelopments
Accretive Net Investment Activity
Westbard Square Costa Verde Center Town and Country Center
Market Washington, D.C. San Diego, CA Los Angeles, CA
Incremental
Cost
$110M - $125M $175M - $200M $20M - $30M
Estimated
Project Start
2020 2021 2021
Initial Rent
Commencement/Est. 2022/2026 2024/2025 2024/2026
Stabilization Year
NOI Disruption ~$1M in 2020, ~$2M subsequent yrs ~$1M in 2020, ~$3M in 2021 None
Description Converting dated, Giant-anchored Large-scale redevelopment of Redevelopment of vacant former
center into a vibrant vertical mixed- existing shopping center with new K-mart box with new retail below
use project consisting of retail, retail, office, hotel (on a ground ~300 mid-rise apartments on a
anchored by Giant, 200 multi- lease) and structured parking, ground lease.
family units, 100 assisted living adjacent to a new transit station.
units, and 100 for-sale townhomes.
FOURTH QUARTER
36
2019 INVESTOR PRESENTATIONWHY INVEST IN REGENCY CENTERS
Sustained Dividend Growth
Dividend Growth
Regency is committed to growing dividends per share.
FOURTH QUARTER
37
Source: Company filings 2019 INVESTOR PRESENTATIONWHY INVEST IN REGENCY CENTERS
Strong Organic Growth Generating Solid Long-Term Returns
Track Record of Sector Leading Total Returns
Long-Term
Strategic Objective
Long-Term Same Property NOI Growth 3.0%+
Net Investment Activity + 1.0%+
Core Operating Earnings Annual Growth = 4.0%+
Dividend Growth + 4.0%+
Average Annual Total Return = 8.0% - 10%+
FOURTH QUARTER
38
Company Filings 2019 INVESTOR PRESENTATIONWHY INVEST IN REGENCY CENTERS
Experienced and Deep Management Team
Mike Mas Mac Chandler Jim Thompson
Lisa Palmer
Executive Vice President, Executive Vice President, Executive Vice President,
President and CEO
Chief Financial Officer Chief Investment Officer Chief Operating Officer
Years of Experience
Years of Experience Years of Experience Years of Experience
Regency 23 | Industry 23
Regency 17 | Industry 17 Regency 20 | Industry 28 Regency 38 | Industry 38
Alan Roth
Managing Director
Years of Experience
Regency 22 | Industry 23
Nick Wibbenmeyer
Managing Director
Years of Experience
Regency 15 | Industry 17
John Delatour
Managing Director
Years of Experience
Regency 23 | Industry 37
Craig Ramey
Managing Director
Years of Experience
Regency 22 | Industry 33
FOURTH QUARTER
39
2019 INVESTOR PRESENTATION2020E Earnings Guidance
All figures pro-rata in thousands, except per share information
2020E
Net Income / Share $1.47 - $1.50
NAREIT FFO / Share $3.90 - $3.93
Same Property
Same property NOI growth without termination fees (pro-rata) 0.0%+
New Investments
Development and Redevelopment starts (pro-rata) +/- $200,000
Estimated yield (weighted average) +/- 7.0%
Development and Redevelopment spend (pro-rata) +/- $300,000
Acquisitions (pro-rata) +/- $75,000
Cap rate (weighted average) +/- 4.5%
Disposition Activity
Dispositions +/- $200,000
Cap rate (weighted average) +/- 5.5%
FOURTH QUARTER
40
2019 INVESTOR PRESENTATIONGlossary of Terms
Adjusted Funds From Operations (AFFO): An additional performance measure used by Regency that reflects cash available to
fund the Company’s business needs and distribution to shareholders. AFFO is calculated by adjusting Operating FFO for (i) capital
expenditures necessary to maintain the Company’s portfolio of properties, (ii) interest charges and (iii) other non-cash amounts as
they occur.
Non-Same Property: During either calendar year period being compared, a property acquired, sold, a Property in
Development, a Development Completion, or a property under, or being positioned for, significant redevelopment that distorts
comparability between periods. Non-retail properties and corporate activities, including the captive insurance program, are part
of Non-Same Property.
Operating EBITDAre: NAREIT EBITDAre is a measure of REIT performance, which the NAREIT defines as net income, computed in
accordance with GAAP, excluding (i) interest expense; (ii) income tax expense; (iii) depreciation and amortization; (iv) gains on sales
of real estate; (v) impairments of real estate; and (vi) adjustments to reflect the Company’s share of unconsolidated partnerships
and joint ventures. Operating EBITDAre excludes from NAREIT EBITDAre certain non-cash components of earnings derived from
above and below market rent amortization and straight-line rents. The Company provides a reconciliation of Net Income to NAREIT
EBITDAre to Operating EBITDAre.
Core Operating Earnings (COE): An additional performance measure used by Regency as the computation of NAREIT FFO
includes certain non-comparable items that affect the Company's period-over-period performance. Core Operating Earnings
excludes from NAREIT FFO: (i) transaction related income or expenses (ii) gains or losses from the early extinguishment of debt;
(iii) certain non-cash components of earnings derived from above and below market rent amortization, straight-line rents, and
amortization of mark-to-market of debt adjustments; and (iv) other amounts as they occur. The Company provides a reconciliation
of Net Income Attributable to Common Stockholders to NAREIT FFO to Core Operating Earnings.
Same Property: Retail Operating Properties that were owned and operated for the entirety of both calendar year periods being
compared. This term excludes Property in Development, prior year Development Completions, and Non-Same Properties. Property
in Redevelopment is included unless otherwise indicated.
Value Creation: The estimated incremental value at completion using underwritten NOI at stabilization, valued at a market cap rate
less estimated development costs.
FOURTH QUARTER
41
2019 INVESTOR PRESENTATIONSafe Harbor and Non-GAAP Disclosures
Forward-looking statements involve risks and uncertainties. Actual future performance, outcomes and results may differ materially
from those expressed in forward-looking statements. Please refer to the documents filed by Regency Centers Corporation with
the SEC, specifically the most recent reports on forms 10K and 10Q, which identify important risk factors which could cause actual
results to differ from those contained in the forward-looking statements.
This presentation references certain non-GAAP financial measures. More information regarding these non-GAAP financial measures
can be found in company documents filed with the SEC.
FOURTH QUARTER
42
2019 INVESTOR PRESENTATIONYou can also read