Urban Growth and Water Supply System in the Hill Town, Dharamshala, India
←
→
Page content transcription
If your browser does not render page correctly, please read the page content below
Urban Growth and Water Supply System in the Hill Town,
                     Dharamshala, India

                        Sandeep Sharma1, Mahua Mukherjee2, and Deepak Khare3
                         1, 2,3
                                Indian Institute of Technology Roorkee, Roorkee, India
                   1
                     National Institute of Technology Hamirpur, Himachal Pradesh, India
               { ssharma@ar.iitr.ac.in1, mahua1965@gmail.com2, kharefwt@gmail.com3 }

Abstract: Water scarcity is one of the major problems in hill towns. Increasing urban population,
infrastructure development, climate change and the decrease in groundwater recharge is intensifying
water problems in hill towns. After the notification of the first hill town, Dharamshala, under a smart
city provision on dated 24th. June 2016 (Governor et al., 2016) has been taken as a case study. This may
lead to amplify the urban growth of the hilltown and resulting in an instant hike in urban population.
With this increase, its effects on water demand also get greater than before, but the resources are
static. The findings of this research highlight the diverse water supply systems of Dharamshala case and
explore the probability of tapping water sources through different ways and means. The paper also
discusses the allocation of different water resources with respect to the residents and finding the gap
between water supply and demand. The water supply stress index (WaSSI) is supposed to be used in the
study area to know about the intensity of stress which leads to frame plausible guidelines and
deliberations. The study will help in arriving at some feasible solutions to deal with the problem of
increasing demand-supply gap.

Keywords: Water supply system; smart city; urban growth; water supply stress index (WaSSI); hill towns.

    1. Introduction
This is the need of an hour to manage water in the highly urbanized areas, especially in hills. These hill
towns are the tourist destination due to their serene environment. We can’t stop cities to grow or get
urbanized but side by side we have to plan our self to manage water services to fulfill their demands,
especially in summer season in which the tourists flow is on the peak. Particularly, Shimla, Manali, and
Dharamshala are the most affected hill towns of Himachal Pradesh due to the tourist thrust regarding
water scarcity. In 2018, Shimla administration took a harsh decision by saying “no” to the tourists to visit
Shimla in summer season due to the shortage of water. We live in a deeply divided and unequal world
that is changing very fast. Most of our cities, towns, and villages continued to be unliveable, unsafe and
increasingly inhuman. But this need not be true for the future. The process of Indian organization if
adequately organized and managed with wisdom foresight and focus on implementation and details,
can change our everyday urban reality. Worldwise the population accelerate by three times within 100

       Revisiting the Role of Architecture for 'Surviving’ Development. 53rd International Conference of the
       Architectural Science Association 2019, Avlokita Agrawal and Rajat Gupta (eds), pp. 31–40. © 2019
       and published by the Architectural Science Association (ANZAScA).
32 S. Sharma, M. Mukherjee and D. Khare
years and the water demand increased by six times. In every 20 years, water consumption as human use
becomes double, which is more than twice the rate of increase in population (Environmental, 2009). In
1951, only 5 Indian cities were there with a population of more than 1 million and 41 cities with
population more than 0.1 million. Most of the population lived in villages- about 0.56 million, but now in
2011, there are 3 cities having population more than 10 million and 53 cities with a population of more
than 1 million. More than 833 million Indians live in 0.64 million villages and 377 million live in 8000
urban centers (Revi, 2012). At present 50% of the world’s population resides in urban areas (Liang,
2011). It is estimated that about 60% of the world’s population becomes urbanized up to 2025 (Global
Water Partnership and Rees, 2006). People started moving towards urban centers to get good facilities
and life. It is the presumption of mankind that cities are more good liveable places as compare to
villages. Which may be true due to the facilities they are getting in the town. All these Hilltowns got
overcrowded beyond the carrying capacity of that region. So the administration wouldn’t able to fulfill
the facilities of water requirements and other commodities. Many settlements are shifting from rural to
urban category. Large cities of the 20th century are growing slow pace but the smaller one is developing
at a faster pace (Revi, 2012). As the population grows, it put more pressure on the commodities
specifically the water facilities. As the population grows, the water demand will automatically have
enhanced. This demand of water expected to grow by more than 40% until 2050 (Eliasson, 2015). There
will be a scarcity of water as the population growth (Eliasson, 2015). The volume of public water-use
depends upon the size of the urban population. As the urban population grows up, the requirement of
water will also have got accelerated (Durga Rao, 2005). Climate change, floating population, and
inherent urban growth has led to the depletion in natural water sources. The impacts of climate change
are visible on water supply and the gap in demand and supply is increasing at an alarming rate.
Therefore, water insecurity happens due to non-consideration of water governance problems and the
failure in urban planning, floating population as the tourists as well as the climate change, which worsen
the situation (Singh et al., 2019). Literature also talks about the pressure on freshwater by the increase
in urban growth and economic development, leads to incremental water demand (Savić, Vamvakeridou-
Lyroudia and Kapelan, 2014). Also, there will be an increase in per capita water demand which is directly
proportionate to population growth (Hurlimann and Wilson, 2018). Urbanisation along with climate
change, prone to affect water availability and demand (Eggimann et al., 2017). So it becomes more
essential to manage water in this rapid urbanisation (Liu, Giurco and Mukheibir, 2017).
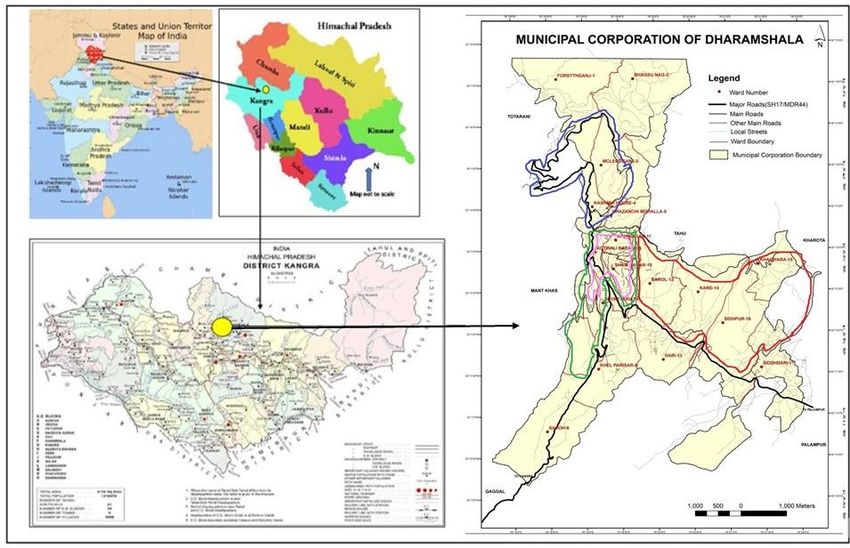
2. Study area
The present investigation has been carried out in the hill town of Dharamshala of district Kangra in
Himachal Pradesh, India, as shown in Figure 1. This is the second capital of Himachal Pradesh state
(Singh, 2017) and located on latitude 32023’ North, longitude, 76032’ East. The average elevation of the
town is 1457m from mean sea level, but it ranges from 1250m to 2082m. It considered as the first smart
city of the hill state Himachal Pradesh. Dharamshala is one of the fastest-growing urban centers after
declaring as Smart city (Governor et al., 2016). People start attracting towards this hill town due to its
importance and serene environment. From the last decade, there is a huge increase in population. As
per the census, 2011 the town (urban area) has only 30,764 people, but now the number reaches up to
53,553 in 2015 with a growth rate of 74.08% within 5 years of time span. Another reason for
acceleration is the addition of new wards/areas. This population growth of the town is much higher than
the national level growth of the urban areas which is crossing 30% as per census 2011.Urban Growth and Water Supply System in the Hill Town, Dharamshala, India 33
Figure 1: Location Map of Dharamshala in Kangra District and Himachal Pradesh State.
3. Data collection and methodology
This study is based on primary and secondary data. Primary data collected from the fields and the
secondary data is collected from the government offices like Municipal Corporation; Town and Country
Planning office and IPH i.e. Irrigation & Public Health Department Dharamshala. Additional data would
be collected from published and unpublished literature for validation of the statements. All the
statistical analysis was carried out in MS-Excel. The city receives rainfall with an average annual
precipitation of 2433 millimeters (Bhagat, Singh and Kumar, 2006). But now this rainfall trend is
continuously decreasing after validating through the Mann- Kendall test of seasonal and annual rainfall
as shown in Table 1. The data required for this study are the rainfall only. This rainfall data has been
collected from the Indian Meteorological site of Indian Water Portal for time series-years 1901-2002
(Indian Meteorological Department and Portal, 2019) and the rest of the data collected from
Meteorological Centre, Shimla, H.P (Shimla, 2019). From Table 1 it can be seen that the district Kangra
receives the highest rainfall of 250.90 mm followed by the month, August is having rainfall 246.72 mm.
The monthly mean is lowest in November i.e. 7.50 mm followed by October is 12. 58 mm. From MK test
it is also found the lesser coefficient of variation (CV) of these two months, July and August which is 0.55
& 0.56 respectively. These two months falls in monsoon period and the rainfall of these two months
contributes about 54% of the total rainfall for the whole period of the year. So, for the whole period
water will be preserved in the form of lakes, ponds, aquifers, rivers/ khads and in the form of
groundwater. During this period cloud burst and flash floods also take place. The pre-monsoon and
post-monsoon rainfall is less and contributes for the remaining 46% of the total rainfall for the whole
year. The annual mean rainfall in Kangra district is 916.30 mm along with a standard deviation of 353.7134 S. Sharma, M. Mukherjee and D. Khare
mm and CV of 0.39%. However, finally, annual rainfall trend value (-2.04) (Table 1) depicts a negative
trend which exceeds the value (-1.96) at a 95% level of significance. The average monthly mean,
standard deviation, and coefficient of variation of rainfall for 117 years (Kangra district) are computed as
given in Table 1. Mann- Kendall (MK) test has been carried out for getting the trend of rainfall. Temporal
variation of a monthly series from January to December from years 1901 to 2017, of rainfall of Kangra,
has been calculated. To get an idea of rainfall trend, annually, a data series of 117 years of Kangra for
the total annual rainfall has been analyzed. Overall annual data trend series of Kangra shows decreasing
trend as shown in Table 1 (i.e.-2.04). In the years 2012-2014, the rainfall trend was increasing, but after
that, it drops down in the next consecutive years.
Table 1: Monthly, annually and seasonally (Pre- Monsoon, Monsoon, Post- Monsoon, and Winter) rainfall
mean, standard deviation (SD), coefficient of variation (CV) and rainfall trends for 117 years – 1901 to 2017, of
Kangra District, H.P.
Months Mean (mm) SD (mm) CV (%) Trend (mm/ year)
January 35.37 25.85 0.73 -1.85
February 37.38 30.15 0.81 -1.61
March 34.61 31.56 0.91 -2.07*
April 21.82 15.9 0.73 -1.1
May 25.2 18.24 0.72 -0.7
June 91.06 72.98 0.8 -2.00*
July 250.9 137.71 0.55 -2.34*
August 246.72 137.68 0.56 -1.02
September 136.32 89.15 0.65 -2.08*
October 12.58 16.6 1.32 -1.59
November 7.5 11.95 1.59 -2.33*
December 16.83 17.41 1.03 -2.05*
Annually 916.3 353.71 0.39 -2.04*
Pre-Monsoon 65.05 38.9 0.6 -2.74*
Monsoon 423.16 205.27 0.49 -2.08*
Post- Monsoon 149.32 89.96 0.6 -1.84
Winter 64.87 34.08 0.53 -2.17*
Note: The normalized test statistic (Z) has been calculated @ 95% confidence level for getting the trend as
shown in bold and marked ‘*’. (value of Zstrd at 5% of the level of significance or @ 95% confidence level is
1.96).
Trends of rainfall have been calculated by using a non-parametric test (Mann-Kendall) to measure
the possibility of increasing (+ve) and decreasing (-ve) trend w.r.t ‘0’ up to the level of significance (5%)
i.e. the value should lie beyond -1.96 to +1.96 in the rainfall time series. Seasonal data have also been
calculated to get accurate variations in trends, seasonally. Seasonal distribution of rainfall is divided into
major four categories, namely: 1. Pre- Monsoon, 2. Monsoon, 3. Post- Monsoon, and 4. Winter. Pre-
Monsoon includes: March, April, and May months, Monsoon include: June, July, and August months,
Post- Monsoon includes: September, October, and November, and Winter include December, January,
and February months. Dharamshala situated very near to the Dhauladhar mountain range. It
experiences snowclad mountain almost throughout the year. The snowfall playas a major role for the
water requirement. The perineal rivers flow throughout the year due to snow meltwater.Urban Growth and Water Supply System in the Hill Town, Dharamshala, India 35
4. Urban Growth in Dharamshala Hilltown
Dharamshala comprising of Planning as well as Municipal area. The area comes under planning is 41.63
Km2 and Municipal council constitutes in 10.63 Km2. Administratively, Dharamshala town was divided
into 11 wards, when it was Municipal Council. In 2015, for involving town under the smart city, which is
based on population, the administration took the decision to involve few villages in MC limit. Also, the
Dharamshala Municipal Council got upgraded to Municipal corporation with the addition of 6 wards. So
restructuring has been done during that period by merging those villages and finally 11 wards converted
to 17 wards. Now, at present, Dharamshala Municipal Corporation comprises of 17 wards and area
increased from 10.63 Km2 to 27.60 Km2 (Department and Pradesh, 2017). After the notification of the
first hill town, Dharamshala, under a smart city provision on dated 24th. June 2016 (Governor et al.,
2016), the urban growth pressure would become very high and may lead to an instant hike in urban
population. Dharamshala area growth is not limited to the Municipal limit but the Out Growth (OG) area
too.
Table 2: Population growth of Dharamshala town (MC area) since 1901 - 2015 year, as per census data of India.
Year Population Source % age increase/ decrease
1901 6971 Census data
1911 6923 Census data -0.69
1921 4904 Census data -29.16
1931 6359 Census data 29.67
1941 9653 Census data 51.80
1951 9933 Census data 2.90
1961 10255 Census data 3.24
1971 10939 Census data 6.67
1981 14522 Census data 32.75
1991 17493 Census data 20.46
2001 19124 Census data 9.32
2011 30764 Census data 60.87
2015 53543 MC Dharamshala 74.04
Figure 2: Bar chart of urban population growth. Figure 3: Line diagram of urban population growth36 S. Sharma, M. Mukherjee and D. Khare
The trend of urban growth in Dharamshala from 1901 to 2015 has been analyzed and is shown in Table
2. The primary and secondary data of Complete urban population growth pattern of Dharamshala town
urban area/ MC area has been taken as per the census data of India, from 1901 to 2011, 2015
population have been taken from MC Dharamshala site (Dharamshala, 2019), and graphical projections
in the form of bar chart as shown in Figure 2 and line diagram as shown in Figure 3 are made
accordingly.
As per the census 2011, Dharamshala town or M.C. Area had a population 22,586 but it’s Out
Growth (OG- Out Growth is the area surrounding the main town and depending on it. Out Growth data
is taken from Census data) had a population 8,178 which together make a total urban population of
30,764. With a growth rate of 60.87 % as shown in Table 3 from 2001 to 2011. Table 2 shows that there
is huge incremental growth in population from 2011 to 2015 with a growth rate of 74.04%.
Table 3: Growth Rate in Population in Dharamshala Planning Area, 2001‐11
Population Growth Rate (%)
S.No. Description 1981 1991 2001 2011 2001-2011
Dharamshala
1 Planning area 22161 41109 51871 62279 20.07
Dharamshala Urban
(Municipal Limit +
2 Outgrowth) 14522 17493 19124 30764 60.87
4.1 Decadal built-up area growth of Dharamshala town (MC + Out Growth)
Decadal growth has been analyzed by using the NDBI- Normalized Difference Built Index of
Dharamshala town. Built-up maps of the town for the years 1987, 1997, 2007 and 2017 have been
analyzed and the percentage growth in built-up areas has been tabulated as shown in Table 4. The
percentage growth for every decade has been calculated and found 2.80% growth rate from 2007 to
2017, 1.95% rate from 1997 to 2007 and 6.79% rate from 1987 to 1997 from Table 4.
Table 4: Decadal built-up area trend analysis (NDBI) of Dharamshala town from 1977 to 2017
Year BUILT-UP AREA (sq km) %age
2017 8.08 2.80
2007 7.86 1.95
1997 7.71 6.79
1987 7.22
1977 DATA NAUrban Growth and Water Supply System in the Hill Town, Dharamshala, India 37
5. Overview of water resources in Dharamshala town
A water supply system (WSS) of Dharamshala town depends upon springs and streams originating high
above in the Dhauladhar hills. Seasonal recharge of these watersheds and flows in various springs and
khads substantially depends upon rainfall trends (Jaswal et al., 2015), snowfall, rate of snowmelt,
landuse in the catchment, and climate change, urbanisation, etc.. About 70-80% of the water supply is
from gravity-fed natural sources (Department and Pradesh, 2017). The water supply system of
Dharamshala is catered by mainly Glenmore spring, Bagsunag spring, Charan Khad, Bather khad, and
Gajeu Nalaha and two tube wells (Sterkele and Zurbrügg, 2003). The two streams of Batherkhad and
Chaurankhad are perennial streams and feeds the central water supply system. Bhagsunag spring
supplies water to the village of Bhagsunag and parts of McLeod Ganj. The spring at Glennmore is used to
supply Forsythganj. Upper Dharamshala has low groundwater potential, whereas large groundwater
aquifers are assumed in lower Dharamshala as per the Irrigation and Public Health Department (Sterkele
and Zurbrügg, 2003). The city receives high rainfall with an average annual precipitation of 2433
millimeters (Bhagat, Singh and Kumar, 2006). The list of all water sources along with their individual
estimated capacity is shown in Table 5.
Table 5: An overview of existing water resources of water along with estimated capacity,
Dharamshala.
Source Type Estimated capacity [m3/d]
Bather khad Perennial stream 4200
Chauran khad Perennial stream 1100
Bhagsu spring Spring 360
Glennmore Spring Spring 10
Gajeu Nalaha Nallaha 50
Others Tube wells 180
Total 5900 m3/d (Say 5.90 MLD)
(Source: IPH, Department, Dharamshala)
6. Water supply network in Dharamshala town
WSS in Dharamshala town is divided into 7 zones (Irrigation & Public Health Department, 2018).
Average water supplied at a rate of 80 (Department and Pradesh, 2017) liters per capita per day (LPCD).
As against the total water requirement of 7.2 MLD in Municipal Corporation area at a rate of 135 LPCD,
only 5.9 MLD is available to the city from 5 main sources (Department and Pradesh, 2017). This deficit of
1.30 MLD is going on increasing day by day. Henceforth, there is an enormous gap between water
supply and the demand, especially in summer when there is a huge tourist inflow. This supply and
demand gap goes on increasing, resulting in water scarcity of the town. And the administration has to
take harsh steps by saying ‘no’ to the tourists to visit Hilltowns during the summer season, causing
financial loss to the town and the GDP also got affected. Even the livelihood of hill settlements depends
upon the tourists. But due to water scarcity, they are inadequate of providing facilities to the tourists as
well as to fulfill their own requirements. On average, the inhabitants are getting 1-hour water supply or
sometimes the water reaches to their taps on the third day in summer. In rural areas, water is supplied38 S. Sharma, M. Mukherjee and D. Khare
at a rate of 70 LPCD (Department and Pradesh, 2017), and the primary source of water is tube well,
spring source, hand pump, etc.
7. Exploration of water resources in the city (Dharamshala)
Since there is a deficit in water supply from the existing sources of water, the only way left for fulfilling
the water requirements is by exploring other ways and means. Also, due to climate change, the
efficiency of water resources got affected and decreasing day by day. During the physical survey of the
town, it has been noticed that after getting piped water supply to every individual household, the
traditional water resources become redundant which are abundantly available in the town. Before this
100% piped water supply, the inhabitants were dependent on these traditional water resources which
are known as Baudi, Nauwn, Kuhal, and Churudu, etc. As the quantity of water of existing resources are
static or decreasing due to the climate change, so we have to explore the additional sources to meet out
the water demand which is amplifying day by day. Reusing of wastewater which is about 80% of the
water used, is also an additional water resource. Small and medium-sized wastewater treatment plants
(Ostoich et al., 2017) can be established and reclaimed water can be generated, which helps in lowering
down the pressure on freshwater (Langergraber et al., 2018). A few depressions/ ponds/ catchments are
also available in the town, which is not in use and can be rejuvenated and becomes an additional
resource of water.
8. Allocation of water resources with respect to settlements
Earlier settlements were located near to the water resources. The reason behind this was the
importance of water in our daily life and also this helps in the easy conveyance of water to the end-users
with optimal pressure. In Dharamshala hilltown, the resources are generally available at valley level and
at the upper side of the settlements, near to mountain range. About 80% of the water intake points are
fed by natural gravity system which is located near to the mountain range. So the water conveyed
through gravity and reaches to the intake units, further conveyed to the inhabitants after the treatment,
through overhead reservoirs or the underground reservoirs, located according to the settlements. A few
locations which are new or expanded during the temporal growth of the town got affected by the water
pressure issue due to their odd situations with respect to the reservoirs. So there is a scope of
constructing additional decentralized reservoirs to serve all inhabitants till the end-user. And also to
revive the traditional resources which were situated within the settlements to act as an additional
resource.
9. Introduction of water supply stress index (WaSSI)
To address water shortage issue, the Water Supply Stress Index (WaSSI) has been developed (Steven G.
McNulty, Ge Sun, Jennifer A. Moore Myers, Erika C. Cohen and Caldwell, 2011) to quantitatively assess
the relative magnitude of water supply and demand. With the use of the US Geological Survey’s eight-
digit hydrologic unit code (HUC, the following formula was developed:
WaSSI= WD/WS (1)
In which WD is water demand and WS is water supply. On the basis of the formula, the WaSSI
classification system was determined.
Normal condition = > 30%
Abnormally stressed = 20-30%Urban Growth and Water Supply System in the Hill Town, Dharamshala, India 39
Moderately stressed = 10-20%
Severely stressed = 5-10%
Extremely stressed = 2-5%
Exceptionally stressed = 0-2%
Applying this formula, it was determined that WaSSI classification for Dharamshala town is 1.69 %
which comes under exceptionally stressed condition.
10. Conclusion
From the urban population growth pattern, it has been clear that the hill town Dharamshala
experienced a tremendous hike in the urban population which leads to putting more pressure on water
infrastructure. However, water resources still remain unchanged. Five water sources in the town of
Dharamshala are also unable to meet the city's water requirement. So how the water authorities will be
able to fulfill the smart city mission of providing 24X7 water to the hill town of Dharamshala. There
would be some generic solutions for tackling water scarcity problems in Hilltowns, not specifically to
Dharamshala but in rest of the Hilltowns as well. As we know that there is not enough scope of
augmenting the sources of water, so the only solution left for getting alternate water sources to fulfilling
the demand is the reuse of wastewater or the greywater (Díaz et al., 2016), which is 80% of the used
water. Redistribution of treated wastewater saves nearly 30 % of water use. So one should make
attempts to optimize the use of freshwater through redirecting the left-out wastewater back in
circulation. Nearly 25% of such water is proposed to be used at city level parks, recreational areas, and
other ancillary activities. The author also suggesting for the rejuvenation of traditional resources for
fulfilling the water demand. Presently these resources are not in use for many years/ decades, since the
households got piped water supply. So these can be made an additional water resource. These
traditional sources not only proving water to the inhabitants but also helps in recharging groundwater.
Finally, there should be enforced legislation for using a single drop of water from the rooftop as a
rainwater harvesting, which may be directly used for many purposes without its treatment and resulting
in putting less pressure on freshwater. These measures help to achieve sustainable water management
systems in Hilltowns.
11. References
Bhagat, R., Singh, S. and Kumar, V. (2006) Agro- Ecological Zonation of Himachal Pradesh-
Agricultural System Information Development at micro-level.
Department, T. and C. P. and Pradesh, G. of H. (2017) Dharamshala Planning Area Development
Plan- 2035.
Dharamshala, M. C. (2019) Demographics - MCD-Dashboard-Document Management System.
Available at: https://edharamshala.in/Content/Demographics (Accessed: 25 July 2019).
Díaz, P. et al. (2016) ‘Shifting paradigms, changing waters: Transitioning to integrated urban
water management in the coastal city of Dunedin, USA’, Sustainable Cities and Society. doi:
10.1016/j.scs.2016.03.016.
Durga Rao, K. H. V (2005) ‘Multi-criteria spatial decision analysis for forecasting urban water
requirements: A case study of Dehradun city, India’, Landscape and Urban Planning, 71(2–4), pp. 163–
174. doi: 10.1016/j.landurbplan.2004.03.001.40 S. Sharma, M. Mukherjee and D. Khare
Eggimann, S. et al. (2017) ‘The Potential of Knowing More: A Review of Data-Driven Urban Water
Management’, Environmental Science and Technology, 51(5), pp. 2538–2553. doi:
10.1021/acs.est.6b04267.
Eliasson, J. (2015) ‘The rising pressure of global water shortages’, Nature, 517(7532), p. 6. doi:
10.1038/517006a.
Environmental, W. (2009) ‘Urban Water and Wastewater Management in 2050’, pp. 2345–2354.
Global Water Partnership and Rees, J. A. (2006) Urban water and sanitation services; an IWRM
approach - TEC Background Papers. Available at: http://eprints.lse.ac.uk/33451/.
Governor, T. et al. (2016) Government of Himachal Pradesh, Department of Urban Develop ment,
Dharamshala, Smart City Notification.
Hurlimann, A. and Wilson, E. (2018) ‘Sustainable urban water management under a changing
climate: The role of spatial planning’, Water (Switzerland), 10(5), p. 546. doi: 10.3390/w10050546.
Indian Meteorological Department and Portal, I. W. (2019) Met Data, Web Link. Available at:
https://www.indiawaterportal.org/met_data/ (Accessed: 26 July 2019).
Irrigation & Public Health Department, D. (2018) ‘Improvement of distribution system of water
supply system in Dharamshala town, Distt. Kangra (H.P).’ Dharamshala.
Jaswal, A. K. et al. (2015) ‘Seasonal and annual rainfall trends in Himachal Pradesh during 1951-
2005’, 2(April), pp. 1–2.
Langergraber, G. et al. (2018) ‘Small wastewater treatment plants in Austria – Technologies,
management and training of operators’, Ecological Engineering. doi: 10.1016/j.ecoleng.2018.05.030.
Liang, X. (2011) The economics of sustainable urban water management- the case of Beijing.
Liu, A., Giurco, D. and Mukheibir, P. (2017) ‘Advancing household water-use feedback to inform
customer behaviour for sustainable urban water’, Water Science and Technology: Water Supply, 17(1),
pp. 198–205. doi: 10.2166/ws.2016.119.
Ostoich, M. et al. (2017) ‘The control of small and medium sized public wastewater treatment
plants in the Veneto region (North Italy): General situation, critical issues and case studies’, Water
Practice and Technology. IWA Publishing, 12(4), pp. 761–779. doi: 10.2166/wpt.2017.082.
Revi, A. (2012) ‘Indian Institute for Human Settlements_2011_Urban India 2011 Evidence’.
Available at: http://iihs.co.in/wp-content/uploads/2013/12/IUC-Book.pdf.
Savić, D., Vamvakeridou-Lyroudia, L. and Kapelan, Z. (2014) ‘Smart meters, smart water, smart
societies: The iWIDGET project’, Procedia Engineering, 89, pp. 1105–1112. doi:
10.1016/j.proeng.2014.11.231.
Shimla, M. C. (2019) Meteorological Centre, Shimla, Meteorological Centre Shimla. Available at:
https://weathershimla.nic.in/ (Accessed: 26 July 2019).
Singh, S. et al. (2019) ‘Urbanisation and water insecurity in the Hindu Kush Himalaya: Insights
from Bangladesh, India, Nepal and Pakistan’, Water Policy, pp. 1–24. doi: 10.2166/wp.2019.215.
Sterkele, B. and Zurbrügg, C. (2003) ‘Baseline Study on Water Supply , Sanitation and Solid Waste
in Upper Dharamsala , India’, (February).
Steven G. McNulty, Ge Sun, Jennifer A. Moore Myers, Erika C. Cohen, P. and Caldwell (2011)
‘Robbing Peter to Pay Paul: Tradeoffs Between Ecosystem Carbon Sequestration and Water Yield’,
Watershed Management 2010 © ASCE 2011, pp. 431–442.
There is a section break below, please do not delete it.
There is a section break above, please do not delete it.You can also read