Kaiapoi - where business belongs
←
→
Page content transcription
If your browser does not render page correctly, please read the page content below
Kaiapoi
_______________________________________________________________________________________

AN ECONOMIC AND BUSINESS PROFILE FOR KAIAPOI AND THE WIDER WAIMAKARIRI DISTRICT 2015

                                                                     where
                                                                     business
                                                                     belongs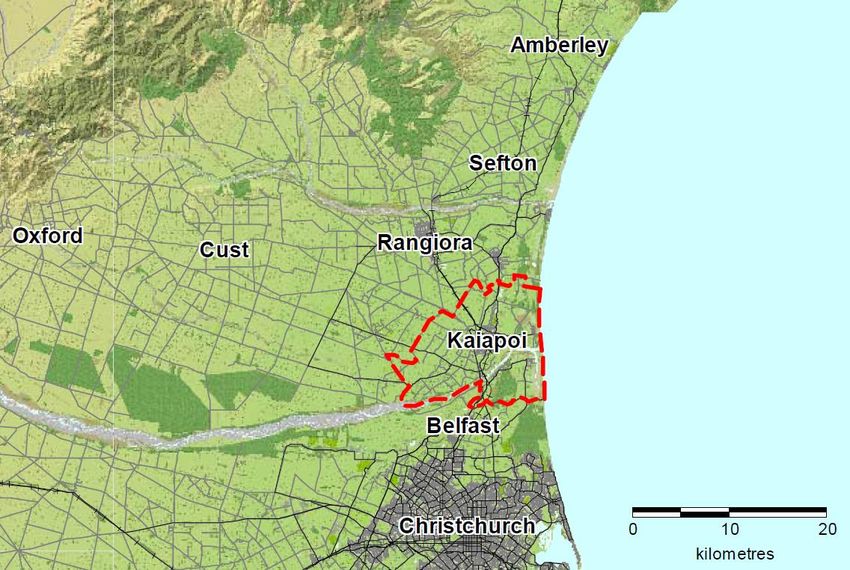
Kaiapoi and the wider Waimakariri District
Economic and Business Overview 2015
Introduction
Quick Facts about Kaiapoi Growth & Economy:
The Waimakariri District extends from
Pegasus Bay in the east to the Puketeraki Home to about 10,700 residents; town population
expected to grow to about 13,500 in the next ten
Range in the west, and is bounded by the years
Waimakariri River in the south and the Seen as local service centre by wider catchment of
Hurunui District in the north. The District Kaiapoi, Pines and Kairaki Beach and Clarkville; by
has an area of 225,000 hectares and is 2038, will be nearest centre for some 8,700
home to 54,400 residents in 2014. The households
371 building consents for new residential dwellings
vast majority of the District’s population
in 2014; more than 1,000 over last 3 years
live in the eastern part. Town centre could sustain additional near 5,000m2
retail floorspace by 2036 to meet growth and
Kaiapoi forms Waimakariri District’s demand
second largest urban area after Rangiora, Business numbers in Kaiapoi and surrounds
at an estimated population of 10,700 in increased by 12% in last 10 years
2014, and has been identified as one of Most Kaiapoi employees work in manufacturing
sector followed by the retail/wholesale sector and
Greater Christchurch’s Key Activity
then construction, employees in the latter having
Centres, recognising its role in the wider risen dramatically in recent years; highest number of
area in clustering community, retail, business units represent finance/professional
residential and business activities, as well services sector followed by construction
as being a key node for transport and Economic environment recovering post-quake – net
other infrastructure. Key activity centres employee count is much higher in 2014 than in 2010
with new businesses having located in Kaiapoi;
are defined as existing and proposed number of businesses has also recovered
commercial/business centres identified as
focal points for employment and the transport network and suitable for more intensive mixed‐use
development.
Kaiapoi was severely affected by the September 2010 earthquake both in terms of damage to
infrastructure, town centre buildings and consequentially businesses, as well as damage to
residential properties and land with more than 1000 properties deemed unsuitable for prolonged
occupation and many residents displaced. However, the town has made significant steps in the last
3+ years in both recovery and rebuild. With historic and projected growth, diverse existing
businesses, significant investment at the outskirts and a town centre that is undergoing intensive
revitalisation both in the public realm and commercial build, Kaiapoi presents unprecedented
opportunities for investors and new businesses and for the town centre and wider Kaiapoi area to
develop in a direction that sets the scene for the District’s economic growth.
This paper provides a brief overview of Kaiapoi’s and the wider Waimakariri District’s economic and
business environment based on available statistical and other survey information. This includes a
discussion of the role of Kaiapoi town centre, the town’s growing customer base, Kaiapoi’s and the
wider District’s economy and employment situation, spending patterns at Kaiapoi merchants,
perceptions of Kaiapoi as a place to do business and the District’s resident profile as customers of
Kaiapoi. Lastly, this paper touches on opportunities for Kaiapoi, particularly the town centre, as well
1
ECD-04 / 150116005778 HD
Kaiapoi and the wider Waimakariri District Economic and Business Overview 2015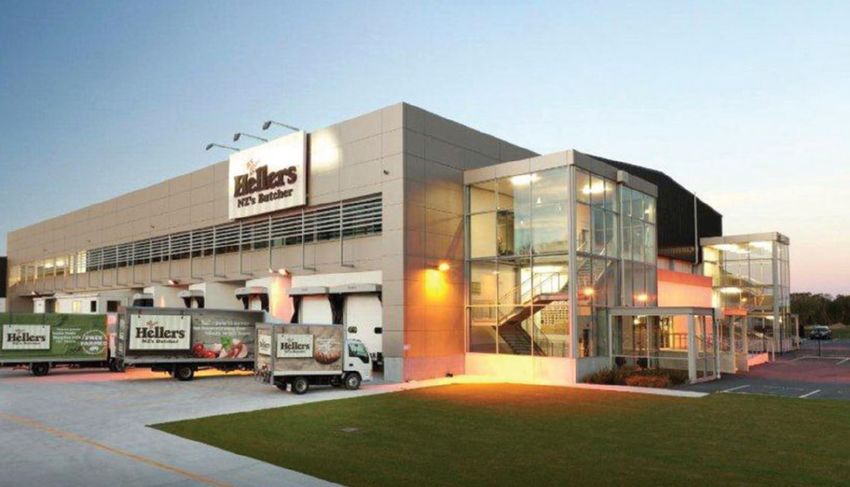
as provide a list of key contacts and resources available that informs business development and
investment.

                               Waimakariri District and Wards – Kaiapoi’s location

1. The Role of Kaiapoi Town Centre
Kaiapoi town centre is seen as a local service centre by the wider catchment of Kaiapoi including the
Pines and Kairaki Beach settlements (much of the latter two is now red-zoned) and other nearby
localities such as Clarkville.

A vehicle registration survey conducted in March 2010 (pre earthquake) provided information on the
extent of Kaiapoi’s retail trade catchment area, as illustrated in the following map.

                                                                                                   2
ECD-04 / 150116005778 HD
Kaiapoi and the wider Waimakariri District Economic and Business Overview 2015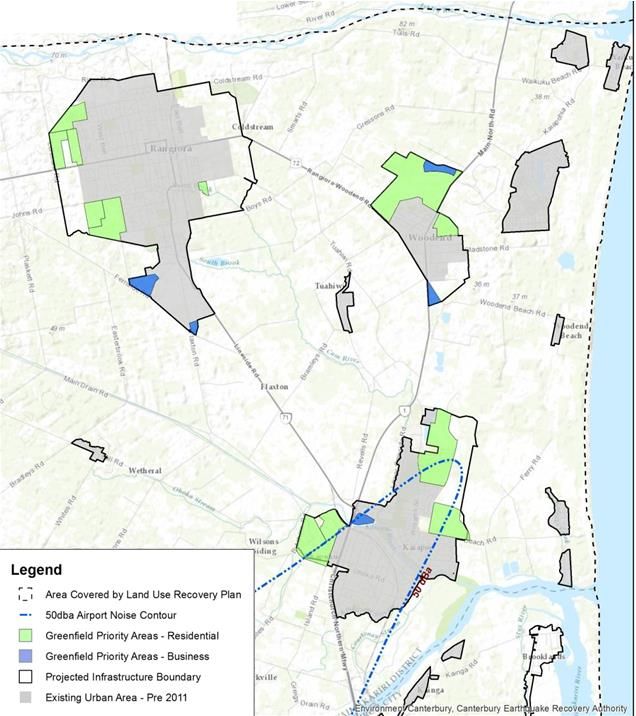
Indicative Kaiapoi Retail Trade Catchment

Kaiapoi is one of the two largest centres within the Waimakariri District and primarily provides for
‘day to day’ retail requirements and some office activities. The town centre features iconic
commercial activities such as Blakeley’s Fine Furniture and Blackwell’s Department Store, the latter
of which was rebuilt following the effects the September 2010 earthquake had on the original
building. These attract customers from outside Kaiapoi’s catchment area.

Kaiapoi as the second largest centre in the District is the nearest centre for 29% of Waimakariri
households and the second most frequented centre for a variety of goods purchased by residents, as
shown in the following table.

                                Shopping Centres Mainly Visited by Class of Goods
                                  Kaiapoi           Rangiora           Oxford    Woodend   Christchurch

Groceries (including fruit        29.5%             69.3%              6.7%      0%        13.9%
and vegetables)

Chemist supplies                  29.8%             57.1%              8.9%      0%        8.6%
(including cosmetics)

Books, Magazines and              21.4%             67.1%              2.5%      0%        18.7%
Stationery

Garden supplies                   9.2%              71.6%              1.1%      5.3%      18.1%

Fuel(s) for motor vehicles        27.9%             54.0%              10.3%     5.3%      14.8%

                                                                                                          3
ECD-04 / 150116005778 HD
Kaiapoi and the wider Waimakariri District Economic and Business Overview 2015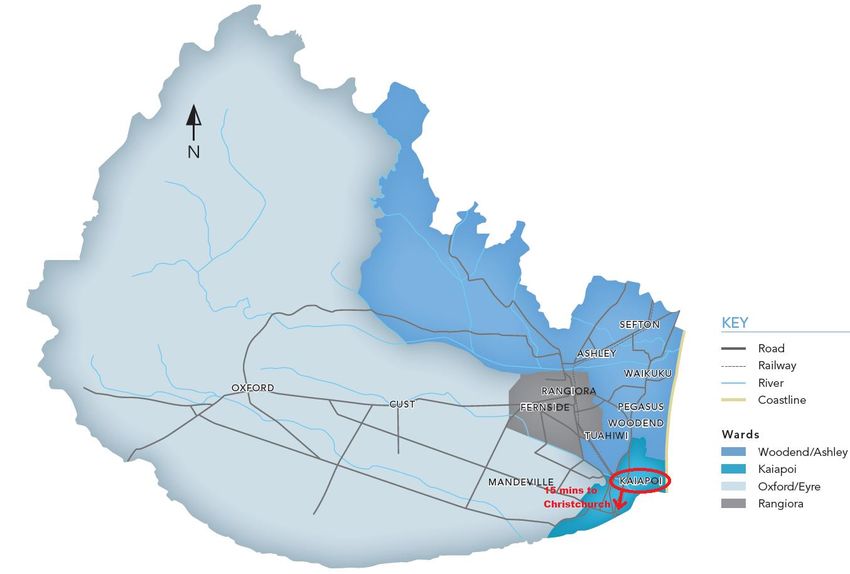
Clothing/Shoes                     6.4%               57.1%              0.3%               0.8%               51.3%

Appliances/Hardware                1.9%               49.9%              1.4%               0.6%               54.3%

Percentages total more than 100 as some respondents identified more than one centre typically visited for these purchases.
2011 District Community Survey of Households

Statistics New Zealand predicts Kaiapoi’s population will increase to 13,220 people by 2031 from the
9,200 count at the 2013 Census and 10,700 at the June 2014 population estimate. By 2038 it will be
the nearest centre for some 8,700 households. The historic and projected increase in Kaiapoi’s
population is illustrated in the graph below.

                     Kaiapoi Population 1986 - 2013 and projected population 2016
                                                 - 2031
         14,000

         12,000

         10,000

          8,000

          6,000

          4,000

          2,000

                0
                      1986       1991      1996       2001      2006       2013      2016       2021      2026       2031
        Census of Population and Dwellings to 2013 and Population Projections, Statistic New Zealand

While the 2013 Census saw a significant drop in population following the impact of red zoning
approximately 1,000 households in Kaiapoi, Council’s building consents data shows these have
largely been replaced by the end of 2014 and population figures are once again projected to climb as
the dwellings are completed and occupied. For infrastructure planning purposes, the Council has
estimated Kaiapoi’s population could reach 13,500 by 2025, well ahead of Statistics New Zealand’s
projections.

For some time, business activity within Kaiapoi has been at risk from ‘leakage’ – that is loss of
spending to other centres that could otherwise be spent in Kaiapoi. While the amount of retail and
hospitality floorspace in Kaiapoi centre in 2013 was 15,400m2, it could be significantly higher if the
effects of leakage were minimised. Projections show that the amount of sustainable retail and
hospitality floorspace demand could increase to 20,300m2 by 2036. Much of this can be
accommodated in the current Business Zone 1. The map below depicts the locations of land
currently zoned for business activity in and around Kaiapoi, as well as future business land.

                                                                                                                             4
ECD-04 / 150116005778 HD
Kaiapoi and the wider Waimakariri District Economic and Business Overview 2015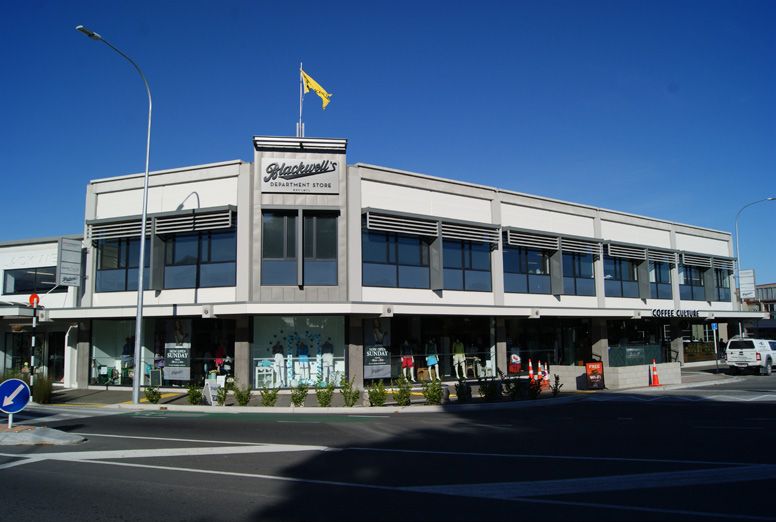
Map of Kaiapoi Business Zones
The Waimakariri District Plan zones the area occupied by the Kaiapoi town centre as Business Zone
1. The Plan explains that Business 1 Zones are intended to be the dominant location of, and to be
dominated by business, administrative, and cultural activities so as to:
help ensure an effective and efficient business sector by concentrating activity;
maintain and enhance the centres’ roles as the dominant community focal points;
retain nominated areas as more appropriate to pedestrian-related activity; and
retain business activity that can support public services, facilities and amenities that will
provide for the needs of workers, residents and visitors, in a quality, safe environment.
Business 2 zones on the other hand typically provide for commercial and industrial activity and low
density of development.
2. A Growing Kaiapoi Customer Base
Strong growth in households and population figures is predicted for Kaiapoi town and its wider
catchment area. There are several new subdivisions in development in and around Kaiapoi. These
are depicted in yellow in the following map. This map also shows residential areas that have been
zoned red and are considered unsuitable for residential use.
5
ECD-04 / 150116005778 HD
Kaiapoi and the wider Waimakariri District Economic and Business Overview 2015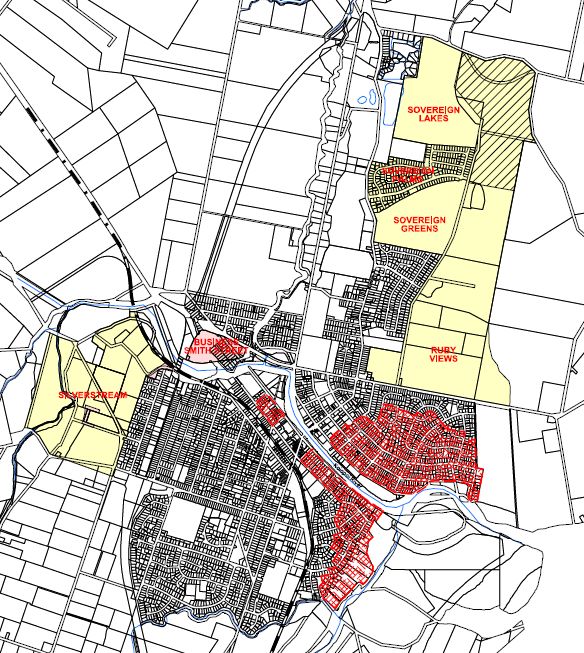
Residential Settlements at Kaiapoi

                                                                                 BEACH
                                                                                 GROVE

At this time, the Silverstream subdivision, just west of the State Highway 1, has capacity for up to
1115 households, as well as an area for local convenience business activity (0.8ha), which is under
development. BeachGrove, just north of Smith Street, has capacity for 531 households. Sovereign
Greens and Sovereign Lakes, north Kaiapoi, are envisaged to be home to approximately 240 and 400
households respectively, once completed, but these numbers could increase.

Kaiapoi’s fast recovery and growth in population is reflected in the number of residential building
consents processed and approved by Council within the last three years. The Council issued 1026
building consents for new dwellings in Kaiapoi between 2012 and 2014 – 400 of these in 2013 alone
which is more than six times the number of approved consents in 2011. Over the last two years,
more consents were granted for Kaiapoi than for any other town in the District.

                                                                                                  6
ECD-04 / 150116005778 HD
Kaiapoi and the wider Waimakariri District Economic and Business Overview 2015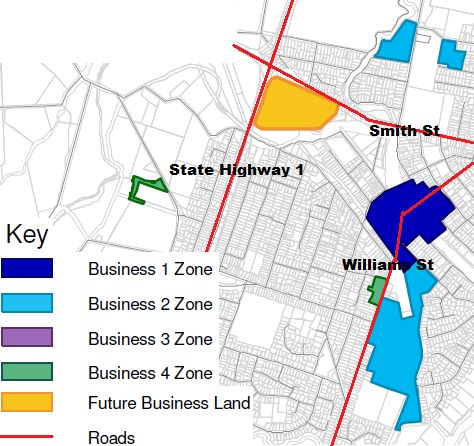
Waimakariri District: Consents for new dwellings and
                                                             location 2011 - 2014
                                       450
                 Dwellings consented   400
                                       350
                                       300
                                       250
                                       200
                                       150                                                          2012
                                       100
                                        50                                                          2013
                                         0
                                                                                                    2014

              Waimakariri District Council Building Consent data

Being the local service centre for a good proportion of the District’s residents, population growth in
the wider Waimakariri District will have a positive impact on Kaiapoi businesses. There are significant
numbers of potential lots within areas already zoned for residential development which could be
available for development during the next ten year period. The Land Use Recovery Plan, gazetted by
the Minister for Earthquake Recovery in December 2013 and developed in partnership between
strategic partners including local Councils, NZTA, CERA and others, identified priority areas for
growth over the next 10 to 15 years. The following map shows the District’s current and greenfield
priority residential and business development areas surrounding main towns. In addition of these
are rural residential areas.

                                                                                                           7
ECD-04 / 150116005778 HD
Kaiapoi and the wider Waimakariri District Economic and Business Overview 2015
Waimakariri District Greenfield Priority Areas under the LURP
Land Use Recovery Plan 2013
The estimated population of the District is projected to increase from 50,000 at the 2013
Census to up to 76,000 people by 2031, representing a rise in population of 52%.
Waimakariri usually resident population historic (1991-2013) &
projected (2016+)
80,000
70,000
60,000
50,000
40,000
30,000
20,000
10,000
0
1991 1996 2001 2006 2013 2016 2021 2026 2031
Census of Population and Dwellings and Population Projections, Statistics New Zealand
This solid growth is evident in the District’s building activity, particularly post the Canterbury
earthquakes of 2010 and 2011. The Waimakariri District Council has processed and approved a
8
ECD-04 / 150116005778 HD
Kaiapoi and the wider Waimakariri District Economic and Business Overview 2015significant number of residential building consents since 2011. Historically the Council has averaged
processing 400 to 500 building consents per annum.
Waimakariri District: Consents for New Dwellings 1986 -2014
1400
Number of Consents for Dwellings
1200
1000
800
600
400
200
0
1995
2006
1986
1987
1988
1989
1990
1991
1992
1993
1994
1996
1997
1998
1999
2000
2001
2002
2003
2004
2005
2007
2008
2009
2010
2011
2012
2013
2014
Waimakariri District Council Building Consent data
The Waimakariri District Council had approved higher numbers of residential building consents in
the 2011/12 and 2012/13 financial years than any other District Council in New Zealand. In the
2013/14 year, the Council slotted into second place after Selwyn District Council.
Waimakariri District Council Development Activity Scorecard for 2013/14
9
ECD-04 / 150116005778 HD
Kaiapoi and the wider Waimakariri District Economic and Business Overview 20153. Kaiapoi’s and Waimakariri District’s Economy
The number of businesses in Kaiapoi and its surrounds (including Ohoka and Clarkville) has grown by
12% to 1965 in 2014 over the last decade (these include many businesses with no employees). There
was a sharp decrease in business numbers in 2010 reflecting the impact the September 2010
earthquake had on the town and its businesses. However 2013 to 2014 saw some 74 new businesses
in the wider Kaiapoi area.
The number of businesses in Kaiapoi town (excluding Ohoka and Clarkville) have now almost
returned to pre-quake levels (1216 in 2014) following the September 2010 earthquake. However the
following graph shows a strong growth in the net employee count since 2011. This is due to a
number of new businesses moving into the town and providing local employment opportunities.
Kaiapoi Business Units & Employee Count since 2010
Number of business units / employees
4500
4000
3500
3000
2500
2000 Business Units
1500
Employee Count
1000
500
0
2010 2011 2012 2013 2014
Business Units 1229 1205 1174 1148 1216
Employee Count 3536 3240 3642 3866 4072
Business Frame, Statistics New Zealand
Note the number of employees derived from Business Frame is based on number of people registered for PAYE; it
does not include people who pay their taxation via the instalment method. It does not distinguish between people
who are employed full-time and part-time nor identify multiple part time jobs.
Construction was the largest industry in the Waimakariri District in 2014, measured as contribution
to the District’s GDP, followed by agriculture, forestry and fishing. About 2,500 people worked in the
construction sector in the District in 2014.
Commercial and public sectors investment in the District has been significant over recent years. The
annual total value for non-residential building consents in 2013 and 2014 rose dramatically
compared to previous years, reaching a ten year peak of $89 million in the year to June 2014. This
compares to a ten year average of $39 million per annum.
Retail trade in the Waimakariri District increased by 14% over 2013/14, compared to 3% nationally.
The BERL (Business and Economic Research Ltd) Regional Rankings 2013 identifies Waimakariri as
the second highest Local Authority in the country in terms of economic performance. BERL’s survey
ranks New Zealand’s 66 local authorities on economic activity, including population, employment,
GDP, business units, and the Relative Openness Index, which measures each region’s economy
toward export sectors.
10
ECD-04 / 150116005778 HD
Kaiapoi and the wider Waimakariri District Economic and Business Overview 2015Waimakariri’s GDP continues to grow at an accelerated rate (up 4.1% in the year to September 2014
compared to New Zealand as a whole, up 2.7%). Overall, GDP has grown strongly over the past
decade – annual growth peaking in the year to September 2012 at 12%. While Canterbury region
and New Zealand have at times seen reductions in GDP (negative percentage growth) since 2006,
Waimakariri District GDP has generally grown at rates above the region and country continuously. In
the year to September 2014, GDP in the District was $1,350 million (2010 dollars). The following
provides a picture of GDP growth in the District, Canterbury Region and New Zealand since 2006.
Infometrics Quarterly Economic Monitor for Waimakariri District, September 2014
Waimakariri’s property market growth has been significant in recent years, partly as a result of the
housing shortage in Christchurch. Immediately following the Canterbury earthquakes, house sales
lifted by 44% over 2011, compared to a 5% decrease across Canterbury and a 9% rise across New
Zealand as a whole, and by 52% in the year to June 2012. More recently, the year to September 2014
still showed growth (up 2.3%) in the District’s house sales while numbers for the region and country
as a whole decreased. The following depicts the trend in house sales in Waimakariri, noting in
particular the strong consistent growth since the Canterbury earthquakes.
Infometrics Quarterly Economic Monitor for Waimakariri District, September 2014
Growth in house prices in the District peaked in the year to September 2012. The median house
price in Waimakariri in the year to September 2014 was $404,750, compared to $399,332 in
Canterbury.
The Waimakariri District has seen solid growth in the number of businesses and employees over the
last decade. At 6,121 business units in 2014, Waimakariri’s businesses have climbed by 47% since
2000, compared to a 28% increase in business units at a national level. The number of employees in
the District has grown by 74% over the same period to 12,980 in 2014, while the employee count
nationwide has increased by 25%.
11
ECD-04 / 150116005778 HD
Kaiapoi and the wider Waimakariri District Economic and Business Overview 2015Waimakariri Business Units & Employee Count 2000-2014
6,500 14,000
13,000
6,000
Number of Business Units
Number of Employees
12,000
5,500
11,000
10,000
5,000
9,000
4,500
8,000
4,000 7,000
2000 2001 2002 2003 2004 2005 2006 2007 2008 2009 2010 2011 2012 2013 2014
Business Units Employee Count
Business Demography Statistics, Statistics New Zealand
4. Employment in Kaiapoi and the Waimakariri District
In Kaiapoi, most employees work in the manufacturing sector, followed by the wholesale/retail
sector and construction. Numbers for the latter have grown dramatically in the last few years,
reflecting the significant rebuild of the Christchurch and North Canterbury area. Since 2010, the
number of employees in the construction sector grew by 245%.
However, it is the finance and professional services sector that dominates Kaiapoi’s business scene
by number of business units, as depicted in the graph below. This is in part likely due to the rising
number of home-based professional consultancy and other service businesses being run by
individuals, which play an important part in creating the District’s wealth. The construction sector
represents the second largest sector by business units. This sector has seen solid growth to 2014,
given the demand on the construction sector post-earthquakes, to 171 businesses in 2014.
Business Frame, Statistics New Zealand
12
ECD-04 / 150116005778 HD
Kaiapoi and the wider Waimakariri District Economic and Business Overview 2015Waimakariri District suffers from ‘employment leakage’ with many leaving the District for work
every day. Close to 11,000 work in Christchurch and another 3,700 in ‘other’ locations (outside of
Waimakariri District). Council surveys reveal that around three quarters of those District residents
who work in Christchurch would prefer to work locally, if suitable work was available for them.
As at the 2013 Census, only 34% of all Kaiapoi residents currently in the labour force (full and part-
time) work in the Waimakariri District (25% within Kaiapoi). More than half (53%) travel to
Christchurch for work. Given the above survey results, this means Kaiapoi offers a substantial local
labour pool for businesses locating in Kaiapoi.
Place of work for Kaiapoi resident workforce 2013
3000
2500 2448
Number of residents
2000
1500
1140
1000
594
411
500
0
Kaiapoi Rest of District Christchurch Other
Place of work
Census of Population and Dwellings, Statistics New Zealand
It is important to acknowledge that given the Waimakariri District’s proximity to Christchurch,
especially Kaiapoi’s, many professionals choose to live in the District for lifestyle reasons, while
continuing to work in the city, particularly following the effects of the 2010/11 Canterbury
earthquakes and the population influx into the Waimakariri District. However, the increasing
population is also likely to generate increasing demand for goods and services that can be supplied
locally, thus providing increased opportunities for businesses to establish in the District and provide
local employment.
District-wide, the labour market has strengthened in response to the recovery in economic activity.
At 2.6% in the September 2014 quarter, the Waimakariri unemployment rate was significantly lower
than the national rate at 5.8% or the Canterbury region rate at 3.2%. Approximately 13,000 people
are employed in the Waimakariri District. Historically, the wholesale and retail sector was the largest
employer in the District. However in 2014, it was the construction sector employing the greatest
number of people at 2,490, accounting for 19% of total District employment.
Overall, employment projections for the Waimakariri District predict a significant increase in total
employment counts by 2031 – in the order of 53% to 78% depending on employment ‘retention’
scenarios between 2011 and 2031. All things being equal in current employment retention levels,
estimated population and household growth numbers are predicted to mean significant growth for
most sectors. Employment counts will grow even higher if an increased level of employment
retention in the District is achieved.
13
ECD-04 / 150116005778 HD
Kaiapoi and the wider Waimakariri District Economic and Business Overview 2015At the same time, the local labour force, that is people living in the Waimakariri District who work
(as opposed to the number of people working in the District) is predicted to increase to almost
34,000 by 2031, a 42% increase from the 2006 Census base.
5. Spending at Kaiapoi Merchants
In 2013 and 2014, the Waimakariri District Council commissioned analyses of the change in spending
behaviour at Kaiapoi merchants following the September 2010 Canterbury earthquake, the February
2011 Christchurch earthquake and the recovery period since.
There was a sudden decrease in spending following the September 2010 earthquake, reflecting the
impact of the closure and relocation of a number of businesses. There was a peak in spending from
Christchurch residents immediately following the February 2011 earthquake. Spending has generally
trended upward steadily since October 2010 with overall spend above pre-quake levels at later
dates, likely triggered by the rapid development of subdivisions in and around Kaiapoi.
The following graph shows the catchment of Kaiapoi merchants, as well as the overall increase in the
value of spending transactions since March 2010. This is depicted as the number of transactions by
BNZ cardholders as an indicator of overall consumer spending patterns.
Value of transactions in Kaiapoi by originating Territorial Local Authority
Kaiapoi Pre and Post-Quake Spending Analysis by Abley Transportation Consultants, 2014
6. Kaiapoi as a place to do business
In 2010, the Waimakariri District Council conducted a Business Survey, which saw questionnaires
directed to all businesses that have a physical address in the Waimakariri District. Questionnaires
were distributed to businesses located in Kaiapoi business zones 1 and 2. Questions focused on how
14
ECD-04 / 150116005778 HD
Kaiapoi and the wider Waimakariri District Economic and Business Overview 2015businesses perceive Kaiapoi as a place to do business, what the outlook for their business or
business branch is, what they thought of businesses in Kaiapoi and the District generally, and how
they perceive Enterprise North Canterbury as well as Council’s Kaiapoi town centre services.
The most common reason given by respondent businesses for why they located their business in
Kaiapoi is that there was a perceived gap in the market for the goods or services offered, followed by
the convenience for the owner to allow them a lifestyle of working where they live. Aspects
identified as particularly liked include Kaiapoi’s small town atmosphere, rural environment and
friendly locals, the convenience and accessibility of the town and a feeling that Kaiapoi is “just right
and not too large”, as well as the current and growing population.
There is immense support for more and a better range of businesses in Kaiapoi, particularly for more
retail shops, including clothing and shoe shops, department stores and other big box retail outlets,
as well as hardware stores. Eighty-one per cent of respondents think it is important that the range of
businesses based in Kaiapoi increases.
7. Waimakariri Resident Profile
Waimakariri District’s estimated resident population as at June 2014 is 54,400, an increase of 4,400
from the 2013 Census. This is among the highest ever annual proportional gain, reflecting the major
increase in house building in 2013. This now makes the District the third largest District in the South
Island (by population) Territorial Authority after Christchurch and Dunedin, and the second fastest
growing Territorial Authority in New Zealand after Selwyn District.
Like the rest of the country, Waimakariri District has an ageing population, however has an
overrepresentation of those aged over 40, compared to New Zealand as a whole, and an
underrepresentation of people in their 20s and 30s. Children aged 5 to 14 are slightly
overrepresented compared to New Zealand as a whole, reflected in growing local school rolls.
Waimakariri District and New Zealand 2013 age distribution
18
16
14
12
Percentage
10
8
6
4
2
0
0-4 years 5-9 years 10-14 15-19 20 - 29 30 - 39 40 - 49 50 - 59 60 - 69 70 years
years years and over
Waimakariri District New Zealand
2013 Census of Population and Dwellings, Statistics New Zealand
15
ECD-04 / 150116005778 HD
Kaiapoi and the wider Waimakariri District Economic and Business Overview 2015Most residents are married (54%) and are either living as a couple (46%) or in a two parents with
dependent children household (35%).
Half of all residents aged 15 and over are in full-time employment and another 16% are in part-time
employment (at 2013 Census). Seventy-six per cent work for wages / salaries, 13% are self-employed
and another 8% are employers themselves.
Home-ownership is high in Waimakariri. In 2013, 63% of homes were directly owned rather than
through a Family Trust (compared with 52% in Canterbury).
Waimakariri District households have relatively high disposable incomes, with those earning more
than $70,000 per annum overrepresented compared to Canterbury and New Zealand as a whole, as
shown in the graph below. The median income for Waimakariri District households in 2013 was
$68,800, compared to $65,000 in Canterbury and $63,800 in New Zealand as a whole. The median
household income increased substantially since 2006, when it was $50,900 as households with
incomes of over $70,000 and over $100,000 increased dramatically.
2013 Census of Population and Dwellings, Statistics New Zealand
8. Opportunities in Kaiapoi
Recognising Kaiapoi’s important role in the wider Waimakariri District, and in response to damage to
the town centre by the September 2010 earthquake, the Waimakariri District Council adopted the
Kaiapoi Town Centre Plan in June 2011. This document provides a framework to rebuild, redevelop
and revitalise the Kaiapoi town centre and respond to issues faced both prior to the September 2010
earthquake and especially as a response to it. The Plan identifies eight core projects and a number of
complementary projects. The eight core projects are highly visible and to an extent can be
influenced by the Council, either as a landowner, as the custodian of public space or through
development controls. Collectively, these projects indicate the future directions for managing the
restoration and redevelopment of the town centre. Implementation of several of the Kaiapoi Town
Centre Plan projects since its adoption has been completed. Major public space improvements have
been made to the Williams Street bridge, north of bridge streetscape, key intersections, recreational
spaces and public facilities.
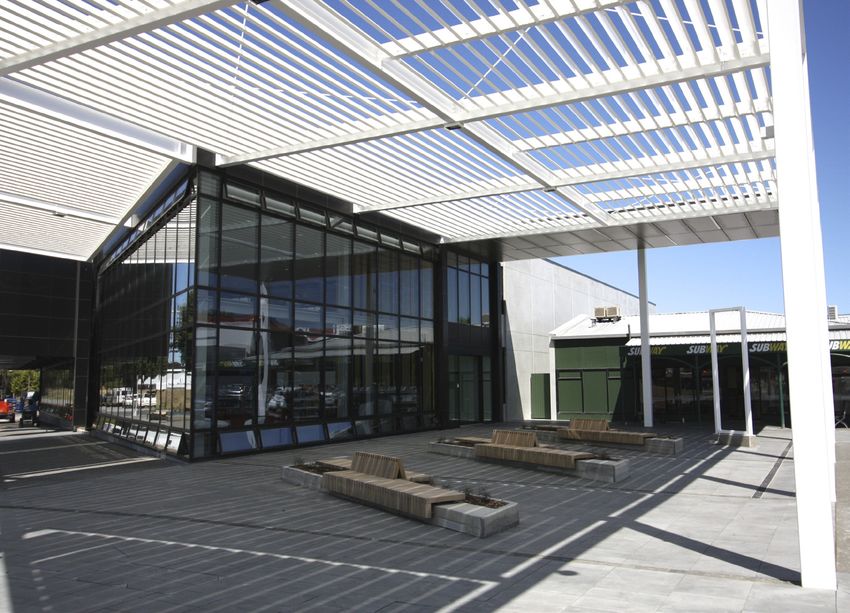
The Council has rebuilt the earthquake-damaged Kaiapoi Service Centre and Library at its
strategically located central site at corner Williams Street and Raven Quay, at a total cost of
16
ECD-04 / 150116005778 HD
Kaiapoi and the wider Waimakariri District Economic and Business Overview 2015approximately $13.5 million. This substantial centre and key anchor for pedestrian activity in the
town centre opened in January 2015 and houses the Service Centre, Library, Museum and Art
Gallery space. A marine precinct has been designed for central Kaiapoi at the Kaiapoi River – the
community’s focal point and the town’s point of difference. A riverside recreation precinct just west
of the central Williams Street bridge was completed in 2014. Public space improvements are also
planned for the main street and immediately adjacent streets and spaces south of the Williams
Street bridge.
Alongside public investment in the town centre, significant private development has taken place, or
is being planned, since the September 2010 earthquake, reflecting local businesses’ confidence in
the future success of Kaiapoi. Examples of these are the rebuilt New World Supermarket at Charles
Street, the new iconic Blackwell’s Department Store at the corner of Williams Street and Raven
Quay, now including Coffee Culture, the development of shops including a medical cluster at Charles
Street, the construction of a large office / retail building at the corner of Williams Street and Charles
Street, the rebuild of hospitality venues, and plans for other key central sites including at the
riverfront.
Further out, the new north facing off ramp from the motorway to Smith Street, completed in
February 2014, now better defines the ‘gateway’ to Kaiapoi and the town centre and assists with
attracting passing traffic and tourists to visit Kaiapoi. Plans for a 7.5 hectare business park
development at corner Smith Street and State Highway 1 will provide additional business space in
the Kaiapoi area while creating local employment opportunities. Nearby new residential areas such
as Silverstream and Sovereign Palms provide local convenience business activity.
There are significant opportunities for development in the Kaiapoi town centre. These include, but
are not limited to, development / intensification opportunities within the block of land south of the
Kaiapoi River bounded by Williams Street, Hilton Street, Black Street and Raven Quay (as signalled by
the Kaiapoi Town Centre Plan), as well as various other sites offering (re)development or
intensification opportunities. Around 4 hectares of business zoned land in and around Kaiapoi
(including at the Silverstream subdivision) are undeveloped and more present opportunities to
intensify land use, in addition to the 7.5 hectares of land proposed for business development at
corner Smith Street and State Highway 1. Current and future new developments provide
opportunities for new business tenants in this revitalising and progressing town.
The effects of the September 2010 earthquake on Kaiapoi were significant. Many commercial
buildings have had to be demolished. While this has meant some businesses were displaced and
property owners had to face difficult decisions, Kaiapoi’s recovery speaks for itself and the town now
and into the future presents unprecedented opportunities for investors, new businesses, and for the
business environment to develop in a direction that sets the scene for economic growth for the
wider area. With historic and projected growth, diverse existing businesses, significant investment at
the outskirts and a town centre that is undergoing intensive revitalisation both in the public realm
and commercial build, Kaiapoi is recovering and rebuilding at pace. The development activity
currently seen in Kaiapoi, and yet to be seen, sets the scene for Kaiapoi growth for the next fifty
years.
17
ECD-04 / 150116005778 HD
Kaiapoi and the wider Waimakariri District Economic and Business Overview 2015Key Waimakariri District Council / Enterprise North Canterbury Contacts:
For town centre / economic development enquiries:
Trevor Ellis, Senior Planner – Policy, trevor.ellis@wmk.govt.nz
Heike Downie, Senior Policy Analyst, heike.downie@wmk.govt.nz
For Business Development Advice and Support:
Enterprise North Canterbury, office@enterprisenc.co.nz
Tom McBrearty, Economic Development Manager, tom@enterprisenc.co.nz (for information
and advice about setting up a business)
For Council property enquiries:
Gary Saunders, Property Manager, gary.saunders@wmk.govt.nz
Useful Resources:
Council District Development Webpage: http://www.waimakariri.govt.nz/your_council/district-
development.aspx
Council Kaiapoi Town Centre Webpage:
http://www.waimakariri.govt.nz/your_council/district-development/kaiapoi-town-centre.aspx
Council Local Economic Development Webpage:
http://www.waimakariri.govt.nz/your_council/district-development/economic-
development.aspx
Enterprise North Canterbury Business Webpage: http://www.northcanterbury.co.nz/business/
References
Abley Transportation Consultants, Pre and Post-Quake Kaiapoi Town Centre Spending Analysis update, May
2014
BERL Economics, BERL Regional Rankings 2013, January 2014
Canterbury Earthquake Recovery Authority, Land Use Recovery Plan, December 2013
Infometrics, Quarterly Economic Monitor, June 2014, September 2014, January 2015
Market Economics, Assessment and Review of Key Activity Centres Waimakariri District, September 2014
Property Economics, Kaiapoi Town Centre Economic Assessment, May 2010
Statistics New Zealand, Longitudinal Business Frame, 2005-2014
Statistics New Zealand, Employment Projections, 2006-2031
Statistics New Zealand, New Zealand Census of Population and Dwellings, 2013 (and previous)
Statistics New Zealand, Subnational Projections for Population
Waimakariri District Council, Waimakariri District Plan, November 2005
Waimakariri District Council, 2010 Kaiapoi Business Survey, April 2010
Waimakariri District Council, Kaiapoi Town Centre Plan, June 2011
Waimakariri District Council, 2011 Community Survey, February 2012
Waimakariri District Council, Ten Year Plan 2012 – 2022, 2012
Waimakariri District Council, Customer Satisfaction Survey, August 2013
Waimakariri District Council, Development Activity Scorecard for 2013/14, October 2014
Waimakariri District Council, 2013 District Profile, June 2014
Waimakariri District Council, Population Projections for the 2015-25 Long Term Plan and 2015-45
Infrastructure Strategy, September 2014
Waimakariri District Council Building Consents Records
Waimakariri District Council’s responses to Land Use Recovery Plan Actions available at
www.waimakariri.govt.nz
18
ECD-04 / 150116005778 HD
Kaiapoi and the wider Waimakariri District Economic and Business Overview 2015You can also read