Rangiora - where business belongs
←
→
Page content transcription
If your browser does not render page correctly, please read the page content below
Rangiora
_________________________________________________________________________________________

AN ECONOMIC AND BUSINESS PROFILE FOR RANGIORA AND THE WIDER WAIMAKARIRI DISTRICT 2015

                                                                      where
                                                                      business
                                                                      belongs
Rangiora and the wider Waimakariri District
Economic and Business Overview 2015
Introduction
Quick Facts about Rangiora Growth & Economy:
The Waimakariri District extends from
Pegasus Bay in the east to the Puketeraki Town population growing from 10,000 in 2001 to
projected near 20,000 by 2026
Range in the west, and is bounded by the
Seen as local service centre by 60% of District
Waimakariri River in the south and the population; by 2031, could be providing goods and
Hurunui District in the north. The District services for about 50,000 people
has an area of 225,000 hectares and is 200 building consents for new dwellings in 2014
home to 54,400 residents in 2014. The Demand for additional 20,000m2 retail and
vast majority of the District’s population 20,000m2 office floorspace by 2031 to meet growth
and demand
live in the eastern part.
Business numbers increased by 27% in last 10 years
and number of employees by 35%
Rangiora forms the District’s largest urban
Dramatic increase in spending immediately
area, at a population of about 15,000 at following February 2011 earthquake (up 33%) – by
the 2013 Census, and has been identified 2014, spend was still above pre-quake levels
as one of Greater Christchurch’s Key including spend from Christchurch residents
Activity Centres, recognising its role in the Catchment stretches north to Kaikoura and Hurunui
wider area in clustering community, retail, District, south to Christchurch and Selwyn District
Most Rangiora employees work in retail/wholesale
residential and business activities, as well sector, though highest number of business units
as being a key node for transport and represent finance/professional services sector
other infrastructure. Key activity centres
are defined as existing and proposed commercial/business centres identified as focal points for
employment and the transport network and suitable for more intensive mixed‐use development.
With significant historic and projected growth, diverse existing businesses and a recognised role for
commercial, community and business activity in the wider District and beyond, Rangiora presents
unprecedented opportunities for investors and new businesses and for the town centre and
Southbrook business area to develop in a direction that sets the scene for economic growth for the
District.
This paper provides a brief overview of Rangiora’s and the wider Waimakariri District’s economic
and business environment based on available statistical and other survey information. This includes
a discussion of the role of Rangiora town centre, the town’s growing customer base, Rangiora’s and
the wider District’s economy and employment situation, spending at Rangiora merchants,
perceptions of Rangiora as a place to do business, pedestrian activity in the town centre and the
District’s resident profile as customers of Rangiora. Lastly, this paper touches on opportunities
available in the town, as well as provide a list of key contacts and resources available to assist in
informing business and investment.
1
DDS-02-01-02 / 141218140999 HD
Rangiora and the wider Waimakariri District Economic and Business Overview 2015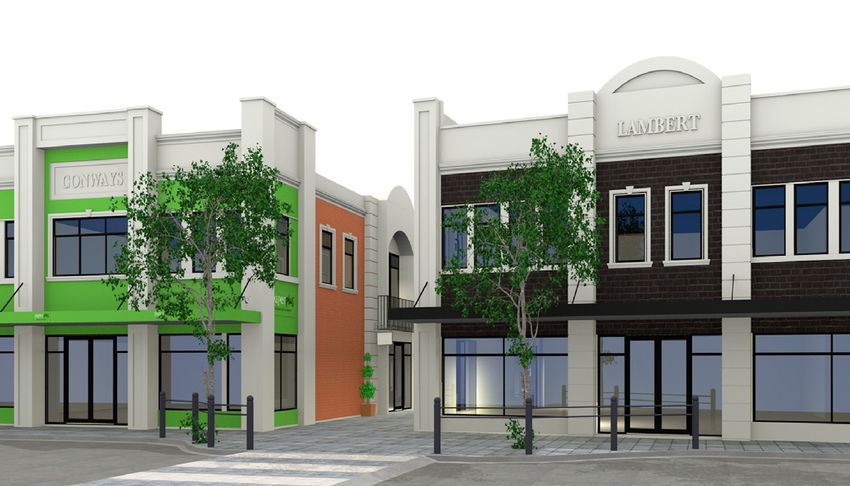
Waimakariri District and Wards – Rangiora’s location

1. The Role of Rangiora Town Centre
Rangiora town centre fulfils a range of roles. It is a service centre, a business centre and a centre for
the provision of health and social services as well as a community focal point. Retailing makes an
important contribution to the Rangiora town centre, and due to the dominant relationship between
retail and the public realm, it inspires a range of other activities and behaviours. This makes the
town centre more sustainable than its retail-only competition.

The Rangiora town centre is seen as their local service centre by more than 60% of the District’s
population – about 33,000 people who live either in Rangiora or the surrounding areas. Rangiora is
by far the most frequented centre for a variety of goods purchased by District residents, as can be
seen in the following table.

                                Shopping Centres Mainly Visited by Class of Goods
                                  Kaiapoi           Rangiora          Oxford      Woodend   Christchurch

Groceries (including fruit        29.5%             69.3%             6.7%        0%        13.9%
and vegetables)

Chemist supplies                  29.8%             57.1%             8.9%        0%        8.6%
(including cosmetics)

Books, Magazines and              21.4%             67.1%             2.5%        0%        18.7%
Stationery

                                                                                                           2
DDS-02-01-02 / 141218140999 HD
Rangiora and the wider Waimakariri District Economic and Business Overview 2015
Garden supplies                           9.2%         71.6%             1.1%               5.3%               18.1%

Fuel(s) for motor vehicles                27.9%        54.0%             10.3%              5.3%               14.8%

Clothing/Shoes                            6.4%         57.1%             0.3%               0.8%               51.3%

Appliances/Hardware                       1.9%         49.9%             1.4%               0.6%               54.3%

* Percentages total more than 100 as some respondents identified more than one centre typically visited for these purchases.
2011 District Community Survey of Households

Rangiora’s population is projected to grow rapidly over the next 15+ years as the number of
residents is expected to reach more than 21,000 by 2031.

                               Rangiora Population 1881 - 2011 and projected population 2016 - 2031
                       25000

                       20000
    Number of people

                       15000

                       10000

                        5000

                           0
                               1945

                               1956
                               1881
                               1886
                               1891
                               1896
                               1901
                               1906
                               1911
                               1916
                               1921
                               1926
                               1936

                               1951

                               1961
                               1966
                               1971
                               1976
                               1981
                               1986
                               1991
                               1996
                               2001
                               2006
                               2011
                               2016
                               2021
                               2026
                               2031
Statistic New Zealand Census of Population and Dwellings 1881-2013 and projected population to 2031

Based on projections for the Rangiora urban area, and taking into account anticipated growth
elsewhere in the District, it is estimated that by 2031 the Rangiora town centre could be providing
goods and services for close to 50,000 people.

It has been estimated that the amount of retail floor space in the Rangiora town centre will need to
increase by 12,000-20,000m2 by 2031 to meet this expected growth and demand for goods and
services. Estimates of the future need for office space in the Rangiora town centre suggest that there
is also a need for a similar growth of office space. These can be accommodated in the current
Business Zone 1 and immediately adjacent Business Zone 2 which is considered provides a similar
function as the existing Rangiora Key Activity Centre area.

                                                                                                                               3
DDS-02-01-02 / 141218140999 HD
Rangiora and the wider Waimakariri District Economic and Business Overview 2015
Map of Rangiora Business Zones
The Waimakariri District Plan zones the area occupied by the Rangiora town centre as Business Zone
1. The Plan explains that Business 1 Zones are intended to be the dominant location of, and to be
dominated by business, administrative, and cultural activities so as to:
help ensure an effective and efficient business sector by concentrating activity;
maintain and enhance the centres’ roles as the dominant community focal points;
retain nominated areas as more appropriate to pedestrian-related activity; and
retain business activity that can support public services, facilities and amenities that will
provide for the needs of workers, residents and visitors, in a quality, safe environment.
Business 2 zones on the other hand typically provide for commercial and industrial activity and low
density of development. More than 153 hectares of land is zoned for Business 2 activity in
Southbrook, the southern gateway to Rangiora and another 10 hectares at the Newham Street
business area just north of Southbrook. Southbrook has been the focus of most of the new
commercial building activity for industries including manufacturing, warehousing and engineering in
Rangiora in recent years. In recognition of floorspace demand at Southbrook and the loss of business
land in other parts of the District following the effects of the Canterbury earthquakes of 2010 and
4
DDS-02-01-02 / 141218140999 HD
Rangiora and the wider Waimakariri District Economic and Business Overview 2015
2011, the Minister for Earthquake Recovery in 2014 approved the zoning of an additional 17
hectares of land for business development.

2. A Growing Rangiora Customer Base
Rangiora’s notable growth in population is reflected in the number of residential building consents
processed and approved by Council within the last three years. One quarter of all building consents
issued for new dwellings in the Waimakariri District between 2012 and the end of 2014 have been
for Rangiora.

                                            Waimakariri District: Consents for new dwellings and
                                                            location 2011 - 2014
                                      450
                                      400
                Dwellings consented

                                      350
                                      300
                                      250
                                      200
                                      150                                                          2012
                                      100                                                          2013
                                       50
                                        0                                                          2014

              Waimakariri District Council Building Consents Records

There are significant numbers of potential lots within areas already zoned for residential
development which could be available for development during the next ten year period. The Land
Use Recovery Plan, gazetted by the Minister for Earthquake Recovery in December 2013 and
developed in partnership between strategic partners including local Councils, NZTA, CERA and
others, identified priority areas for growth over the next 10 to 15 years. The following map shows
the District’s current and greenfield priority residential and business development areas surrounding
main towns. In addition of these are rural residential areas.

                                                                                                          5
DDS-02-01-02 / 141218140999 HD
Rangiora and the wider Waimakariri District Economic and Business Overview 2015
Waimakariri District Greenfield Priority Areas under the LURP
Land Use Recovery Plan 2013
Given Rangiora’s pivotal role as key service centre and focal point for the wider District, population
growth in the Waimakariri District will have a positive impact on Rangiora businesses.
The estimated population of the District is expected to increase from 50,000 at the 2013 Census to
about 76,000 people by 2031, representing a rise in population of about 52% since the 2013 Census.
Waimakariri usually resident population historic (1991-2013) &
projected (2016+)
80,000
70,000
60,000
50,000
40,000
30,000
20,000
10,000
0
1991 1996 2001 2006 2013 2016 2021 2026 2031
Census of Population and Dwellings and Population Projections, Statistics New Zealand
6
DDS-02-01-02 / 141218140999 HD
Rangiora and the wider Waimakariri District Economic and Business Overview 2015This solid growth is evident in the District’s building activity, particularly post the Canterbury
earthquakes of 2010 and 2011. The Waimakariri District Council has processed and approved a
significant number of residential building consents since 2011, topping 1,000 per annum in 2012,
2013 and 2014. Historically the Council has averaged processing 400 to 500 building consents per
year.
Waimakariri District: Consents for New Dwellings 1986 -2014
1400
Number of Consents for Dwellings
1200
1000
800
600
400
200
0
1995
2006
1986
1987
1988
1989
1990
1991
1992
1993
1994
1996
1997
1998
1999
2000
2001
2002
2003
2004
2005
2007
2008
2009
2010
2011
2012
2013
2014
Waimakariri District Council Building Consent records
The Waimakariri District Council had approved higher numbers of residential building consents in
the 2011/12 and 2012/13 financial years than any other District Council in New Zealand. In the
2013/14 year, the Council slotted into second place after Selwyn District Council.
Waimakariri District Council Development Activity Scorecard for 2011-12
7
DDS-02-01-02 / 141218140999 HD
Rangiora and the wider Waimakariri District Economic and Business Overview 20153. Rangiora’s and Waimakariri District’s Economy
The number of businesses in Rangiora has grown strongly over the past decade – up 27% to more
than 1,400 in 2014 (these include many businesses with no employees). Similarly, the number of
employees grew by 35% to 6,000 over the last 10 years, as shown in the following graph.
Rangiora Business Units & Employee Count since 2005
Number of business units / employees
6000
5000
4000
3000
Business Units
2000
Employee Count
1000
0
2005 2008 2011 2014
Business Units 1107 1243 1276 1407
Employee Count 4440 4860 5060 6000
Business Demography Statistics, Statistics New Zealand –
Note the number of employees derived from Business Frame is based on number of people registered for PAYE;
it does not include people who pay their taxation via the instalment method. It does not distinguish between
people who are employed full-time and part-time nor identify multiple part time jobs.
Construction was the largest industry in the Waimakariri District in 2014, measured as contribution
to the District’s GDP, followed by agriculture, forestry and fishing. About 2,500 people worked in the
construction sector in the District in 2014.
Commercial and public sectors investment in the District has been significant over recent years. The
annual total value for non-residential building consents in 2013 and 2014 rose dramatically
compared to previous years, reaching a ten year peak of $89 million in the year to June 2014. This
compares to a ten year average of $39 million per annum.
Retail trade in the Waimakariri District increased by 14% over 2013/14, compared to 3% nationally.
The BERL (Business and Economic Research Ltd) Regional Rankings 2013 identifies Waimakariri as
the second Local Authority in the country in terms of economic performance. BERL’s survey ranks
New Zealand’s 66 local authorities on economic activity, including population, employment, GDP,
business units, and the Relative Openness Index, which measures each region’s economy toward
export sectors.
Waimakariri’s GDP continues to grow at an accelerated rate (up 4.1% in the year to September 2014
compared to New Zealand as a whole, up 2.7%). Overall, GDP has grown strongly over the past
decade – annual growth peaking in the year to September 2012 at 12%. While the Canterbury region
and New Zealand have at times seen reductions in GDP (negative percentage growth) since 2006,
Waimakariri District GDP has generally grown at rates above the region and country continuously. In
the year to September 2014, GDP in the District was $1,350 million (2010 dollars). The following
provides a picture of GDP growth in the District, Canterbury Region and New Zealand since 2006.
8
DDS-02-01-02 / 141218140999 HD
Rangiora and the wider Waimakariri District Economic and Business Overview 2015Infometrics Quarterly Economic Monitor for Waimakariri District, September 2014
Waimakariri’s property market growth has been significant in recent years, partly as a result of the
housing shortage in Christchurch. Immediately following the Canterbury earthquakes, house sales
lifted by 44% over 2011, compared to a 5% decrease across Canterbury and a 9% rise across New
Zealand as a whole, and by 52% in the year to June 2012. More recently, the year to September 2014
still showed growth (up 2.3%) in the District’s house sales while numbers for Canterbury and New
Zealand as a whole decreased. The following depicts the trend in house sales in Waimakariri, noting
in particular the strong consistent growth since the Canterbury earthquakes.
Infometrics Quarterly Economic Monitor for Waimakariri District, September 2014
Growth in house prices in the District peaked in the year to September 2012. The median house
price in Waimakariri in the year to September 2014 was $404,750, compared to $399,332 in
Canterbury.
The Waimakariri District has seen solid growth in the number of businesses and employees over the
last decade. At 6,121 business units in 2014, Waimakariri’s businesses have climbed by 47% since
2000, compared to a 28% increase in business units at a national level. The number of employees in
the District has grown by 74% over the same period to 12,980 in 2014, while the employee count
nationwide has increased by 25%.
9
DDS-02-01-02 / 141218140999 HD
Rangiora and the wider Waimakariri District Economic and Business Overview 2015Waimakariri Business Units & Employee Count 2000-2014
6,500 14,000
13,000
6,000
Number of Business Units
Number of Employees
12,000
5,500
11,000
10,000
5,000
9,000
4,500
8,000
4,000 7,000
2000 2001 2002 2003 2004 2005 2006 2007 2008 2009 2010 2011 2012 2013 2014
Business Units Employee Count
Business Demography Statistics, Statistics New Zealand
4. Employment in Rangiora and the Waimakariri District
In Rangiora, most employees work in the wholesale/retail sector, and numbers have been growing
steadily over the last decade. However, the finance/professional services sector dominates
Rangiora’s business scene by number of business units, which have grown substantially over the last
10 years. This is in part likely due to the rising number of home-based professional consultancy and
other service businesses being run by individuals, who play a significant part in creating the District’s
wealth.
Business Demography Statistics, Statistics New Zealand
Waimakariri District suffers from ‘employment leakage’ with many leaving the District for work
every day. Close to 11,000 work in Christchurch and another 3,700 in ‘other’ locations (outside of
Waimakariri District). Council surveys reveal that around three quarters of those District residents
who work in Christchurch would prefer to work locally, if suitable work was available for them.
10
DDS-02-01-02 / 141218140999 HD
Rangiora and the wider Waimakariri District Economic and Business Overview 2015As at the 2013 Census, less than half (49%) of all Rangiora residents currently in the labour force (full
and part-time) work in the Waimakariri District. Another 37% travel to Christchurch for work. Given
the above survey results, this means Rangiora offers a substantial local labour pool for businesses
locating in Rangiora.
Place of work for Rangiora resident workforce 2013
3000
2727
2547
2500
Number of residents
2000
1500
1026 1002
1000
500
0
Rangiora Rest of District Christchurch Other
Place of work
Census of Population and Dwellings, Statistics New Zealand
It is important to acknowledge that given the Waimakariri District’s proximity to Christchurch, many
professionals choose to live in the District for lifestyle reasons, while continuing to work in the city,
particularly following the effects of the 2010/11 Canterbury earthquakes and the population influx
into the Waimakariri District. However, the increasing population is also likely to generate increasing
demand for goods and services that can be supplied locally, thus providing opportunities for
businesses to establish in the District and provide local employment.
District-wide, the labour market has strengthened in response to the recovery in economic activity.
At 2.6% in the September 2014 quarter, the Waimakariri unemployment rate was significantly lower
than the national rate at 5.8% or the Canterbury region rate at 3.2%. Approximately 13,000 people
are employed in the Waimakariri District. Historically, the wholesale and retail sector was the largest
employer in the District. However in 2014, it was the construction sector employing the greatest
number of people at 2,490, accounting for 19% of total District employment.
Overall, employment projections for the Waimakariri District predict a significant increase in total
employment counts by 2031 – in the order of 53% to 78% depending on employment ‘retention’
scenarios between 2011 and 2031. All things being equal in current employment retention levels,
estimated population and household growth numbers are predicted to mean significant growth for
most sectors. Employment counts will grow even higher if an increased level of employment
retention in the District is achieved.
At the same time, the local labour force, that is people living in the Waimakariri District who work
(as opposed to the number of people working in the District) is predicted to increase to almost
34,000 by 2031, a 42% increase from the 2006 Census base.
11
DDS-02-01-02 / 141218140999 HD
Rangiora and the wider Waimakariri District Economic and Business Overview 20155. Spending at Rangiora Merchants
Over previous years, the Waimakariri District Council commissioned analyses of the change in
spending behaviour at Rangiora merchants following the September 2010 and February 2011
earthquakes and the recovery period since.
The analysis shows that there was a dramatic increase in spending in Rangiora immediately following
the February 2011 earthquake; spending was up 33% compared to March 2010; the largest
contributor was from Christchurch residents (up 208%) and was still up 80% more than one year on.
Today, overall spend including Christchurch spend in Rangiora is still higher than before the quakes.
The following graph shows the catchment of Rangiora merchants, as well as the overall increase in
the value of transactions since March 2010. This is depicted as the number of transactions by BNZ
cardholders as an indicator of overall consumer spending patterns.
Value of transactions in Rangiora by originating Territorial Local Authority
Rangiora Pre and Post-Quake Spending Analysis by Abley Transportation Consultants, 2014
Rangiora has a solid catchment that stretches from Kaikoura and Hurunui District to the north, and
into Christchurch and Selwyn District to the south.
6. Rangiora as a place to do business
In 2010, the Waimakariri District Council conducted a Business Survey, which saw questionnaires
directed to all businesses that have a physical address in the Waimakariri District. Questionnaires
were distributed to Rangiora town centre businesses Southbrook businesses. Questions focused on
how businesses perceive Rangiora town centre / Southbrook as a place to do business, what the
outlook for their business or business branch is, what they thought of businesses in the town centre
12
DDS-02-01-02 / 141218140999 HD
Rangiora and the wider Waimakariri District Economic and Business Overview 2015/ Southbrook and the District generally, and how they perceive Enterprise North Canterbury as well
as Council’s Rangiora town centre services.
The most common reason given by respondent businesses for why they located their business in the
Rangiora town centre is the busyness / buzz of the area, including good foot traffic and its high
profile location. Rangiora town centre’s compactness, accessibility and convenience (i.e. ‘everything
is within walking distance’ and ‘everything is easy to find’), is the most common aspect about
Rangiora town centre liked by respondents. Other aspects identified as particularly liked are the
town’s friendly locals and atmosphere, the town centre’s attractive character and recent
developments, and the variety and quality of other businesses and services available.
Businesses based in Southbrook appreciate in particular the area’s available, suitable, affordable and
high-quality business premises, as well as the high profile location and high traffic volumes through
Southbrook. Southbrook is considered easily accessible from other centres and the motorway, easily
found and close to all amenities.
There is immense support for more and a better range of businesses in the Rangiora town centre,
particularly for more retail shops (especially clothing and shoes), department stores and
supermarkets. Eighty-eight per cent of respondents think it is important that the number of
businesses based in the Rangiora town centre increases. More businesses are also sought for
Southbrook, particularly food and hospitality outlets, manufacturing businesses and other factories.
7. Pedestrian Activity in Rangiora Town Centre
Over 2010-2012, the Waimakariri District Council commissioned a pedestrian activity survey for
Rangiora town centre.
These surveys revealed that overall there has been a solid increase in pedestrian movements
between the original survey in March 2010 to after the February 2011 earthquake (May 2011). The
town centre has experienced a further increase in pedestrian movements during the year following
the earthquake. The peak level of activity is observed at High Street in the vicinity of Good Street
where over 2,300 pedestrian movements were recorded across the cordon during the 4 hour survey.
It is likely this survey will be repeated in 2015 following the completion of some major roading and
intersection improvements and private commercial developments.
8. Waimakariri Resident Profile
Waimakariri District’s estimated resident population as at June 2014 is 54,400, an increase of 4,400
from the 2013 Census. This is among the highest ever annual proportional gain, reflecting the major
increase in house building in 2013. This now makes the District the third largest District in the South
Island (by population) Territorial Authority after Christchurch and Dunedin, and the second fastest
growing Territorial Authority in New Zealand after Selwyn District.
Like the rest of the country, Waimakariri District has an ageing population, however has an
overrepresentation of those aged over 40, compared to New Zealand as a whole, and an
underrepresentation of people in their 20s and 30s. Children aged 5 to 14 are slightly
overrepresented compared to New Zealand as a whole, reflected in growing local school rolls.
13
DDS-02-01-02 / 141218140999 HD
Rangiora and the wider Waimakariri District Economic and Business Overview 2015Waimakariri District and New Zealand 2013 age distribution
18
16
14
12
Percentage
10
8
6
4
2
0
0-4 years 5-9 years 10-14 15-19 20 - 29 30 - 39 40 - 49 50 - 59 60 - 69 70 years
years years and over
Waimakariri District New Zealand
2013 Census of Population and Dwellings, Statistics New Zealand
Most residents are married (54%) and are either living as a couple (46%) or in a two parents with
dependent children household (35%).
Half of all residents aged 15 and over are in full-time employment and another 16% are in part-time
employment (at 2013 Census). Seventy-six per cent work for wages / salaries, 13% are self-employed
and another 8% are employers themselves.
Home-ownership is high in Waimakariri. In 2013, 63% of homes were directly owned rather than
through a Family Trust (compared with 52% in Canterbury).
Waimakariri District households have relatively high disposable incomes, with those earning more
than $70,000 per annum overrepresented compared to Canterbury and New Zealand as a whole, as
shown in the graph below. The median income for Waimakariri District households in 2013 was
$68,800, compared to $65,000 in Canterbury and $63,800 in New Zealand as a whole. The median
household income increased substantially since 2006, when it was $50,900 as households with
incomes of over $70,000 and over $100,000 increased dramatically.
14
DDS-02-01-02 / 141218140999 HD
Rangiora and the wider Waimakariri District Economic and Business Overview 20152013 Census of Population and Dwellings, Statistics New Zealand
9. Opportunities in Rangiora
Recognising Rangiora’s unique and pivotal role in the wider Waimakariri District, the Waimakariri
District Council adopted the Rangiora Town Centre Strategy – RTC2020, in September 2010. The
Strategy is based on three key themes: providing for growth, improving access, and enhancing
character and quality. Many of the implementation projects are meanwhile completed or have been
significantly advanced.
Rangiora town centre currently enjoys a mix of boutique high market retail shops, as well as some
national brand retailers / hospitality providers including (but not limited to) Farmers (rebuilt
premises opening in 2016), The Warehouse, Warehouse Stationery, Noel Leeming, Hannahs, Paper
Plus (rebuilt premises opening in 2015), Postie Plus, New Zealand Post Shop, Toyworld (rebuilt
premises opening in 2015), Classic Clothing, Coffee Culture, Monteith’s Brewery Bar, Health 2000,
Pizza Hut, Hell Pizza, Domino’s Pizza, Sushi Ya, Kosco, and supermarket chains Countdown and New
World (Pak’n Save to open in 2015). The Rangiora town centre enjoys great support from its
surrounding area of ‘mixed uses’, including light industry, offices and other services as well as larger
floor space stores.
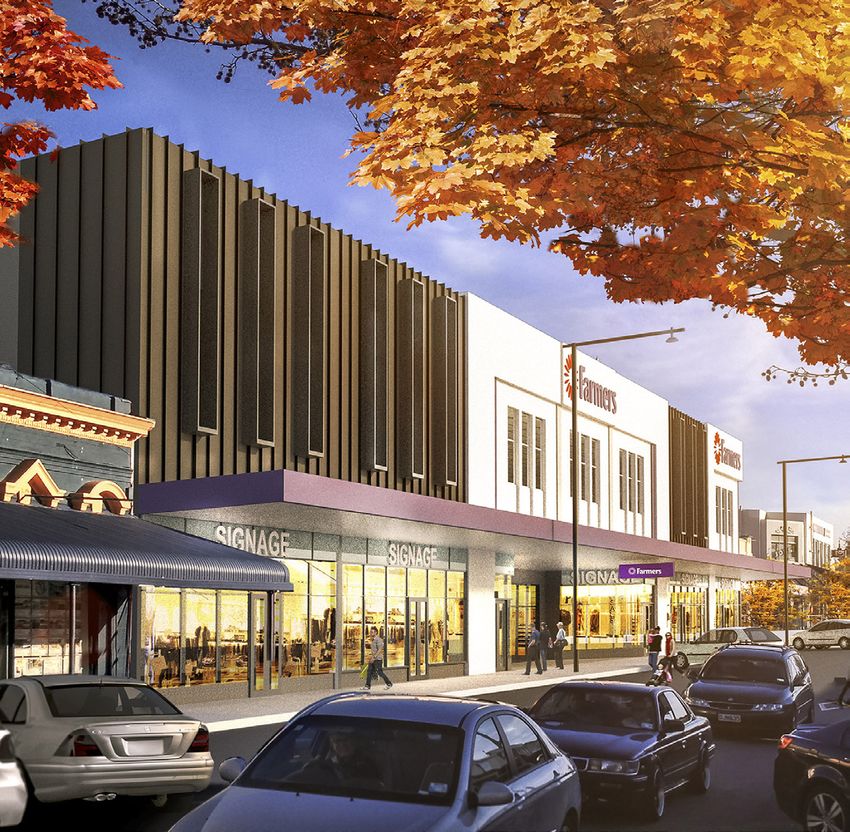
There are significant opportunities for development and business investment in the Rangiora town
centre. These include, but are not limited to, development opportunities within the block of land
north of High Street, bounded by High Street, Durham Street, Blake Street and Good Street. Under
the Land Use Recovery Plan, the Council prepared a precinct-based redevelopment plan for this
block. This envisages increased commercial floor space, enhanced pedestrian connectivity from High
Street to the off-street Council owned car park behind Blake Street, new public and green spaces
and a general expansion of the town centre core to the north. This was plan submitted to the
Minister for Earthquake Recovery in December 2014. Other town centre development and tenant
opportunities in Rangiora are abundant as rapid redevelopment takes shape.
The Council is investing significantly in the revitalisation of the Rangiora town centre, alongside the
private sector. Following the effects of the earthquakes, the Council has accelerated the projects to
realign and signalise the key town centre intersection of High Street, Ashley Street and Ivory Street
(often referred to as ‘Red Lion Corner’) and to reconfigure High Street to two-way traffic with a
range of landscaping and amenity improvements. The Council has been a proactive development
15
DDS-02-01-02 / 141218140999 HD
Rangiora and the wider Waimakariri District Economic and Business Overview 2015partner alongside the private sector in key development projects, notably within the North of High
precinct plan area, and invested heavily in strengthening and extending the Rangiora Town Hall and
Performing Arts Centre.
Southbrook provides substantial business, investment and development opportunities. With less
than a half hour drive to Christchurch International Airport, Southbrook – the southern gateway to
Rangiora – has been the focus of most of the new commercial building activity for industries
including manufacturing, warehousing and engineering in Rangiora in recent years. All commercial
sections at the Council developed Southbrook Business Park, comprising approximately 7 hectares of
land, have been sold. However, some 70 hectares of Southbrook business land is
under/undeveloped still. Underdeveloped Business 2 zoned land at Newham Street business area, at
the southern entrance to Rangiora beyond Southbrook, provide additional opportunities for
utilisation and intensification.
The effects of the 2010 and 2011 Canterbury earthquakes on the Rangiora town centre were
notable. Many commercial buildings along the High Street have required strengthening and some
demolition. While this has rendered some businesses displaced and property owners facing difficult
decisions, the effects have also resulted in unprecedented opportunities for investors and new
businesses – over and above significant development opportunities at Southbrook – and for the
town centre to develop in a direction that sets the scene for economic growth for the wider area.
The development activity currently seen in the Rangiora town centre and in other business land, and
yet to be seen, sets the scene for Rangiora growth for the next fifty years.
16
DDS-02-01-02 / 141218140999 HD
Rangiora and the wider Waimakariri District Economic and Business Overview 2015Key Waimakariri District Council / Enterprise North Canterbury Contacts:
For town centre / economic development enquiries:
Trevor Ellis, Senior Planner – Policy, trevor.ellis@wmk.govt.nz
Heike Downie, Senior Policy Analyst, heike.downie@wmk.govt.nz
For Business Development Advice and Support:
Enterprise North Canterbury, office@enterprisenc.co.nz
Tom McBrearty, Economic Development Manager, tom@enterprisenc.co.nz (for information
and advice about setting up a business)
For Council property enquiries:
Gary Saunders, Property Manager, gary.saunders@wmk.govt.nz
Useful Resources:
Council District Development Webpage: http://www.waimakariri.govt.nz/your_council/district-
development.aspx
Council Rangiora Town Centre Webpage:
http://waimakariri.govt.nz/your_council/district-development/rangiora-town-centre.aspx
Council Local Economic Development Webpage:
http://www.waimakariri.govt.nz/your_council/district-development/economic-development.aspx
Enterprise North Canterbury Business Webpage: http://www.northcanterbury.co.nz/business/
References
Abley Transportation Consultants, Pre and Post-Quake Rangiora Town Centre Spending Analysis, May 2014
Abley Transportation Consultants, Rangiora Town Centre Pedestrian Survey III: High Street, May 2012
BERL Economics, BERL Regional Rankings 2013, January 2014
Canterbury Earthquake Recovery Authority, Land Use Recovery Plan, December 2013
Infometrics, Quarterly Economic Monitor, June 2014, September 2014, January 2015
Market Economics, Assessment and Review of Key Activity Centres Waimakariri District, September 2014
Property Economics, Rangiora Town Centre Economic Assessment, May 2010
Statistics New Zealand, Longitudinal Business Frame, 2005-2014
Statistics New Zealand, Employment Projections, 2006-2031
Statistics New Zealand, New Zealand Census of Population and Dwellings, 2013 (and previous)
Statistics New Zealand, Subnational Projections for Population
Waimakariri District Council, Waimakariri District Plan, November 2005
Waimakariri District Council, 2010 Rangiora Town Centre Business Survey, April 2010
Waimakariri District Council, Rangiora Town Centre Strategy – RTC2020, September 2010
Waimakariri District Council, 2011 Community Survey, February 2012
Waimakariri District Council, Ten Year Plan 2012 – 2022, 2012
Waimakariri District Council, Customer Satisfaction Survey, August 2013
Waimakariri District Council, 2013 District Profile, June 2014
Waimakariri District Council, Development Activity Scorecard for 2013/14, October 2014
Waimakariri District Council, Building Consent Records
Waimakariri District Council’s responses to Land Use Recovery Plan Actions available at
www.waimakariri.govt.nz
Cover page artist impressions:
Farmers Department Store – Ignite Architects
North of High Street Conway Lane development – Trevor Dodd
Rangiora Town Hall - Fulton Ross Team Architect
17
DDS-02-01-02 / 141218140999 HD
Rangiora and the wider Waimakariri District Economic and Business Overview 2015You can also read