Greater Birmingham and Solihull LEP: Towns Ecosystem Report - gbslep
←
→
Page content transcription
If your browser does not render page correctly, please read the page content below
Greater Birmingham
and Solihull LEP:
Towns Ecosystem
Report

                     1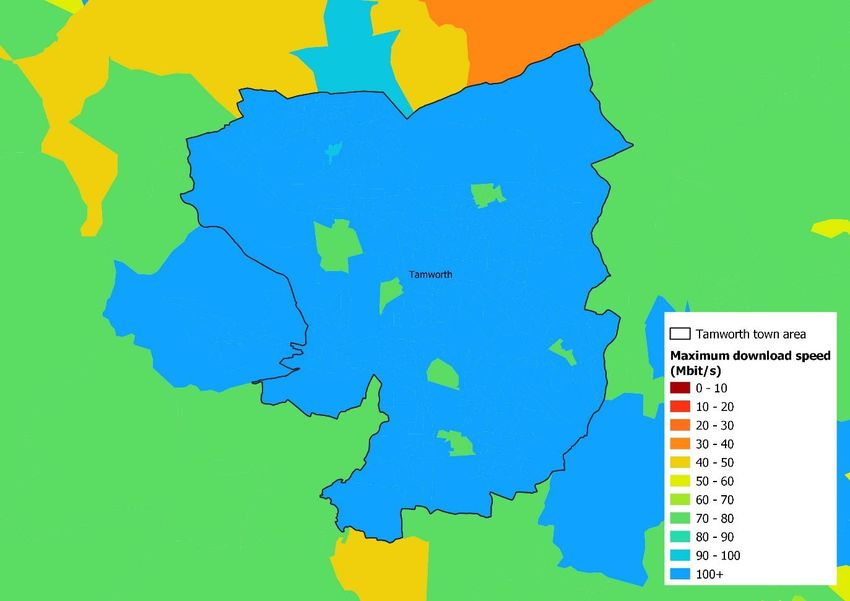
Our approach

               2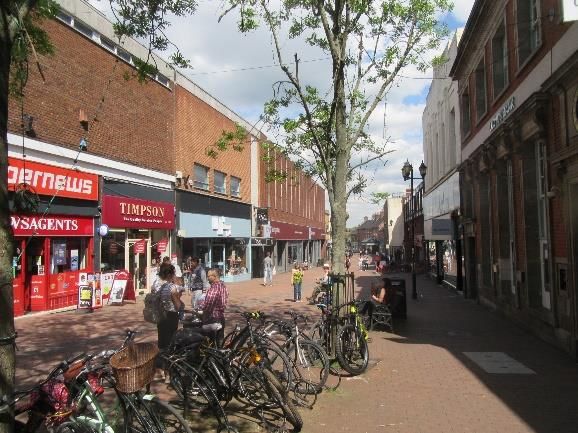
Introduction
In the GBSLEP Strategic Economic Plan (SEP), GBSLEP set            To further develop understanding of the challenges and
out the objective to ‘develop thriving towns and local centres’.   opportunities in each town GBSLEP commissioned the
This objective recognises that, whilst Birmingham as a             following work:
regional core city provides a natural focal point for increasing   •   A GBSLEP towns Ecosystem report
growth and investment, surrounding towns and local centres
                                                                   •   A framework of activity for each town
also form a crucial part of the economic fabric of the region
                                                                   This report is the Ecosystem report. It aims to set out the key
and contribute to local growth.
                                                                   economic, labour market, population, and property / high
To that end, GBSLEP published the Towns and Local Centres
                                                                   street metrics for ten towns in the GBSLEP area (see
Framework report last year, which acts as a guidance
                                                                   overleaf for list of towns).
document for partners and for the LEP itself, setting out good
practice in centres regeneration and setting some broad
criteria for funding applications.

                                                                                                                              3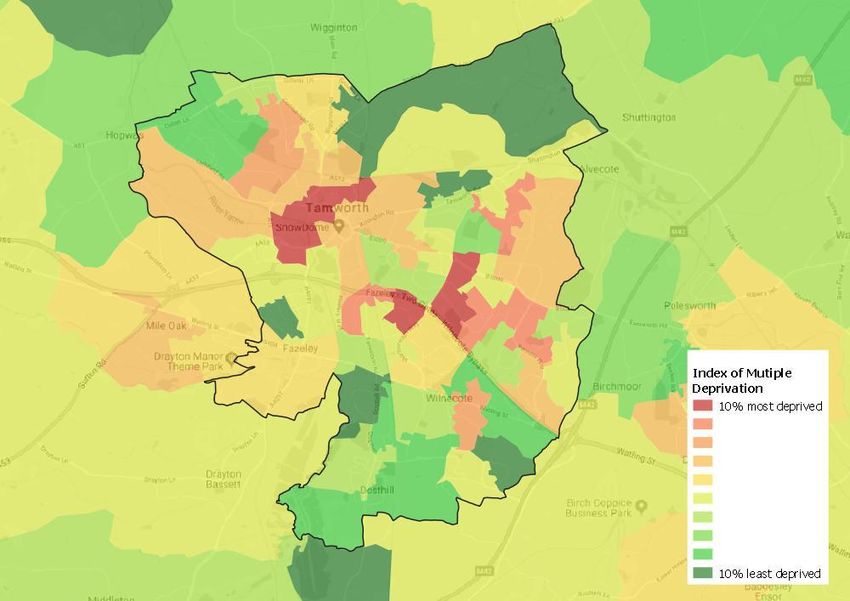
Towns in this study
This Ecosystem Report      •   Rugeley
focuses on ten of the      •   Solihull
GBSLEP area’s key towns:
                           •   Sutton Coldfield
•   Bromsgrove
                           •   Tamworth
•   Burton

•   Cannock

•   Kidderminster

•   Lichfield

•   Redditch

                                                  4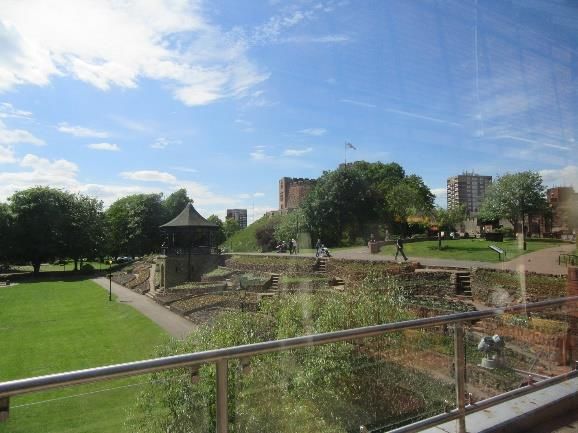
Methodology (1)
This report has aimed to build on the research and analysis      • Employment and employment growth
which already exists for the ten towns. Local authorities have   • Economic output (GVA) and employment by sector
provided extant studies and data for each of the towns in this   • Business counts and growth
report.                                                          • Population and age breakdown
                                                                 • Skills profile of the local authority area
To this existing body of work, we have undertaken further        • Inward and outward commuting patterns
data analysis of key socio-economic and property data.           • Index of multiple deprivation
We have also carried out a town centre healthcheck and a         • Property rents, yields and vacancies
business survey.                                                 • Other qualitative factors depending on available data.
                                                                 All data used is from the Office for National Statistics (ONS)
For each town centre, we have examined the following             or relevant commercial sources. Sources used are noted
factors:                                                         throughout.

                                                                                                                            5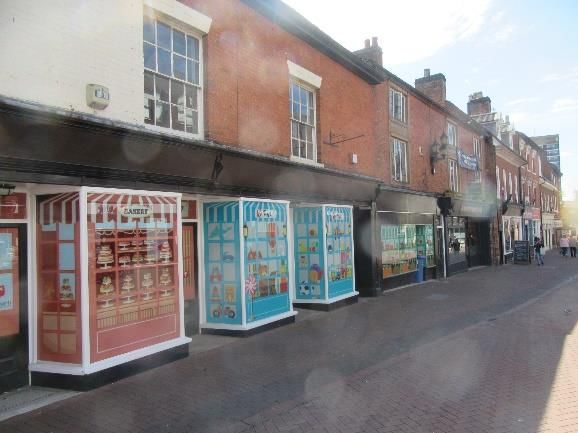
Methodology (2)
The Retail Group has undertaken two bespoke research                Typically these surveys will be the most in depth and
workstreams on each town.                                           comprehensive surveys of retail performance ever undertaken in
                                                                    the towns.
1. Operator Performance Survey
A survey of up to 80 operators trading in each town centre in the   2. Objective Retail Review
study has been undertaken. Surveys were handed directly to          A detailed assessment of the retail experience in each town from
managers of town centre businesses (retail, food & beverage,        the perspective of consumers has been undertaken. Aspects
service operators) and completed surveys picked up on the same      assessed include the retail mix, strength of anchor stores, target
day. All responses have been treated as confidential and            positioning, environment, ease of access, facilities, layout, car
analysed as a group dataset.                                        parking and signage. A proforma and scoring matrix has been
                                                                    used to ensure objectivity across all centres.
Overall the surveys generated on average a fabulous 86%
response in each town.

                                                                                                                                    6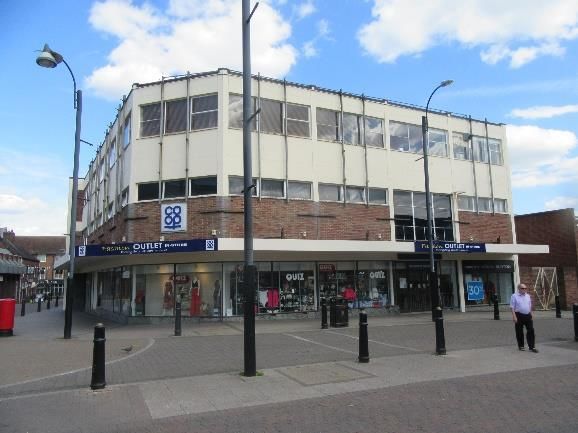
Retailer response rates
Town                Surveys distributed   Surveys completed   Completion rate
Bromsgrove          80                    71                  89%
Burton-upon-Trent   80                    75                  94%
Cannock             80                    69                  86%
Kidderminster       60                    55                  92%
Lichfield           73                    58                  79%
Redditch            72                    57                  79%
Rugeley             74                    51                  69%
Solihull            80                    69                  86%
Sutton Coldfield    75                    60                  80%
Tamworth            76                    64                  84%

                                                                                7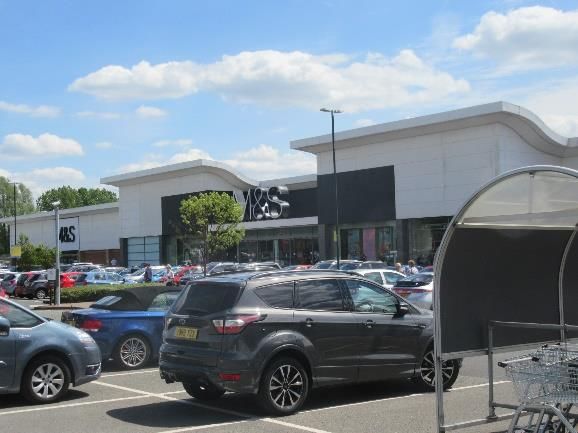
Methodology (3)
We organised a series of workshops with local authorities      representatives from the retail industry, such as the
and stakeholders with each of the towns to better              managers from retail parks in the town centres and, in those
understand the challenges facing each of the towns. We         towns with Business Improvement Districts (BIDs) the chairs.
asked each group what they believed the priorities for the
town were based on their understanding of the priorities for   From this, we have been able to understand in much closer
growth. We were also able to ask about the history of          detail the challenges facing the town, and what opportunities
development in the town, the successes and also the            the can build on over the next years. Combined with the
difficulties which have prevented further improvement.         economic analysis, the Town Centre Operator Survey and the
                                                               Retail Review, this provides a clear set of priorities for the
Attendees varied from place to place, but included local       town over the next few years, and a granular understanding
authority officers, elected members and private and third      of the challenges facing the place. These are summarised at
sector stakeholders from the towns. These included             the end of these packs.

                                                                                                                                8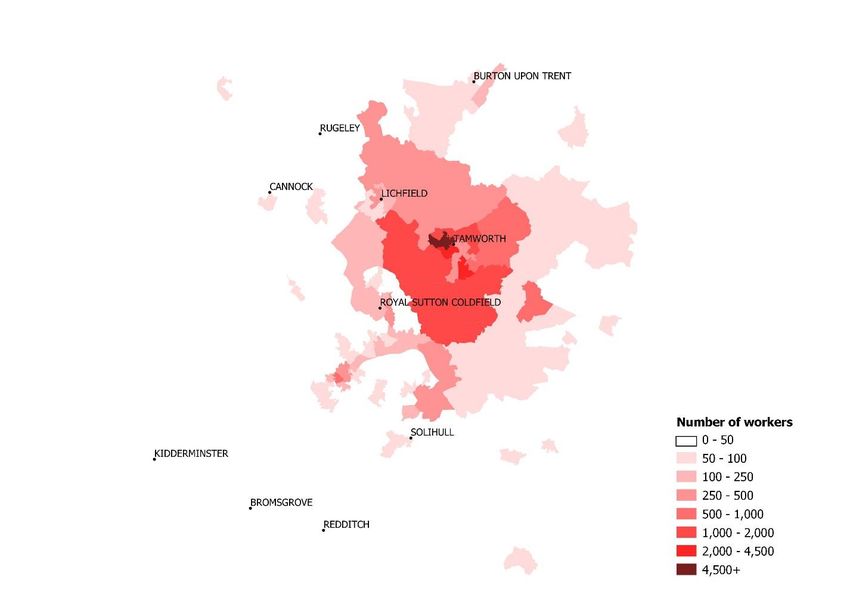
Methodology (4)
To provide a comparable basis for analysis, we have used a        appendix to this document. In some cases where it is helpful,
bespoke town centre definition. Different data sources are        (particularly the data on skills / qualifications), we have used
available at different geographies. Some are customisable to      district/borough-wide data as this is the smallest geography
the town centre geography, whilst other data, particularly that   at which data is available.
available at Lower Super Output Area (LSOA) level
represents the best approximation of the town centre area.        Throughout this report therefore, references to the towns
                                                                  by name refer to the town centre area as defined by the
These are approximations and do not match exactly, but            above methodology, rather than any wider definition. When
allow us to look at detailed economic data at a closer level of   we refer to a different definition of the town, for instance the
granularity than data at the local authority level allows. Full   local authority area, we make this explicit.
definitions of each town centre analysis are included in an

                                                                                                                                9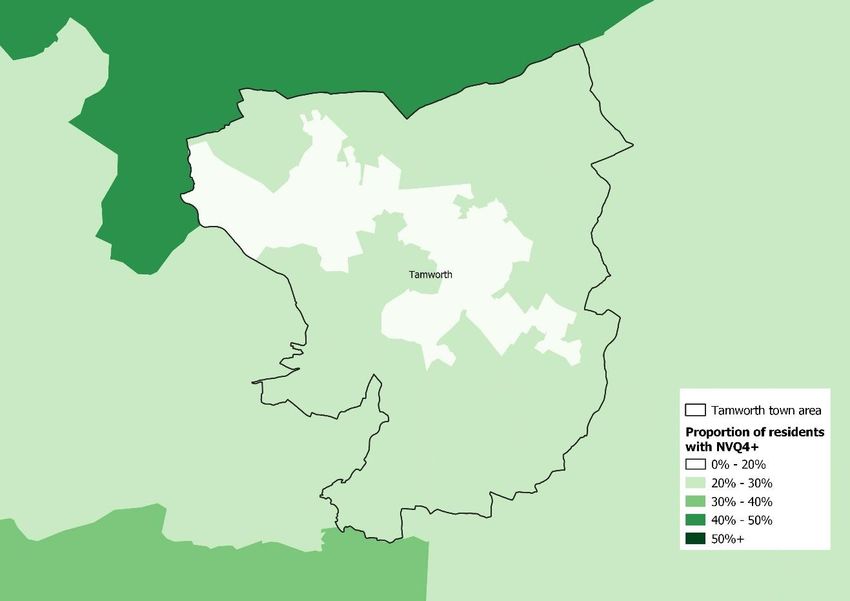
Key metrics

              10
Employment
Employment change Full time/Part time
Employment (2017)
(2010-2017) ratio
Bromsgrove 4,750 -5.0% 5:4
Burton-upon-Trent 16,500 -8.6% 23:9
Cannock 2,750 -8.3% 1:1
Kidderminster 6,000 0.0% 5:6
Lichfield 6,500 17.1% 13:12
Redditch 7,000 7.7% 16:11
Rugeley 3,000 20.0% 14:9
Solihull 12,500 -20.6% 3:2
Sutton Coldfield 6,000 60.0% 7:5
Tamworth 6,500 0.0% 1:1
GBSLEP 827,500 16.8% 1297:591
West Midlands 2,400,500 11.0% 3488:1669
Source: ONS Business Register and Employment Survey (2010-2017)
11Business base
Business count Growth Business Density
2018 (2013-2018) per 10,000 population
Bromsgrove 1,065 15.76% 357.2
Burton-upon-Trent 1,910 24.0% 296.5
Cannock 2,065 8.7% 377.4
Kidderminster 1,545 8.4% 276.9
Lichfield 1,780 50.8% 433.7
Redditch 2,460 18.0% 313.0
Rugeley 510 10.9% 300.4
Solihull 4,770 23.6% 423.6
Sutton Coldfield 2,040 15.6% 423.8
Tamworth 2,300 17.9% 305.1
GBSLEP 74,320 35.6% 364.3
West Midlands 212,505 23.7% 360.1
12Towns Ecosystem
Report
Tamworth
13Tamworth in context
Opportunities and challenges highlighted in Tamworth District Council Future High Streets Fund bid
Opportunities Challenges
Accessibility: Two bus terminals, a train station Poor perception from local residents with many feeling
connected to west coast and cross country routes with unsafe due to high levels of anti-social behaviour and
close proximity to major motorways. alcohol related crime.
High levels of footfall to shopping centres and retail Majority of retail lies on the town boundary, with a
parks. declining number of national retailers in the centre.
Tourism hotspot: Tamworth Castle (38,000 visitors Rising number of vacant properties and poorly
annually) & Firework Extravaganza event (40,000) maintained commercial buildings.
Extensive outdoor events and cultural activity Lack of evening leisure is limiting new or different
programme, drawing in multiple communities. investment.
Footfall has declined considerably in the town centre.
Source: Tamworth District Council Future High Streets Fund Bid, 2019
14Economy and business environment
15Economy and business environment summary
• In 2017, total GVA in Tamworth was £330.1 million.
• Tamworth’s largest sectors are the Retail & Motor Trade, accounting for £93.3m in GVA, £330.1m
GVA
Transport & Storage (£55.5m) and Property (£41.1m).
• Employment in Tamworth in 2017 stood at 6,500 throughout the period 2010-17,
employment has stagnated, neither increasing or decreasing.
2,300
• There are equal amounts of Full-time workers in Tamworth to part-time workers with a businesses
ratio of 1:1.
• Business growth in Tamworth is low. The rate of new business growth between 2013 and
2018 was 17.9% lower than the average growth rates for GBSLEP of 35.6% and 23.7% 305.1
business
for the West Midlands. density
• Tamworth’s business density of 305.1 per 10,000 population in 2017 was lower than both
the GBSLEP average and that of the wider West Midlands.Employment
Employment change Full time/Part time
Employment (2017)
(2010-2017) ratio
Bromsgrove 4,750 -5.0% 5:4
Burton-upon-Trent 16,500 -8.6% 23:9
Cannock 2,750 -8.3% 1:1
Kidderminster 6,000 0.0% 5:6
Lichfield 6,500 17.1% 13:12
Redditch 7,000 7.7% 16:11
Rugeley 3,000 20.0% 14:9
Solihull 12,500 -20.6% 3:2
Sutton Coldfield 6,000 60.0% 7:5
Tamworth 6,500 0.0% 1:1
GBSLEP 827,500 16.8% 1297:591
West Midlands 2,400,500 11.0% 3488:1669
Source: ONS Business Register and Employment Survey (2010-2017)
17GVA by sector group
GVA by broad sector group, Tamworth town centre, 2017
100
90
80
70
60
GVA (£m)
50
40
30
20
10
0
Primary services Manufacturing Construction Retail and Motor Transport & Accommodation Information & Financial & Property Professional, Business Public Education Health Arts,
trade storage & food services communication insurance scientific & administration & administration & entertainment,
technical support services defence recreation &
other services
Source: ONS Business Register and Employment Survey (2010-2017); ONS Regional gross value added (balanced) local authority by NUTS 1 region
18Employment by sector
Employment by broad sector group, Tamworth town centre, 2017
Total employment: 6,500
Arts, entertainment, recreation & other services
Health
Education
Public administration & defence
Business administration & support services
Professional, scientific & technical
Property
Financial & insurance
Information & communication
Accommodation & food services
Transport & storage
Retail and motor trade
Construction
Manufacturing
Primary industries
0 500 1,000 1,500 2,000 2,500
Source: ONS Business Register and Employment Survey (2010-2017); ONS Regional gross value added (balanced) local authority by NUTS 1 region
19GVA and employment growth
The bubble charts on the following pages illustrate GVA and employment growth in Tamworth, Business administration and support services and property have experiencing substantial growth in both
categorised by broad sector group, in the period 2010-17. metrics employment and GVA . Tamworth’s fourth and third largest industries (respectively),
employment has more-than doubled in both.
From this, we get a clearer idea of the size of different sectors within the local economy, which of them
are growing, which shrinking, and at what rate. With no primary industry and a declining construction industry, Tamworth has relatively small production
economy. Despite this, since 2010, manufacturing has grown considerably, albeit from a very low base..
On the y-axis is GVA growth in the period 2010-17. The sectors above the x axis are growing in GVA
terms and those beneath it shrinking. The x axis shows employment growth: bubbles to the left of the y Property, which refers to estate agent and commercial property activities, has a GVA of £41.4m in
axis have shrunk in employment terms between 2010 and 2017, while those to the right have Tamworth. It should be noted that the GVA calculation for property as a sector includes owner-occupier
experienced an increase in employment. The size of the bubbles indicates total GVA in the industrial imputed rental, an estimate of the housing services consumed by households who are not actually
group. The bubble chart on the page following shows a zoom in of the sectors in the boxed area on the renting their residence. It can be thought of as the amount that non-renters pay themselves for the
first chart. housing services that they produce.
Tamworth’s economy is dominated by service sectors and, since 2010, these have tended to grow. Only As such, imputed rental should represent the economic value per period to home owners of their
four of the twelve industrial groups experiencing GVA decline in the period. dwellings, equivalent to if they were to rent out their properties. This should be borne in mind when
considering the sector’s GVA impact – the size of the sector within the economy inflated.
The three poorly performing sectors located in the lower left of the graph are construction, education
and health. All are relatively small sectors with GVA of £2.13m, £0.50m and £2.3m in GVA, respectively.
While the health sector has experienced a contraction in employment and GVA in excess of 60%,
construction and education have experienced contractions greater than 80% in both employment and
GVA.
20GVA and employment growth
GVA and employment growth by broad sector group, Tamworth, 2010-17
1000%
Primary industries
800%
Manufacturing
Construction
600% Retail and motor trade
GVA change (2010-17)
Transport & storage
Accommodation & food services
400%
Information & communication
Financial & insurance
200% Property
Professional, scientific & technical
0% Business administration & support services
-150% -100% -50% 0% 50% 100% 150% 200% Public administration & defence
Education
-200%
Health
Arts, entertainment, recreation & other services
-400%
Employment change (2010-17)
Source: ONS Business Register and Employment Survey (2010-2017); ONS Regional gross value added (balanced) local authority by NUTS 1 region
21GVA and employment growth zoom
GVA and employment growth by broad sector group, Tamworth, 2010-17
200%
150%
Primary industries
GVA change (2010-17)
Manufacturing
100% Construction
Retail and motor trade
Accommodation & food services
50%
Information & communication
Financial & insurance
0% Property
-150% -100% -50% 0% 50% 100% 150% 200%
Professional, scientific & technical
-50% Business administration & support services
Public administration & defence
Education
-100%
Health
-150%
Employment change (2010-17)
Source: ONS Business Register and Employment Survey (2010-2017); ONS Regional gross value added (balanced) local authority by NUTS 1 region
22Business Base Profile
Growth in total number of businesses. Index 2010=100
140
Business
Business count Business growth Density per 130
Area
(2018) (2013-2018) 10,000
population
Business count index
120
110
Tamworth 2,300 17.9% 305.1
100
GBSLEP 74,320 35.62% 364.3 90
80
2010 2011 2012 2013 2014 2015 2016 2017 2018
West Midlands 212,505 23.73% 360.1
Tamworth GBSLEP West Midlands
Source: ONS Business Counts (2013-2018)
23Demographics and the labour market
24Demographics and labour market summary
• In 2017, Tamworth had a population of 78,290 borough residents. 78,290
residents
• The working age population as a proportion of the total population is 63.4% in Tamworth,
higher than the national and regional levels of 62.9% and 62.1% respectively.
• The share of the total population that is 65+ is 18.3% in Tamworth, on trend with UK 30,480
employed
average at 18.2% and the regional average of 18.4%.
• In 2018, 23% of people in the Tamworth district area are without any qualifications, while
19% have the highest levels of qualification, NVQ4+. Stagnation of
employment
• Tamworth has a net commuting outflow of 7,873. Zero Growth
• The largest numbers of inward commuters to Tamworth come from the town borough
itself, followed by North Warwickshire, Lichfield and Birmingham 7873 net
• The top commuting destinations are the same: North Warwickshire, Birmingham and commutin
g outflow
Lichfield (outside town area)
25Population profile
Population pyramid Tamworth 2017 The chart to the left shows proportions of the Tamworth population in five year age
Aged 85+ brackets for each sex. The black outlines represent the UK averages for each age
Aged 80-84
bracket.
Aged 75-79
Aged 70-74
Aged 65-69 The total population in Tamworth in 2017 was 78,290. The population is split
Aged 60-64
evenly across gender: the proportion of females is slightly higher at 50.8% than
Aged 55-59
Aged 50-54 the male proportion of 49.1%.
Aged 45-49
Aged 40-44
The working age population as a proportion of the total population is 63.4% in
Aged 35-39
Aged 30-34 Tamworth, higher than the national and regional levels of 62.9% and 62.1%
Aged 25-29 respectively.
Aged 20-24
Aged 15-19
Aged 10-14 The share of the total population that is 65+ is 18.3%, on trend with UK average at
Aged 5-9 18.2% and the regional average of 18.4%.
Age 0 - 4
8.0 6.0 4.0 2.0 0.0 2.0 4.0 6.0 8.0 10.0
Tamworth’s population is ageing, with the highest proportion within the 45-54 age
% of total population
bracket. However, the age range 25-34 indicates there is a basis of a younger
UK Female UK Male Female Male
population, but is not enough to balance the ageing.
Source: NOMIS population estimates- small area based by single year of age- England and Wales, 2017
26Employment / unemployment
N.B: This table refers to district level data
Economic inactivity
Economic activity Economic inactivity rate Employment rate (%)
rate change Unemployment rate (%) 2018
rate (%) 2018 (%) 2018 2018
(2013-2018)
Area
Tamworth district 85.9 14.1 -43.6% 81.0 5.7
Greater Birmingham and
75.5 24.5 -6.1% 71.0 6.0
Solihull
West Midlands 77.0 23.0 -5.3% 73.3 4.8
United Kingdom 78.3 21.7 -5.2% 75.0 4.3
Source: ONS Annual Population Survey, 2018. Note, the data refers to Tamworth district as a whole, not the town centre area alone.
27Skills profile
45% Taken as a whole, Tamworth district has low skills levels compared
40% with the GBSLEP and national averages. 19.6% of residents have a
35% further or higher education degree (NVQ4+), far below the UK
average of 39.2% and than the proportions in both the Greater
30%
Birmingham and Solihull LEP area and the West Midlands, which
25%
are 33.8% and 33.1% respectively.
20%
15%
Tamworth also has a higher proportion of residents with no or low
10%
qualifications. Just 23.5% of residents have no qualifications or a
5% NVQ1 qualification, compared to averages of 21.3% for GBSLEP
0% and 21.3% for the West Midlands. This level is also noticeably
No qual & NVQ1 NVQ 2 NVQ 3 NVQ4+ Other qual
higher than the UK average of 18.4%.
Tamworth Greater Birmingham and Solihull West Midlands United Kingdom
Source: ONS Annual Population Survey 2018
28Low / no qualifications Tamworth
No or NVQ1 qualifications profile in Tamworth town centre, 2018
The vast majority of Tamworth’s town area has 10%-20% of
residents with no qualifications or NVQ1 attainment. There
is a small part that has a lower share (in the town centre)
with 0%-10%.
In contrast, an area in the west just below the area found to
have 0%-10% with no qualifications, has a much higher
share of 30%-40% with no qualifications.
Source: ONS Annual Population Survey 2018
29High qualifications Tamworth
NVQ4+ qualifications profile in Tamworth town centre, 2018
Most of Tamworth town area has a relatively low proportion
of residents with NVQ4+ (20%-30%), with some areas
around the centre and towards the north with lower shares
of (0%-20%).
Source: ONS Annual Population Survey 2018
30Inward commuting
Tamworth has a total of 24,993 people commuting into the town to
work. It is primarily an area that experiences greater outward
commuting than inward, with an outflow of 7873.
The latest available data from 2011 shows that, of the inward
commuters who do come into Tamworth town centre for work, the
highest number, 13,681, come from the town area itself.
Considerably smaller numbers commute from North Warwickshire
(2,315), outside town area of Lichfield (1,595) and Birmingham
Local Authority (1,104).
Other areas include the Lichfield town area, Walsall and South
Derbyshire, however these still number in the hundreds.
The largest number of works are situated to the south of
Tamworth, specifically centring around the business parks.
Source: ONS Census (2011)
31Outward commuting
Large numbers of residents within the Tamworth area
commute out, with 32,866 travelling out for work.
Comparing the figure on the left to to where the inward
commuters come from, the outward commuters travel
further afield.
The key destination for commuters leaving Tamworth town
centre is North Warwickshire, where over 4,862
commuters work. Birmingham (3,905) and Lichfield (2,328)
receive considerable numbers of commuters also. Other
popular destinations include Solihull (804), Sutton (767)
and Lichfield (617).
Source: ONS Census (2011)
32Index of multiple deprivation
The Index of Multiple Deprivation (IMD) combines information from multiple domains of
deprivation such as income, health and crime, and is used to identify areas of relative high and
low deprivation in England.
The map shows IMD for Tamworth with areas of darker red indicating higher deprivation.
Generally, the further travelled from the town centre, the lower the deprivation. The north and
the south of the borough experienced lowest levels, with smaller pockets scattered throughout.
There are pockets of deprivation specifically in town centre and the surrounding areas. Further
to the south east deprivation is high, however it is in pockets rather than widespread.
According to research from Tamworth Borough Council, there are lower than national
averages rates of crime, although it does experience high levels of anti-social behaviour and
alcohol-related crime. Whilst there are high levels of adults with low qualifications,
unemployment is still relatively low and much better than the national average.
Source: Index of Multiple Deprivation (2015) – deciles.
33High street analysis
34High street analysis summary
• 11% of businesses in Tamworth believe their customers visit daily. 28% believe they 17% of
visit once a week. retailers
are
• 17% of retailers in Tamworth are optimistic for future trading prospects in the town. optimistic
49% are pessimistic.
• 50% of retailers in Tamworth are satisfied with the performance of their businesses. 49% of
retailers are
pessimistic
• 15% of retailers are satisfied with the performance of the town, while 67% are
dissatisfied.
• The retailers in Tamworth believe that Tamworth Castle and Grounds, its markets
67% of retailers
and its events programme are its strengths. dissatisfied with
the town
• Tamworth retailers cite empty shops, the lack of variety of shops and antisocial
behaviour as its weaknesses.
35Main reason for customers to visit
Main reason for customers to visit, Tamworth 2019
80% According to retailers, consumers are visiting Tamworth primarily to
70%
shop and visit the market.
60%
50%
40%
Secondary reasons to visit include using the services, eat / drink,
30%
20% leisure as well as other ‘local’ reasons such as live, work and study
10%
nearby.
0%
Tamworth is clearly attracting consumers for different reasons and
whilst is a recognised shopping destination, it is also a multi-
purpose destination.
Source: The Retail Group Business Survey, 2019
36Customer visit frequency
Customer visit frequency, Tamworth 2019
50%
Most retailers (80%+) report that customers visit at
45%
40% least once a week.
35%
30%
25% Just over 55% of retailers felt their customers visited
20%
15% twice a week or more frequent.
10%
5%
0% Tamworth benefits from high visit frequency.
daily twice per once a week once a once a less often
week fortnight month
Source: The Retail Group Business Survey, 2019
37Busiest time of day
Busiest time of day, Tamworth 2019
100%
80%
Findings reflect traditional retail trading times, with lunchtimes
60% reported as busiest.
40%
20%
0% Mornings are busier than weekdays.
Before 9.00 9.00 to 11.00 11.00 to 3.00 3.00 to 6.00 After 6.00 No answer
Weekday Saturday
Opening times, Tamworth 2019
Saturdays follow a later pattern.
80%
70%
60% The majority of retailers report they open on Sundays.
50%
40%
30%
20%
10% Lunchtimes are the busiest.
0%
Before 11.00 11.00 - 2.00 pm 2.00 pm to 5.00 After 5.00 Do not open No answer
pm Sundays
Source: The Retail Group Business Survey, 2019
38Retailer satisfaction levels
Retailer satisfaction levels, Tamworth 2019
60% Circa 50% of retailers are satisfied with the
50% performance of their business. 30% are dissatisfied.
40%
30% Tamworth satisfaction levels are very poor, with 67%
20% dissatisfied and only 15% satisfied, a 5:1
10% dissatisfaction ratio.
0%
Very satisfied Satisfied Neither / nor Dissatisfied Very No answer
dissatisfied
Your Business Tamworth
Source: The Retail Group Business Survey, 2019
39Town centre priority improvement areas
Town centre priority improvement areas, Tamworth 2019
80%
70%
Retailers are clearly looking for a bigger and better
60%
50%
offer, a better retail experience and more activity that
40%
generates footfall.
30%
20%
10%
0%
Source: The Retail Group Business Survey, 2019
40Improvements wanted to public realm
Improvements wanted to public realm, Tamworth 2019
60%
Specifically in regards the public realm in Tamworth,
50%
40%
respondents want better facilities (toilets, seating
30% and signage), better environment (pavements, trees
20%
/ greening and cleaner / tidier) and better experience
10%
0% (safety, focus on heritage and more public art).
There are lots of opportunities to improve the public
realm in Tamworth.
Source: The Retail Group business survey, 2019
41Strengths and weaknesses of Tamworth Town Centre
Strengths of Tamworth Town Centre Weaknesses of Tamworth Town Centre
Comment Number of Comment Number of Comment Number of Comment Number of
respondents respondents respondents respondents
Friendly staff and
Castle & Grounds 29 security 2
Markets 14 Good heritage 2
Empty shops 20 Parking 4
Events 7 Great for a haircut 2 Lack of variety of
shops 10 Market shrinking 3
History & Heritage 5 Heritage 2 Competition from
Good public ASB / Homeless 9 Ventura 2
transport 4 Local community 2
Cost of parking 9 Dirty streets 2
Ankerside Centre 2 Clean & Tidy 2
Beautiful town / Lack of shops 9 Lack of independents 2
scenery 2 F&B offer 2 No police / lack of
Lack of free parking 4 security 3
Footfall 2 Variety of stores 2 More variety of F&B
needed 4
Source: The Retail Group Business Survey, 2019
42Year-on-year performance
Year on year performance of Tamworth Town Centre
30% The majority of respondents (52%) down and only
20%
34% are level or up on last year.
10%
0%
Up Level Down No answer Tamworth businesses are clearly struggling.
-10%
-20%
-30%
-40%
-50%
-60%
Source: The Retail Group business survey, 2019
43Future Optimism
Future optimism, Tamworth 2019
Of concern is that circa half of retailers are
5%0%
11%
17% pessimistic about the future trading prospects in
Very optimistic
Tamworth.
Quite optimistic
Neither / nor
Quite
Only 17% of retailers are optimistic about the
pessimistic
Very future, and circa 30% undecided.
30%
pessimistic
38%
No answer
Source: The Retail Group Business Survey, 2019
44Retail review Tamworth overview
Positives and Strengths Weaknesses and Potential Issues
- Fabulous castle and grounds in heart of town centre - High numbers of vacancies spread throughout town centre
- Markets are popular - Night time economy appears to be struggling
- Some beautiful historic buildings in the northern sector of - Many historic buildings are in poor condition
the town centre - Main shopping centre seems to be visibly struggling
- Good levels of footfall on Market St - Main shopper car park is very dated
- The town centre has huge amount of very good quality out of
town competition
- Defined town centre boundary seems too large
Source: The Retail Group Business Survey, 2019
45Current Tamworth retail offer and experience
Reasonably healthy ‘high street’ Historic castle and grounds Exceptionally strong out of town offer
Struggling ex anchor store Long term vacant large pub Vacant units in heart of town centre
Source: The Retail Group Business Survey, 2019
46Infrastructure and property
47Infrastructure and property summary
• There are 180 existing buildings in Tamworth. In Q2 2019, 78% of total floorspace was taken
£16.26
up by retail, and 20% by office space. per sq.ft
• Market rents for all types of property in Tamworth were £16.26 per square foot in Q2 2019. in market
rent
There has been a notable decrease from £16.70 since 2016.
• The level of asking rent per square foot in Tamworth, measured in Q2 2019 was £17.66
0.1% YOY
• Market rents in Tamworth grew slightly 0.1% in Q2 2019 on the same quarter in the previous growth in
year. This has been growing since 2017 where it was declining at a rate of -2%. market
rent
• Market yield on property in Tamworth was 7.5% in Q2 2019. Yields have steadily declined
since 2013.
3.9%
• In Q2 2019, properties had been on the market for a median period of 8.7 months. This has vacancy
been volatile since a high of 14 months in 2016 and a low of 8.2 months in 2017. rate
• The vacancy rate in Tamworth was 3.9% in Q2 2019. The rate has been declining since a
record high of over 7% in 2018, although is showing signs of increasing.
48Property Analysis
With a market rent of £16.26 per square foot, Tamworth has one of
the lowest market rents in the GBSLEP towns in this analysis.
Tamworth 2019 Q2 However, it has been in an overall increase since quarter 2 in
2018.
Market Rent Per square foot £16.26
14.2% of the primary shopping area of Tamworth is vacant and has
Asking rent per square foot £17.66 been rising over recent years. The decline of the retail sector is
contributing to this, with a greater number of restaurants and
businesses moving to the more popular retail parks like the out of
Market Rent Growth (YoY) 0.1% town Ventura Park. In 2000 there were 53 major national outlets
however there are now only 39. These are being replaced by
professional services and takeaways.
Market Yield 7.5%
Large units in Ankerside shopping centre have been vacant as far
back as 2014. 19% of the available retail units are vacant with
Vacancy Rate 3.9% companies like Argos, Superdrug, McDonald’s, WH Smith, Clarks
have all left, with the primary retail being budget retailers.
Median months on market 8.7
The town centre, once classed a major town centre, is has slipped
down the retail hierarchy to a local centre. It has dropped from
Source: Costar; Tamworth District Council, Future High Streets Fund Bid.; (Source: Worcestershire having 25,752 regular shoppers in 2008 to 9,296 currently.
Strategic Housing Market Assessment (SHMA).
49Market rent
Market rent per square foot Tamworth, 2011-19
Source: Costar. In order to aid the legibility of this graph, the axis has been truncated.
50Market rent growth
Market rent growth (YOY) Tamworth, 2012-19
Source: Costar. In order to aid the legibility of this graph, the axis has been truncated.
51Months on market
Median Months on Market for properties, Tamworth
Source: Costar. In order to aid the legibility of this graph, the axis has been truncated.
52Market yield
Market yield Tamworth, 2011-19
Source: Costar. In order to aid the legibility of this graph, the axis has been truncated.
53Market rent vs asking rent
Market rent vs asking rent per square foot Tamworth, 2011-19
Source: Costar. In order to aid the legibility of this graph, the axis has been truncated.
54Vacancy rate
Vacancy rate Tamworth, 2011-19
Source: Costar. In order to aid the legibility of this graph, the axis has been truncated.
55Property
Key metrics Tamworth, Q2 2019
180 78% 20% 1
of floor of floor
existing 4 / 5 star
space in space in
buildings property
retail office
Source: Costar.
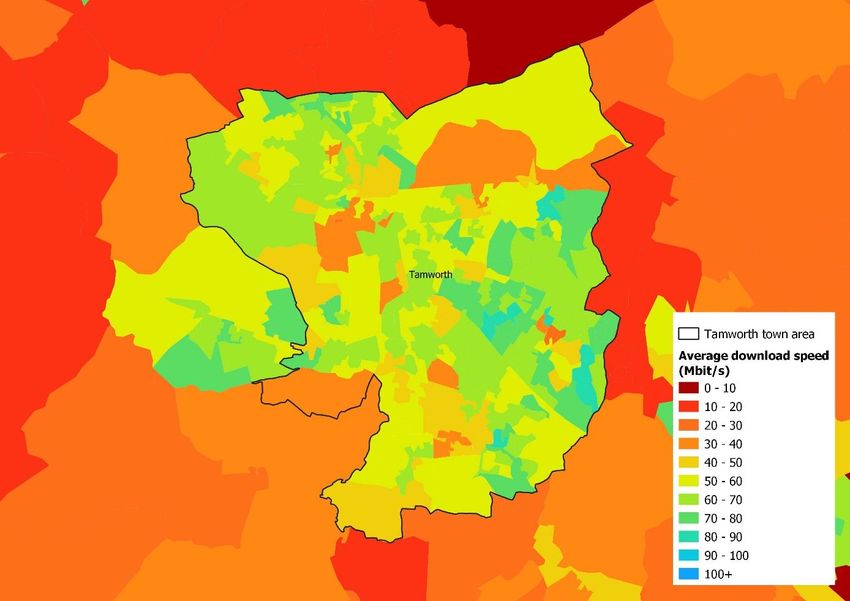
56Average download speeds
Average download speeds, Tamworth, 2018
Tamworth town areas has some variation in average
download speeds. There are several parts of the town with
average download speeds of 50-60 Mbit/s, particularly in the
North East. Additionally, there are areas of higher connectivity
(60-70 Mbit/s) in the North West.
There are pockets of land that experience high download
speeds between (80-90) Mbit/s.
In contrast, there are places that have lower connectivity of
30-40 Mbit/s, (towards the north east of the town).
Maps created using Ofcom Connected Nations Data for May 2018. This data is produced for Census Geography Output Areas (2011).
57Maximum download speeds
Maximum download speeds, Tamworth, 2018
Most of Tamworth’s town area falls in the
maximum download speeds bracket of
(100mbit/s+), with a few pockets of land with
lower connectivity of (70-80 Mbit/s).
Maps created using Ofcom Connected Nations Data for May 2018. This data is produced for Census Geography Output Areas (2011).
58Visitor economy/culture
Tamworth was previously an important medieval community involvement and boost the local
market town, which it still maintains with a busy economy. 90% of these town events occur in
street market and a Norman motte and bailey Tamworth Castle due to the size and
castle. Tamworth Castle is an award-winning infrastructure. The council provides multiple free
tourist attraction, drawing more than 38,000 events in the Castle Grounds, including St
visitors per year. George’s Day and a Fireworks Extravaganza that
attracts almost 40,000 people.
Tamworth has an extensive programme of
outdoor events and cultural activities to promote
Source: Tamworth District Council Future High Streets Fund Bid, 2019
59Transport links
Tamworth is very well located, with great accessibility to multiple particularly in the evening during rush hour along the A5, the
road networks. It is close to the M42 and well connected to both Gungate corridor and within the town centre. The retail parks
the M6 and M1. These roads provides easy access to Sutton around the outskirts of Tamworth also experience considerable
Coldfield, Birmingham, Lichfield, Nuneaton and Solihull. congestion, notably at weekends.
In the town centre there is are two bus terminals and a train Tamworth are looking to benefit from the establishment of HS2,
station, hosting both the West Coast Main Line and Cross developing the area to those who want to commute to London but
Country Route. However, public transport does not operate in the live in a less expensive region.
town after 7pm, with many residents requiring their own transport
or a taxi.
Despite good connectivity there are severe congestion problems,
Source: Tamworth District Council Future High Streets Fund Bid, 2019
60You can also read