WEST COAST DISTRICT WC 01/52
←
→
Page content transcription
If your browser does not render page correctly, please read the page content below
01/52   WEST COAST
        DISTRICT WC
2
3

CONTENT

1. Executive Summary........................................................................................... 4
2. Introduction: Brief Overview............................................................................. 6
     2.1 Location ................................................................................................................... 6
     2.2 Historical Perspective ............................................................................................... 7
     2.3 Spatial Integration .................................................................................................... 7
     2.4 Land Ownership……………………………………………………………………………..7
3. Social Development Profile............................................................................... 8
     3.1 Key Social Demographics ........................................................................................ 8
     3.1.1 Population………………………………………………………………………………….9
     3.1.2 Gender, Age and Race………………………………………………………………..10
     3.1.3 Households……………………………………………………………………10
     3.2 Health Profile……………………………………………………………………………….11
     3.3 COVID-19………………………………………………………………………………….12
     3.4 Poverty Dimensions ............................................................................................... 12
     3.4.1 Distribution .......................................................................................................... 12
     3.4.2 Inequality ............................................................................................................. 12
     3.4.3 Employment/Unemployment ............................................................................... 13
     3.4.4 Crime .................................................................................................................. 14
     3.5 Education and Skills Profile .................................................................................... 14
4. Drivers of the Economy .................................................................................. 15
     4.1.    Structure of the Economy.................................................................................... 15
     4.2.    Primary sector ..................................................................................................... 16
     4.3.    Secondary sector ................................................................................................ 16
     4.4.    Tertiary sector ..................................................................................................... 16
     4.5.    Informal Economy ............................................................................................... 16
     4.6.    Economic Growth Forecast ................................................................................. 17
5. Service Delivery ............................................................................................... 17
     5.1.    Water and Sanitation .......................................................................................... 18
     5.2.    Human Settlements ............................................................................................ 19
     5.3.    Electricity ............................................................................................................ 19
     5.4.    Waste Management ............................................................................................ 20
     5.5.    Transport ............................................................................................................ 20
6. Governance and Management ........................................................................ 21
     6.1 Municipal Performance ........................................................................................... 21
     6.2 Municipal Capacity ................................................................................................. 22
     6.3 Traditional Leadership…………………………………………………………………….22
7. PROJECTS TO DIVERSIFY AND GROW PEOPLE AND THE ECONOMY .... 23
     7.1 Spatial Development .............................................................................................. 23
     7.2 Ecological Potential and Biodiversity ...................................................................... 24
     7.3 Social Development Projects.................................................................................. 24
     7.4 Economic and Infrastructure Projects ..................................................................... 25
8. KEY RECOMMENDATIONS ............................................................................. 25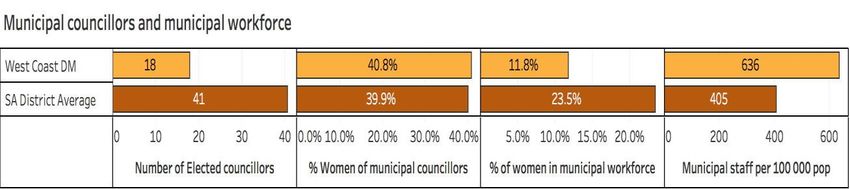
4

    1. Executive Summary
The West Coast District covers an area of 31 229 km2 and is situated along the Atlantic
coast of the Western Cape, extending approximately 350 km from north to south. It
includes the coastal plain and is generally bounded on the east by the mountains of
the escarpment, though in the case of the Cederberg Mountains the border passes
further to the east along the Doring River. The largest towns in the district are
Vredendal and Saldanha Bay on the Cape Columbine Peninsula, Malmesbury in the
Swartland and Vredendal in the Olifants River Valley. The district is divided into five
local municipalities which are:
    •   Bergrivier;
    •   Cederberg;
    •   Matzikama;
    •   Saldanha Bay; and
    •   Swartland.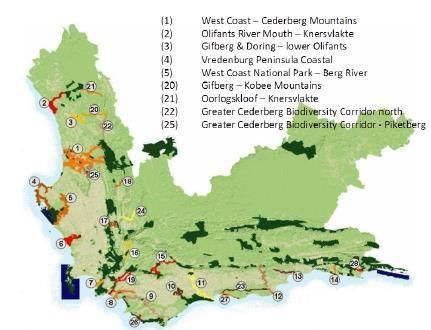
5

In 2018 there were a total of 131 000 households in the West Coast District. The
average household size has reduced from 3.6 in 2008 to 3.5 in 2018. More than 39
000 of these households are located in the Swartland Local Municipality followed by just
over 35 000 households in the Saldanha Local Municipality.

In respect of COVID-19, as at 01 July 2020 there were 1 516 cases and 907
recoveries. Of great concern is the fact there are 18 200 HIV positive people in the
district (West Coast District Health report 2018/29), which is one of the comorbidities
that may exacerbate the negative impact of COVID-19.

In 2019, there were 224 000 people living in poverty, using the upper poverty line
definition, across West Coast District Municipality - this is 44.05% higher than the
156 000 in 2009. The percentage of people living in poverty has increased from
42.65% in 2009 to 47.40% in 2019, which indicates a increase of -4.76 percentage.The
District’s Gini’s coefficient has been on the rise and is 0.60 and the Human
Development Index (HDI) is above 0.7.

The lower-bound poverty line has increased from R370 in 2006 to R758 per
person per month in 2017 while the upper-bound poverty line has increased from
R575 in 2006 to R1 138 per person per month in 2017. During the 2009-2018
period, the West Coast has created over 30, 000 jobs, which resulted in a 24%
increase in jobs.

From a service delivery perspective, 81.18% of the t o t a l               number          of
h o u s e h o l d s have piped water inside the dwelling. 15.20 % get water in the yard
and 1.30% of households have no access to formal water.

West Coast District Municipality had a total number of 96 700 (74.42% of total
households) very formal dwelling units, a total of 15 200 (11.73% of total
households) formal dwelling units and a total number of 10 600 (8.17% of total
households) informal dwelling units.

The region within West Coast with the highest number of flush toilets is Swartland
Local Municipality with 36 000 or a share of 29.53% of the flush toilets within West
Coast. The region with the lowest number of flush toilets is Cederberg Local
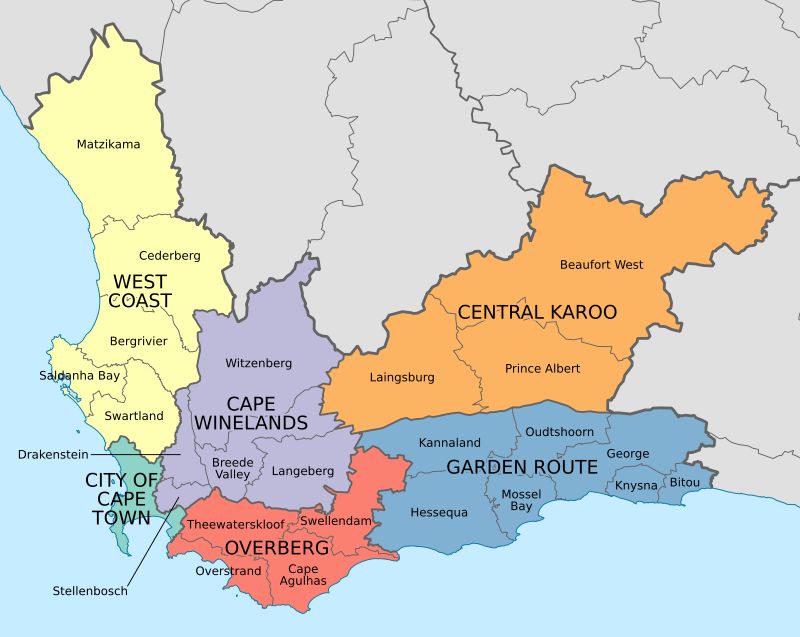
6

Municipality with a total of 14 800. When looking at the sanitation backlog (number of
households without hygienic toilets) over time, it can be seen that in 2008 the
number of Households without        any hygienic toilets in West Coast District
Municipality was 8 260, this decreased annually at a rate of -2.14% to 6 650 in 2018.

The top 3 sectors in the West Coast District in terms of GVA include Finance,
Manufacturing and Agriculture. The 10-year trend shows that the agriculture, forestry
and fishing sector registered the highest average growth rates (4.3 per cent).

2. Introduction: Brief Overview
2.1 Location
The West Coast District covers an area of 31 229km² and comprises 24% of the total
area of the Western Cape but hosts merely 6.8% of the provincial population. The
District is bounded by the Namakwa District of the Northern Cape in the northeast and
in the southeast and south by the Cape Winelands District and the Cape Metro. A
unique characteristic of the District is that all five the local municipalities include
portions of the approximately 350km of coast line area along the Atlantic Ocean to the
west.
7

2.2 Historical Perspective
The West Coast stretches from Cape Town as far as the border with the Northern
Cape at Touws River, including within its parameters the indescribably beautiful
Cederberg Mountains, famous for centuries-old rock art. All along this stretch of
coastline is a series of quaint historic towns and fishing villages with names like
Lambert’s Bay, Paternoster, Saldanha and Langebaan that today roll with ease off the
tongue, but until fairly recently were left to languor in relative obscurity.

The region is Rooibos tea country, being the only place in the world where the bush,
producing this healthy beverage, is grown. The land has, for most of its recorded
history, been used for large-scale wheat farming and has become known as the
breadbasket of South Africa. The oldest wine estate dates back to 1696. The name
'Swartland' (black land) originated from the indigenous Renosterveld, the unique and
threatened vegetation of the area. These shrubs are dark grey and turn almost black
in summer, therefore the name. The only green granite in the world is transported from
the town of Bitterfontein. The villages are small and many have their origins as mission
stations or stock posts and still reflect this quaint character.

2.3 Spatial Integration
The municipality, which covers an area of 31,119 square kilometres, lies along the
Atlantic coast of the Western Cape, extending approximately 350 kilometres from
north to south. It includes the coastal plain and is generally bounded on the east by
the mountains of the escarpment, though in the case of the Cederberg mountains the
border passes further to the east, along the doring river, so that the mountains are
included in the municipal area.

The southernmost part of the district, adjacent to Cape Town, is known as
the Swartland and is primarily a grain-farming area. The Berg River flows across the
Swartland from its sources in the boland mountains. On the coast west of the
Swartland is the Cape Columbine peninsula, with a number of coastal holiday resorts
as well as the ore-export harbour at Saldanha bay. On the north the Swartland is
bounded by mountains which separate it from the Olifants River Valley.

2.4 Land Ownership

Land in the West Coast District is primarily privately owned. There are however a
8

few areas where the ownership should be noted:
        •      Moravian Mission Stations where land is communally owned by the
               church: Goedverwacht, Wittewater and Wupperthal
        •      Land held in Trust for the Community by the national department
               responsible for land reform in terms of the Rural Areas Act, Act 9 of
               1987: Ebenhaeser
        •      SANParks: West Coast National Park

        •      SA Navy: SAS Saldanha and Military Academy of the
               University of Stellenbosch
        •      SA Air Force: Air Force Base Langebaanweg

        •      Transnet National Ports Authority: Saldanha Port

The upper valley of the Olifants is predominantly a citrus-farming region. The
Cederberg mountains, much of which are a protected wilderness area, rise from the
eastern bank of the river, while along the coast to the west are fishing and holiday
villages. The Olifants river continues northwards until, on the edge of the Knersvlakte,
it turns west towards the Atlantic. In the lower valley there is a narrow strip of lush
agricultural land irrigated by the river's water. The Knersvlakte, which is part of the arid
Namaqualand region, forms the northernmost part of the district.

The largest towns in the district are Vredenburg and Saldanha on the Cape Columbine
peninsula, Malmesbury in the Swartland, and Vredendal in the Olifants River Valley.

3. Social Demographic Profile
3.1 Key Social Demographics
3.1.1 Population
With 464 000 people, the West Coast District Municipality housed 0.8% of South
Africa's total population in 2018 which represents 6.9% of the total population of the
Western Cape. Between 2008 and 2018 the population growth averaged 2.73% per
annum which is close to double than the growth rate of South Africa as a whole
(1.61%). Compared to the Western Cape's average annual growth rate (2.28%), the
growth rate in West Coast's population at 2.73% was very similar to that of the
province.
9
CHART 1. POPULATION PYRAMID - WEST COAST DISTRICT MUNICIPALITY, 2008 VS. 2018
[PERCENTAGE]
Population structure
West Coast, 2008 vs. 2018
Male Female
15-19
30 000 20 000 10 000 0 10 000 20 000 30 000
Source: IHS Markit Regional eXplorer version 1854
3.1.2 Gender, Age and Race
In 2018, the female population for the 20 to 34 years’ age group amounted to
12.8% of the total female population while the male population group for the same age
amounted to 13.0% of the total male population. In 2008 the male working age
population at 13.4% still exceeds that of the female population working age
population at 13.4%.
Total population can be categorized according to the population group, as well as
the sub-categories of age and gender. The population groups include African, White,
Coloured and Asian, where the Asian group includes all people originating from
Asia, India and China. The age subcategory divides the population into 5-year
cohorts, e.g. 0-4, 5-9, 10-13, etc.10
African White Coloured Asian
aaaan Male
Female Female Male Female Male Female Male
00-04 3,590 3,880 1,410 1,490 14,100 14,500 154 153
05-09 2,790 2,990 1,790 1,870 14,600 14,600 151 105
10-14 2,530 2,450 2,010 1,830 13,300 13,400 138 159
15-19 3,020 2,910 1,770 1,650 12,400 12,000 126 126
20-24 6,700 6,310 1,290 1,350 12,400 12,300 118 140
25-29 7,060 7,480 1,500 1,520 11,900 12,000 131 143
30-34 7,170 7,310 2,170 1,970 11,500 11,400 101 113
35-39 4,900 5,600 2,340 2,330 10,800 10,600 109 138
40-44 2,540 3,910 2,460 2,540 9,720 9,660 82 162
45-49 1,520 2,310 2,430 2,410 9,240 8,830 79 117
50-54 1,340 1,970 2,240 2,380 8,600 7,860 46 90
55-59 1,070 1,240 2,340 2,360 6,920 6,850 70 51
60-64 942 1,290 2,080 2,130 5,520 4,900 60 57
65-69 685 809 2,060 2,010 4,200 3,570 25 36
70-74 524 463 1,960 1,570 2,710 2,390 20 13
75+ 525 490 3,380 1,950 2,680 1,990 37 26
Total 46,900 51,400 33,200 31,400 151,000 147,000 1,440 1,630
3.1.3 Households
The growth in the number of Coloured headed households was on average 2.43% per
annum between 2008 and 2018, which translates in the number of households
increasing by 16 100 in the period. Although the Asian population group is not the
biggest in size, it was however the fastest growing population group between 2008 and
2018 at 7.95%. The average annual growth rate in the number of households for all
the other population groups has increased with 2.82%.
CHART 2. NUMBER OF HOUSEHOLDS BY POPULATION GROUP - WEST COAST DISTRICT
MUNICIPALITY, 2018 [PERCENTAGE]
Number of Households by Population group
West Coast, 2018
Coloured
Asian
Source: IHS Markit Regional eXplorer version 185411
3.2 Health Profile
The West Coast District municipal area had 62 primary healthcare clinics (PHC) in
2018, which comprises of 25 fixed and 37 mobile clinics as well as one community day
centre. In addition, there are 7 district hospitals, as well as 43 antiretroviral treatment
clinics/ treatment sites and 75 tuberculosis clinics/ treatment sites
PHC Clinics Community Hospitals Treatment Sites
Community
Area Health
Non- Day Centres Region ART TB
Fixed Centres District
fixed al Clinics Clinics
West Coast
25 37 0 1 7 0 43 75
District
Western
190 177 11 62 33 5 283 448
Cape
In 2018, there were 43 ART clinics/treatment sites in the West Coast District municipal
area. The West Coast District’s total registered patients receiving ARTs increased
significantly between 2017 and 2018 (increase of 1 053 patients). The number of new
antiretroviral patients fell by 7, from 2 125 to 2 118 between 2017 and 2018. This
could be an indication that the number of HIV infections is decreasing or an indication
that less people are being tested and receiving access to HIV treatment.
In 2018, the West Coast District experienced a decline in TB cases from 3 800 in
2017 to 3 611 in 2018. The West Coast District with 3 611 TB patients represents
8.8 per cent of the Province’s total patient load. The TB patients are treated in 75 TB
clinics or treatment sites across the WCD municipal area.
Neonatal mortality rate (NMR) (per 1 000 live births) in the West Coast area has
improved from 9.2 in 2017 to 6.4 in 2018. An improvement in the NMR may indicate
progression in new-born health outcomes. The maternal mortality rate in the West
Coast District is 71 deaths per 100 000 live births in 2018.
3.3 COVID-19
In respect of COVID-19, as at 01 July 2020 there were 1 516 cases and 907
recoveries. Of great concern is the fact there are 18 200 HIV positive people in the12
district (West Coast District Health report 2018/29), which is one of the comorbidities
that may exacerbate the negative impact of COVID-19.
3.4 Poverty Dimensions
3.4.1 Distribution
In 2019, there were 224 000 people living in poverty, using the upper poverty line
definition, across West Coast District Municipality - this is 44.05% higher than the
156 000 in 2009. The percentage of people living in poverty has increased from
42.65% in 2009 to 47.40% in 2019, which indicates a increase of -4.76 percentage
points.
3.4.2 Inequality
The District’s Gini’s coefficient has been on the rise and is above 0.58 and the Human
Development Index (HDI) is above 0.7. Saldanha Bay Municipality had the highest
inequality levels in the District, with a gini coefficient of 0.604 and Bergrivier
Municipality the lowest with a gini of 0.579. Income inequality in the West Coast District
has worsened between 2012 and 2018, with the gini coefficient increasing from 0.560
in 2012 to 0.595 in 2018.
3.4.3 Employment/Unemployment
Since 2015, the unemployment rate in the West Coast District has been rising steadily
in the area, reaching 10.7 per cent in 2018. This is lower than the Provincial rate of
17.7 per cent. Unemployment remains a key challenge for the West Coast District,
with rising population numbers. Up-skilling of the labour force, implementation of
levers such as local economic development strategies are all key in order to increase
potential employment opportunities and boost economic growth in the area.
The agriculture, forestry and fishing sector contributed the most jobs to the area in
2017 (69 316; 38.5 per cent), followed by the wholesale and retail trade, catering and
accommodation sector (30 051; 16.7 per cent) and the community, social and
personal services (19 962;11.1 per cent) sector. Combined, these three sectors
contributed 119 329 or 66.3 per cent of the 180 050 jobs in 2017.
Contribution
to Number Trend Employment (net change)
employment of jobs
Sector 2017 2017 2008 - 2017 2014 - 2018e 2014 2015 2016 2017 2018e
Primary sector 38.7% 69 769 -15 688 4 440 -2 60 12 60 -2 51 -2 10 -94013
Agriculture, forestry
38.5% 69 316 -15 529 4 479 -2 609 12 590 -2 511 -2 094 -897
& fishing
Mining & quarrying 0.3% 453 -159 -39 1 16 -6 -7 -43
Secondary sector 13.1% 23 584 1 965 2 570 874 893 560 205 38
Manufacturing 8.9% 16 099 487 1 335 494 769 110 68 -106
Electricity, gas &
0.2% 423 83 14 5 9 9 5 -14
water
Construction 3.9% 7 062 1 395 1 221 375 115 441 132 158
Tertiary sector 48.2% 86 697 22 389 11 553 2 460 2 761 1 648 2 580 2 104
Wholesale & retail
trade, catering & 16.7% 30 051 8 450 5 121 686 1 391 708 1 544 792
accommodation
Transport, storage &
2.5% 4 459 1 271 216 -129 204 18 102 21
communication
Finance, insurance,
real estate & 8.5% 15 278 4 246 2 718 440 650 373 501 754
business services
General
9.4% 16 947 3 861 1 008 996 -208 393 -461 288
government
Community, social &
11.1% 19 962 4 561 2 490 467 724 156 894 249
personal services
Total West Coast
100.0% 180 050 8 709 18 563 726 16 26 -309 684 1 202
District
Several sectors experienced net job losses over the years between 2014 and 2018,
with the agriculture, forestry and fishing sector shedding the many jobs especially in
2014, 2016 and 2017. This could possibly be attributed to the effects of the prolonged
drought in the District.
The sector which reported the largest increase in jobs between 2014-2018 was the
wholesale, retail and trade (5 121), which showed consistent growth over each of the
years during this period; agriculture, forestry and fishing sector (4 479) as a result of
a strong growth in 2015 even though there have been subsequent job losses, and the
financial and business services (2 718) which also showed consistent growth over the
period
3.4.4 Crime
Within the West Coast District area, the number of murders fell slightly from 129 in
2017/18 to 127 in 2018/19. The murder rate (per 100 000 population) increased from
29 in 2017/18 to 28 in 2018/19. Within the District, the actual number of murders was
highest in Swartland (36), the highest murder rate per 100 000 population was for
Cederberg (48), well above the District rate of 28 per 100 000 population
There were 512 sexual offences in the West Coast District area. Drug-related crime
within the West Coast District area dropped significantly in 2018/19, from 8 188 cases
in 2017/18 to 5 819 cases in 2018/19. The number of cases of driving under the14
influence of alcohol or drugs in the WCD area shows an increase of 80, from 579 in
2017/18 to 659 in 2018/19. Residential burglary cases within the West Coast District
area increased slightly from 2 802 in 2017/18 to 2 813 in 2018/19. The number
of road user fatalities increased in the West Coast District area in 2018, compared
to the previous year. Fatalities for 2018 totaled 121 while in 2017 the total was
110.
3.5 Education
Within the West Coast District Municipality, the number of people without any
schooling decreased between the years 2008 and 2018 with an average annual rate
of -1.46%, while the number of people within the 'matric only' category increased
from 52,000 to 82,800. The number of people with 'matric and a certificate/diploma'
increased with an average annual rate of 3.50%, with the number of people with a
'matric and a Bachelor's' degree increasing with an average annual rate of 5.26%.
The overall improvement in the level of education is visible with an increase in the
number of people with 'matric' or higher education.
West Coast as West Coast as
West Coast Western Cape National Total
% of province % of national
No schooling 11,300 84,600 2,170,000 13.3% 0.52%
Grade 0-2 4,160 49,900 668,000 8.3% 0.62%
Grade 3-6 33,000 319,000 3,080,000 10.3% 1.07%
Grade 7-9 81,000 909,000 6,100,000 8.9% 1.33%
Grade 10-11 71,500 1,130,000 8,850,000 6.4% 0.81%
Certificate /
diploma without 683 18,700 180,000 3.7% 0.38%
matric
Matric only 82,800 1,390,000 11,000,000 6.0% 0.75%
Matric
certificate / 14,500 274,000 2,270,000 5.3% 0.64%
diploma
Matric
Bachelors 9,420 267,000 1,680,000 3.5% 0.56%
degree
Matric Postgrad
3,690 133,000 787,000 2.8% 0.47%
degree
Source: IHS Markit Regional eXplorer version 1854
The total number of schools in the West Coast District dropped from 129 in 2014 and
2015 to 125 in 2016. However, the number of schools with libraries increased
steadily over this period, from 57 in 2014 to 61 in 2016.15
4. Drivers of the Economy
4.1 Structure of the Economy
GDP performance in the West Coast District Municipalities has been volatile over the
last 5 years. There was a steady decline in GDP from 2014 to 2016. GDP also
significantly declined from 2017 to 2018.
The top 3 sectors in the West Coast in terms of GVA include Finance,
Manufacturing and Agriculture.
Gross Value Added (GVA) by aggregate sector
West Coast District Municipality, 2019
Tertiary
sector
Primary
Secondary
sector
sector
Source: IHS Markit Regional eXplorer version 1946
The local municipalities in the West Coast have performed similarly to the district
municipality in terms of GDP growth over the last 5 years with a steady decline from
2014 to 2016, with a slight uptick between 2016 and 2017. Saldanha Bay
performed the best in 2018 with 0.9% growth.
Cederberg had the highest average annual economic growth, averaging 1.53%
between the years 2008 and 2018 when compared to the rest of the regions within
the West Coast District Municipality. The Bergrivier Local Municipality had the
second highest average annual growth rate of 1.42%. Saldanha Bay Local
Municipality had the lowest average annual growth rate of 0.27% between 2008
and 2018. The greatest contributor to the West Coast District Municipality
economy is the Saldanha Bay Local Municipality with a share of 34.49% or R 11.3
billion increasing from R 5.97 billion in 2008. The economy with the lowest
contribution is the Cederberg Local Municipality with R 4.09 billion growing from R
2.09 billion in 2008.16 4.2 Primary Sector The 10-year trend shows that the agriculture, forestry and fishing sector registered the highest average growth rates (4.3 per cent). Growth in the agriculture, forestry and fishing sector experienced a positive growth rate of 12.0 percent in 2017, showing some recovery from the following the contractions experienced in 2015 and 2016, however it is estimated to contract again by 4.7 per cent in 2018. Although overall growth was relatively strong in 2017 (3.2 per cent), at 0.1 per cent, estimated growth for 2018 is virtually non-existent. 4.3 Secondary Sector The secondary sector was the worst performing sector between 2008 and 2017. With muted growth in the manufacturing sector and contractions in the electricity, water and gas sector, the secondary sector as a whole grew at an average rate of 1.3 per cent per annum. Estimates for 2018, however, are indicative of a turnaround in the secondary sector. With an estimated growth rate of 2.2 per cent in 2018, the secondary sector, driven by the 3.2 per cent growth rate experienced in the manufacturing sector 4.4 Tertiary Sector The tertiary sector was the West Coast District’s largest contributor to GDPR in 2017. Valued at R14.9 billion in 2017, the tertiary sector contributed 50.0 per cent to total GDPR in the West Coast District. The main drivers of economic activity in the tertiary sector were the wholesale and retail trade, catering and accommodation (15.2 per cent), finance, insurance, real estate and business services (11.0 per cent), and general government (10.1 per cent) sectors. 4.5 Informal Sector The informal sector employed over 14.8 per cent of the manufacturing sector’s workforce since 2015 and employment within this category has grown sharply since. The informal sector of the agriculture, fishing and forestry makes up 18.5 per cent (2016) of the sector’s workforce and was the only sector to experience and sustain employment growth over the long term (with growth averaging 2.9 per cent per annum since 2016).
17

Nearly a third (30.5 per cent) of the commercial services workforce operates within
the informal sector, which has been the fastest growing among the skill categories
and created the majority of the 13 579 jobs since 2016. Informal employment within
the general government & community, social and personal services sectors has seen
significant growth since 2015, averaging 17.1 per cent per annum.

4.6 Economic Growth Forecast
It is expected that West Coast District Municipality will grow at an average annual rate
of 1.24% from 2018 to 2023. The average annual growth rate of Western Cape
Province and South Africa is expected to grow at 1.34% and 1.16% respectively by
2023, West Coast's forecasted GDP will be an estimated R 22 billion (constant 2010
prices) or 4.7% of the total GDP of Western Cape Province. The ranking in terms
of size of the West Coast District Municipality will remain the same between 2018
and 2023, with a contribution to the Western Cape Province GDP of 4.7% in 2023
compared to the 4.7% in 2018. At a 1.24% average annual GDP growth rate between
2018 and 2023, West Coast ranked the fourth compared to the other regional
economies.

5. Service Delivery
5.1 Water and sanitation
West Coast District Municipality had a total number of 106 000 (or 81.18%)
households with piped water inside the dwelling, a total of 19 800 (15.20%)
households had piped water inside the yard and a total number of 1 690 (1.30%)
households had no formal piped water.

                                                                Communal
                                              Communal         piped water:
                 Piped water    Piped        piped water:       more than       No formal
                    inside     water in    less than 200m       200m from         piped            Total
                  dwelling      yard        from dwelling        dwelling         water
                                            (At RDP-level)     (Below RDP)
 Matzikama            16,600       3,750                497                41           501          21,400
 Cederberg            12,300       2,950                306                91           458          16,100
 Bergrivier           16,400       2,410                 55                49           344          19,300
 Saldanha Bay         28,400       5,430             1,670                155            63          35,700
 Swartland            31,800       5,210                133                20           321          37,500
 Total
  West Coast         105,463     19,751              2,658                355         1,687        129,915

                                                       Source: IHS Markit Regional eXplorer version 1854
When looking at the water backlog (number of households below RDP-level) over
time, it can be seen that in 2008 the number of households below the RDP-level
18
were 5 340 within West Coast District Municipality, this decreased annually at -
9.16% per annum to 2 040 in 2018.
The region within West Coast with the highest number of flush toilets is Swartland
Local Municipality with 36 000 or a share of 29.53% of the flush toilets within West
Coast. The region with the lowest number of flush toilets is Cederberg Local
Municipality with a total of 14 800 or a share of 12.17% of the total flush toilets within
West Coast District Municipality.
When looking at the sanitation backlog (number of households without hygienic
toilets) over time, it can be seen that in 2008 the number of Households without
any hygienic toilets in West Coast District Municipality was 8 260, this decreased
annually at a rate of -2.14% to 6 650 in 2018.
Ventilation
Flush toilet Improved Pit Pit toilet Bucket No toilet Total
(VIP) system
Matzikama 19,400 545 141 524 708 21,400
Cederberg 14,800 252 56 298 641 16,100
Bergrivier 18,400 171 27 352 268 19,300
Saldanha Bay 33,200 42 9 2,030 389 35,700
Swartland 36,000 301 174 749 285 37,500
Total
West Coast 121,953 1,310 407 3,954 2,291 129,915
5.2 Human Settlements
West Coast District Municipality had a total number of 96 700 (74.42% of total
households) very formal dwelling units, a total of 15 200 (11.73% of total
households) formal dwelling units and a total number of 10 600 (8.17% of total
households) informal dwelling units.
Other
Very Formal Informal Traditional dwelling Total
Formal type
Matzikama 14,100 4,500 1,580 758 440 21,400
Cederberg 11,100 2,100 1,450 1,100 277 16,100
Bergrivier 15,400 2,180 829 441 386 19,300
Saldanha Bay 26,700 1,390 4,680 2,540 405 35,700
Swartland 29,400 5,070 2,070 486 544 37,500
Total
West Coast 96,679 15,245 10,611 5,327 2,053 129,915
Source: IHS Markit Regional eXplorer version 1854
The region within the West Coast District Municipality with the highest number of
very formal dwelling units is the Swartland Local Municipality with 29 400 or a share of19
30.36% of the total very formal dwelling units within West Coast District Municipality.
The region with the lowest number of very formal dwelling units is the Cederberg
Local Municipality with a total of 11 200 or a share of 11.53% of the total very
formal dwelling units within West Coast District Municipality.
When looking at the formal dwelling unit backlog (number of households not living in
a formal dwelling) over time, it can be seen that in 2008 the number of
households not living in a formal dwelling were 11 100 within West Coast District
Municipality. From 2008 this number increased annually at 4.98% to 18 000 in 2018.
5.3 Electricity
West Coast District Municipality had a total number of 2 700 (2.08%) households
with electricity for lighting only, a total of 123 000 (94.47%) households had electricity
for lighting and other purposes and a total number of 4 490 (3.45%) households
did not use electricity.
Electricity for
Electricity for lighting and other Not using Total
lighting only purposes electricity
Matzikama 456 20,000 883 21,400
Cederberg 630 14,500 979 16,100
Bergrivier 581 18,300 403 19,300
Saldanha Bay 507 33,200 1,950 35,700
Swartland 526 36,700 274 37,500
Total
West Coast 2,701 122,725 4,489 129,915
Source: IHS Markit Regional eXplorer version 1854
The region within West Coast with the highest number of households with electricity for
lighting and other purposes is Swartland Local Municipality with 36 700 or a share
of 29.92% of the households with electricity for lighting and other purposes within
West Coast District Municipality. The Region with the lowest number of
households with electricity for lighting and other purposes is Cederberg Local
Municipality with a total of 14 500 or a share of 11.79% of the total households with
electricity for lighting and other purposes within West Coast District Municipality.
5.4 Waste Management
West Coast District Municipality had a total number of 109 000 (84.14%) households
which had their refuse removed weekly by the authority, a total of 1 860 (1.43%)
households had their refuse removed less often than weekly by the authority and a20
total number of 11 800 (9.06%) households which had to remove their refuse
personally (own dump).
Removed Personal
Removed less often Removed by removal No refuse
weekly by than weekly community (own removal Total
authority by authority members dump)
Matzikama 17,700 268 773 2,390 218 21,400
Cederberg 11,300 676 1,180 2,550 366 16,100
Bergrivier 15,200 475 895 2,650 85 19,300
Saldanha Bay 33,700 134 550 737 541 35,700
Swartland 31,400 309 2,280 3,430 101 37,500
Total
West Coast 109,306 1,862 5,671 11,765 1,310 129,915
Source: IHS Markit Regional eXplorer version 1854
The region within West Coast with the highest number of households where the
refuse is removed weekly by the authority is Saldanha Bay Local Municipality with 33
700 or a share of 30.86% of the households where the refuse is removed weekly by
the authority within West Coast. The region with the lowest number of households
where the refuse is removed weekly by the authority is Cederberg Local
Municipality with a total of 11 300 or a share of 10.35% of the total households where
the refuse is removed weekly by the authority within the district municipality.
5.5 Transport
The district and towns are well connected to each other and to nearby districts by
means of an extensive road network. However, road maintenance and upgrades are
continuously required to ensure that the road network is in good condition, safe and
accessible. Virtually all towns in the West Coast are physically growing with the
continual provision of new residential units at very low density on the periphery of
towns. The existing minibus and bus services need to be supported, maintained and
upgraded to ensure that public transport provides the key linkages between towns
and communities in the West Coast district. However, the current trend to plan and
develop low density housing, severely undermines the efficiency of public transport
operators. Walking plays a significant role in travelling to work in the West Coast
District.
The development of the IDZ will have a direct and continuous impact on the transport
in the region. It will have an impact on the road network and the capacity thereof.
Freight transport via road and rail will also play a major role in supporting the
development of the IDZ. The N7 as well as the R27 are two major corridors in the21 West Coast and they are major distributors of people, goods and services from the WCDM to other municipalities within the Western Cape, to other provinces as well as cross borders (N7 is the only Cape to Namibia route). The main travel modes used by workers obtained from the National Household Travel Survey (NHTS) for the West Coast, which was undertaken in 2016 shows public transport is used significantly (30.8%), although private transport is still the majority (42.7%). NMT accounts for approximately 26.5% of the total transport demand in the West Coast District. Minibus taxis account for approximately 71% of the total public transport trips in the West Coast. This is primarily because population densities and passenger volumes along most routes do not warrant bus services. There is a limited scheduled public transport bus service from towns of Malmesbury and Saldanha to Cape Town on a daily basis. Buses are contracted to transport some workers and scholars in the area. Major towns within Swartland Local Municipality are the only areas in the West Coast serviced effectively by rail. The only formal long distance commercial bus service that operates through the entire West Coast is run by Intercape. The Metrorail passenger rail service for the Western Cape Region operates as far as Malmesbury. 6. Governance and Management 6.1 Municipal Performance The below mentioned table is a depiction of the institutional stability within the respective municipalities, making up the district:
22

Although the municipalities in this region is stable in terms of institutional stability, the
vacancy of the Municipal Manager post of the Matzikama Municipality is a concern
and are monitored for any potential impact on the stability of the Municipality.

The above table illustrates the grant dependency of Municipalities in the region. The
Municipalities of Cederberg and Matzikama registered the highest percentage of
grant dependency in the region. Although the Municipalities of Saldanha Bay and
Swartland is strongest in terms of the economy, they have also registered the highest
percentage of indigent households, which is clearly linked to the movement of people
seeking employment in the economic hubs where manufacturing is the largest
economic driver in the region.

6.2 Municipal Capacity

                                            MDB Capacity Assessment, 2018

                                              West Coast DM
23
Total municipal staff currently employed 612
Total permanent currently employed 507
Total temporary staff currently employed 105
Total approved positions 563
Total funded vacancies 52
Percentage of funded vacancies 9,24
MDB Capacity Assessment, 2018
6.3 Traditional Leadership
The Traditional and Khoi-San Leadership Act, 2019 (Act No. 3 of 2019), which was
published in the Government Gazette on 28 November 2019, is of historic value as it
is the first legislation that provides for the statutory recognition of the Khoi-San
communities and leaders, provided they meet the criteria contained in the Act.
However, the Act has not yet commenced, because its commencement date has not
yet been proclaimed. Once the Act commences, a Commission on Khoi-San Matters
will be established to receive and investigate applications for recognition of Khoi-San
communities and leaders. The Commission will make recommendations to the
Minister in this regard and the Minister will have the power to recognise such
communities and leaders. There is thus currently no legally recognised Khoi-San
communities or leaders in South Africa. The Act makes provision for two Khoi-San
leadership positions namely senior Khoi-San leaders and branch heads. The
recognised senior Khoi-San leaders will have personal jurisdiction over their
communities.
There are no traditional councils in the Western Cape and representation on any
municipal council in the West Coast.
7 Projects to Diversify and Grow People and the Economy
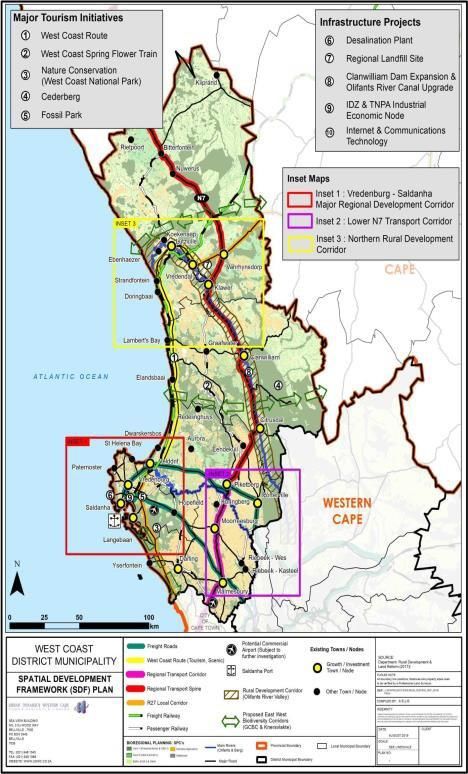
7.1 Spatial Development
The map indicates the key proposals to stimulate
economic growth in the West Coast District. It
also reflects the three key development
corridors, namely:24
• Major Regional Development Corridor
(Saldanha-Vredenburg);
• Regional Development Corridor (Lower
N7, Piketberg-Moorreesburg-
Malmesbury-Cape Town); and
• Northern Olifantsrivier Rural Corridor
7.2 Ecological Potential and Biodiversity
Nine strategic biodiversity and ecological corridors requiring conservation to
preserve biodiversity and improve resilience to climate change are located within the
District of which a few already form part of formalised nature conservation areas.
7.3 Social Development projects
Sport facility funding u p g r a d i n g o f cricket pitches, upgrade of community libraries,
rural library connectivity project and community food gardens across the district
starting in 2020.
7.4. Economic Projects
Expansion of water desalination projects. Investment growth is expected from sectors25
such as protein, dairy, agro-processing, transport, logistics, retail, services and
construction sectors. Expansion of ship repair and maintenance facilities. Expansion
of oyster and mussel farming initiatives.
The below table outlines key infrastructure projects aimed at stimulating and
expanding the economy.
8. Key Recommendations
Key recommendations, as per the municipality’s 2018/19 annual report, to be made
include the following:
• That aspects with regard to service delivery in the district municipality area,
such as the following, be further attended to and supported: sanitation backlogs
(Pit toilet, Bucket system and No toilet), the high proportion of informal dwellings
in the more urban larger towns; and the proportion of households in with no
access to electricity.
• That areas with regard to financial management performance in the District
Municipality and that the District Municipality be assisted in this regard if
necessary.
• That the proposed catalytic projets as part of the Joint District Approach in the
District be supported across government with the necessary financial and
human resources where necessary, as they relate to social development,
economic and environmental challenges and needs in the area and society.26
• That where the District Municipality has an important role to play in mitigating
the rate of climate change in the area, and its ability to cope with climate change
will be improved if it embraces the moves to renewable energy generation,
green building technologies, and improved water management, key projects in
this regard be further explored and considered.
• With the District’s diversity of the natural environment the potential in
opportunities to increase tourism to the area with its resultant economic
development and job creation opportunities. Possibilities need to explored
further as to what needs to be done to maximize opportunities in this regard.27
You can also read