Third District Banking Conditions - As of December 31, 2020

Page created by Warren Stone
 
CONTINUE READING
Third District Banking Conditions - As of December 31, 2020
May

                                                                                      18
                                                                                     2021

                                                     www.PhiladelphiaFed.org   |   @PhiladelphiaFed

Third District Banking Conditions
As of December 31, 2020
PREPARED BY THE RISK ANALYTICS & SURVEILLANCE UNIT
SUPERVISION, REGULATION, AND CREDIT
Third District Banking Conditions - As of December 31, 2020
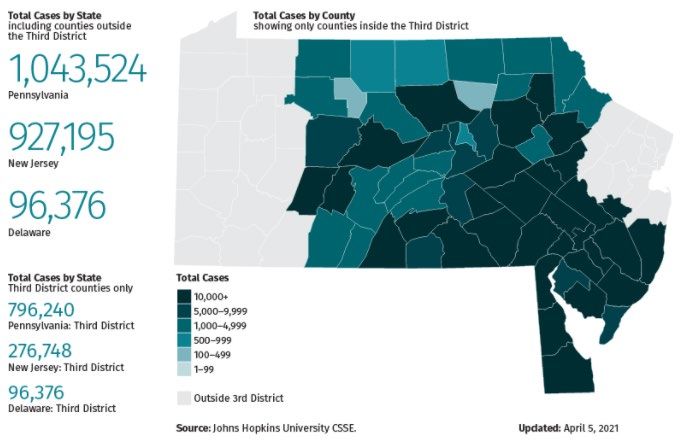
Third District Conditions
                                                Agenda and Table of Contents
    Section 1                        Executive Summary                                                                             Slides                       3‒11

    Section 2                        Commercial Bank Performance                                                                   Slides                       12‒31

                                          Earnings                                                                                 Slides                       13‒19

                                          Credit Quality                                                                           Slides                       20‒26

                                          Loan Growth                                                                              Slides                        27

                                          Capital Adequacy                                                                         Slides                       28‒29

                                          Liquidity                                                                                Slides                       30‒31

                                          Problem Banks                                                                            Slides                        32

                For any questions about this presentation, please contact the Risk Analytics & Surveillance unit at the Federal Reserve Bank of Philadelphia.
                                                                                                                                                                        2
Section 1
Financial Performance Executive Summary

• Financial performance results for Third District community banking organizations* (CBOs) as of 2020:Q4 continue to
  demonstrate solid performance, even with the COVID-19 outbreak. Much of the positive financial performance for the period
  can be attributed to strong asset quality metrics, which were propped up to assist borrowers through several government
  programs, including government stimulus, emergency lending facilities, and forbearances. As these programs roll off in
  coming quarters, however, there could be repayment issues, which may result in an increase in problem loans for community
  banks.
  •   Banks continue to report robust loan performance as noncurrent loans remain in-line with the periods prior to the Great Recession. For
      example, median noncurrent loans for both Third District and national community banks were little changed year-over-year (YoY) and fell to
      54 and 47 basis points, respectively.

  •   Earnings ratios have returned to pre-crisis levels, driven primarily by strong loan growth and loan performance indicators. However, the
      provision expense has more than doubled YoY throughout the District, increasing to 0.18% of average assets. Much of the increase in
      provision expense is for institutions that need to conform with the Current Expected Credit Losses (CECL) guidance. By our community bank
      definition (see slide 12), five community banks are reporting based on CECL guidelines.

  •   All CBOs in the District remain well capitalized, as earnings have been accretive to capital. Additionally, there were several banks that either
      announced or raised capital at the beginning of the pandemic, primarily via subordinated debt issuances. Stock buybacks were initially
      paused in the first few quarters of 2020 but have started to accelerate.

  •   The median noncore funding ratio for the Third District fell 592 basis points YoY primarily due to the influx of deposits from government
      stimulus checks as well as the Payment Protection Program loans, which funded the Small Business Administration (SBA) government-
      initiated emergency loan programs.

                                     * Community banking organizations are defined as national and nonmember banks with less than $10 billion in assets, as well as   3
                                     all state member banks in the Third District.
Update on the Impact of COVID-19
• The coronavirus 2019 disease (COVID-19)
  pandemic has created both a public health crisis
  and an economic crisis in the United States. The
  pandemic has disrupted lives and businesses,
  resulting in a global economic slowdown.
• As of May 5, 2021, there have been more than
  32.6 million confirmed COVID-19 cases and more
  than 579,000 deaths in the United States.
• Vaccinations have been given at record rates,
  averaging 3 million vaccines daily in the U.S.,
  while cases continue to decline.
• The percentage of the fully vaccinated population
  in PA (31.2%), NJ (35.1%), and DE (31.2%)
  continues to increase as more vaccine supply
  becomes available.

                      * Data Source: Johns Hopkins University CSSE, Federal Reserve Bank of Philadelphia Research
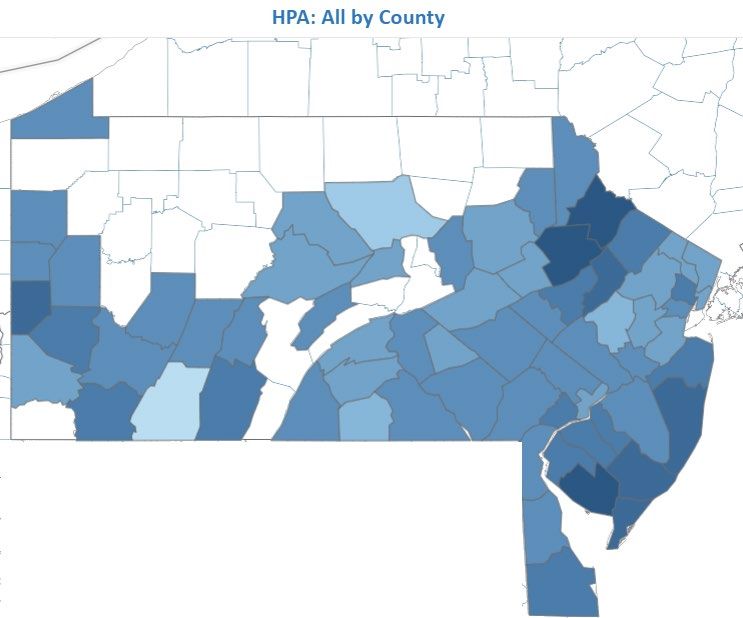
                                                                                                                    4
Home Prices Have Appreciated Significantly YoY, and over 20% in Monroe
County, PA, and Pike County, PA
• Home prices have appreciated significantly YoY throughout the District.

• Some of the counties were severely impacted during the Great Recession but have since rebounded as the housing market
  remains robust.

                                                                  COUNTY            STATE      HPA     Single Family Combined YoY HPA (%)
                                                                          Top Five YoY HPA (%)
                                                                                                             Pennsylvania          9.7
                                                                  Monroe              PA       23.2
                                                                  Pike                PA       21.5           New Jersey          11.4
                                                                  Cumberland          NJ       19.9            Delaware           10.8
                                                                  Atlantic            NJ       19.5
                                                                  Warren              NJ       18.6
                                                                        Bottom Five YoY HPA (%)
                                                                  Somerset            PA       (4.5)
                                                                  Lycoming           PA        0.5
                                                                  Adams              PA        5.1
                                                                  Hunterdon           NJ       5.4
                                                                  Lebanon            PA        5.9

                        Source: RADAR Data as of February 2021.
                                                                                                                                        5
The American Rescue Plan Act of 2021 Was Signed into Law on
March 11, 2021
The $1.9 trillion COVID-19 relief bill expanded federal assistance to renters, homeowners, and
small businesses. Highlights of the bill include:
    • An additional $7.25 billion to the Paycheck Protection Program (PPP).
    • Expanded weekly unemployment benefits of $300 per week have been extended through
      September 16, 2021.
    • Direct payments of $1,400 for a single taxpayer or $2,800 for a married couple that files jointly, plus
      $1,400 per dependent. This applies to individuals earning up to $75,000 per year and married
      couples with incomes up to $150,000.
    • The federal ban on foreclosures and mortgage forbearance programs has been extended through
      June 30, 2021.
     • For borrowers who entered forbearance on or before June 30, 2020, the act provides up to six months of
       additional mortgage payment forbearance in three-month increments.

                                                                                                                6
PA and NJ Were Included within the Top 10 States That Provided
PPP Loans
                         State Ranking                                                             % of Total
                                       Approved                  Approved             Small
                   State Based on Loan                                                               Small      % of Count   % of Amount
                                        Loans                     Dollars          Businesses*
                            Amount                                                                 Businesses
                    PA              6             101,045 $7,980,972,928               1,100,000       3.47%      2.82%         3.77%

                    NJ              7              91,532 $6,778,578,088                908,209        2.86%      2.55%         3.20%
                    DE             48               7,513 $578,584,339                   84,675        0.27%      0.21%         0.27%

      PPP Approved Loans and Dollar Amounts
      Data as of March 28, 2021
     400,000                                                                                                                               $30,000,000,000

     350,000
                                                                                                                                           $25,000,000,000
     300,000
                                                                                                                                           $20,000,000,000
     250,000

     200,000                                                                                                                               $15,000,000,000

     150,000
                                                                                                                                           $10,000,000,000
     100,000
                                                                                                                                           $5,000,000,000
      50,000

          0                                                                                                                                $0
                CA

                TX

               CO

                TN

                AR
                 HI

                AK
                SD

                AS
                 FL

                AZ
                CT

                 ID
                  IL

                VA

                IN

                 IA
                AL
                KY
                SC
                KS

                UT

                VT
               MN

               NH
               NM
               ND
                DC

               ME

               MT

                DE

               GU
                 VI
               MP
                NY

                NJ
               OH
                MI
               GA
               MA

               NC

               MD

               MO

                LA

               NV
                NE

               MS
               WA

               OR
               OK

                 RI

               WV

               WY
                PA

                WI

                PR
                                                                  Approved Loans      Approved Dollars ($MM)
                                                                  (L-Axis)            (R-Axis)

                    Source: SBA
                    *Note: Small Business data as of May 2020.
                                                                                                                                                             7
Loans to Health Care and Professional Services Were the Top
Two Sectors of PPP Loans Nationally
     NAICS Subsector Description*
     Data Through March 28, 2021
     600,000                                                                                                                                                                                                                                                                                                                                                                                                                                                                    18%
                                                                                                                                                                                                                                                                                                                                                                                                                                                                                16%
     500,000
                                                                                                                                                                                                                                                                                                                                                                                                                                                                                14%
     400,000                                                                                                                                                                                                                                                                                                                                                                                                                                                                    12%
                                                                                                                                                                                                                                                                                                                                                                                                                                                                                10%
     300,000
                                                                                                                                                                                                                                                                                                                                                                                                                                                                                8%
     200,000                                                                                                                                                                                                                                                                                                                                                                                                                                                                    6%
                                                                                                                                                                                                                                                                                                                                                                                                                                                                                4%
     100,000
                                                                                                                                                                                                                                                                                                                                                                                                                                                                                2%
          0                                                                                                                                                                                                                                                                                                                                                                                                                                                                     0%

                                                                                                                                                                                and Waste Management…
                                                                                                                                                                Retail Trade

                                                                                                                                                                                                                                                                                                                                                                   Information
                                                                                                                                                                                                                                 Wholesale Trade
                                                                                                                Manufacturing

                                                                                                                                                                                                                                                                                                                                                                                                                  Public Administration

                                                                                                                                                                                                                                                                                                                                                                                                                                                                    Utilities
                                                                                                                                                                                                                                                   Agriculture, Forestry, Fishing

                                                                                                                                                                                                                                                                                                               Real Estate and Rental and
                                                                                                                                Other Services (except Public

                                                                                                                                                                                                                                                                                                                                                                                                                                          Management of Companies
                                                                                                                                                                                                            Transportation and

                                                                                                                                                                                                                                                                                                                                                                                                         Mining
                                                                                       Health Care and Social

                                                                                                                                                                               Administrative and Support
                                        Construction

                                                       Professional, Scientific, and

                                                                                                                                                                                                                                                                                    Arts, Entertainment, and
               Accommodation and Food

                                                                                                                                                                                                                                                                                                                                            Educational Services

                                                                                                                                                                                                                                                                                                                                                                                 Finance and Insurance
                                                                                                                                                                                                               Warehousing
                                                           Technical Services

                                                                                                                                                                                                                                                                                                                                                                                                                                              and Enterprises
                                                                                             Assistance

                                                                                                                                                                                                                                                                                           Recreation
                                                                                                                                       Administration)

                                                                                                                                                                                                                                                            and Hunting
                     Services

                                                                                                                                                                                                                                                                                                                        Leasing
                                                                                                                                                                                                    Approved Loans                                            % of Amount
                                                                                                                                                                                                    (L-Axis)                                                  (R-Axis)

                                                  * The North American Industry Classification System (NAICS) is the standard used by Federal statistical agencies in classifying business establishments for the purpose of
                                                  collecting, analyzing, and publishing statistical data related to the U.S. business economy.
                                                                                                                                                                                                                                                                                                                                                                                                                                                                                      8
Total Number and Amount of PPP Loans for Banks Less Than
$50 Billion in Assets
• The Third District accounted for 5.5% of PPP loans nationally.
• Customers Bank is in the top 10 PPP lenders nationally and accounted for 102,765 loans* with an average size of
  $21,423.

                                                                        Total Number of   Total Amount of % of Total Loans
                                         District                          PPP Loans         PPP Loans       by District
                                  1         Boston                           61,792       $      7,415,055       3.5%
                                  2         New York                        345,359       $     17,336,880       8.1%
                                 3          Philadelphia                    159,112       $     11,784,976       5.5%
                                 4          Cleveland                        84,045       $      9,589,675       4.5%
                                 5          Richmond                        144,339       $     16,663,344       7.8%
                                 6          Atlanta                         242,450       $     25,599,245      12.0%
                                 7          Chicago                         177,519       $     24,054,622      11.3%
                                 8          St. Louis                       177,708       $     15,994,506       7.5%
                                 9          Minneapolis                     123,503       $     13,011,165       6.1%
                                 10         Kansas City                     159,313       $     17,696,353       8.3%
                                 11         Dallas                          174,276       $     19,435,057       9.1%
                                 12         San Francisco                   333,976       $     34,960,445      16.4%
                                          Total                            2,183,392      $ 213,541,323

                       * Source: SBA, Call Report as of December 31, 2020.
                                                                                                                             9
Retail and Office Sectors in the Third District Have Been Negatively
Impacted by the Pandemic
Office Sector
•   Center City coworking organizations have driven increases in available office space. Make Offices, which operates three locations in Philadelphia (111 S
    Independence Mall, 2001 Market St., and 1635 Market St.) announced it was closing, while Common Grounds (62,000 square feet at 1700 Market St.) and
    Industrious (27,000 square feet at Two Liberty Place) were listed for sublease. Additional sublet space may put further pressure on rent growth in the market.

•   Philadelphia Metro 12-month net absorption rate* is negative 4.7 million square feet, while asking rent has increased 0.7%. Harrisburg rental rates are flat,
    increasing 0.1% YoY. Net absorption is negative 348 thousand square feet, while 61.6K square feet of new office space has been delivered to the market.
    The Lehigh Valley 12-month net absorption is negative 25.9 thousand square feet, while the market price per square foot remains stable at $117, which is
    largely unchanged since 2016:Q4.

•   Permanent work-from-home arrangements or hybrid models continue to pose challenges to the metro’s office performance metrics.

       •   A January 2021 PWC survey indicated that less than one in five executives say they want to return to the office as it was pre-pandemic

Retail Sector
•   The COVID-19 impact on the retail sector has accelerated both bankruptcies and downsizing of footprints/stores. Locally, Lord & Taylor, which closed its
    location at the Moorestown Mall in January 2020, announced it would close a 117,000-square-foot location in Bala Cynwyd. Stein Mart is closing its 28,000-
    square-foot location at Concord Square in Wilmington, DE, as well as a location in Ellisburg Circle in Cherry Hill, NJ.

•   12-month sales volume declined 20.8% YoY to $1.1 billion in the Philadelphia Metro area, led by an 82% drop in the mall subsector to 4.7 million from 26.6
    million at YE 2019.

•   Recently, PREIT announced plans to sell lots within its Plymouth Meeting Mall and Moorestown Mall locations to apartment developers to provide mixed-use
    space for the properties.

                                 * Note: Absorption and Completion is a measure of supply and demand. A high absorption rate may indicate that demand is warranted to construct additional units.
                                 Source: CosStar, PwC US Remote Work Survey, January 12, 2021
                                                                                                                                                                                                    10
E-Commerce Has Helped the Third District Industrial Sector Performance

Industrial Sector
•   As consumers began to rely more on home delivery during the pandemic, U.S. e-commerce sales have risen 35%.

      • Amazon recently leased 94,000 square feet at 700 Ramona Ave. in North Philadelphia, an 820,000-square-foot facility at a former G.M.
        plant in Wilmington, as well as a 1.25 million-square-foot building under development in Carney’s Point, NJ.

•   Total industrial leasing hit a record high of 21 million square feet in the Philadelphia metro area last year, up 26% from the annual
    average of the previous three years.

•   Vacancy rates are 5.2% and are expected to remain near 25-year lows based on CoStar forecasts, which would still allow rents to
    increase an average of 3.8% annually over the next five years.

Multifamily
• Asking rents among properties rated 3 stars or lower are up 4.2% YoY as of 2020:Q4; 4-5-star properties rent declined 1.3% YoY for
  the first negative YoY growth since 2009 when it declined 80 basis points. Rising homeownership rates among well-off millennials
  signal near-term challenges for luxury apartment properties.

• 9,800 units are under construction in the Philadelphia metro area, which amounts to 3.0% of the apartment inventory. This is below the
  national average but still comparable to what Philadelphia faced heading into 2016, 2017, and 2018.

                           Source: CosStar
                                                                                                                                               11
Section 2
Conditions of Third District Commercial Banks

                                                        Reporting Methodology
The quarterly Reports of Condition and Income (Call Report) and Uniform Bank Performance Report (UBPR) are the primary
sources of all information contained in this report unless otherwise noted.
Slides in this section focus on trends among the 82 commercial banks within the Third District and state member, national, and
nonmember commercial banks (CBs). The banks excluded from this analysis meet at least one of the following criteria as of
December 31, 2020:
     • Institutions with total assets > $10 billion;
     • Credit card banks (credit card loans and receivables > 50% net loans and credit card receivables);
     • Trust banks (income from fiduciary activities > 30% of interest + noninterest income); and
     • Banks with loans to depository institutions > 30% of net loans.
All Third District state member banks (SMBs) are included in Third District calculations.
The nation consists of all SMBs, national, and nonmember banks within the nation with less than $10 billion in assets.
This report uses the median, the 25th, and the 75th percentiles to compare Third District and national ratios.
The line graphs in the following pages represent the median for the District and the nation, whereas the bar graphs represent
the range of results from the 25th through the 75th percentiles for the data included in each graph.

                                                                                                                                 12
Earnings
Return on Average Assets Ratio

•   Third District earnings performance, based on the return-on-average assets (ROAA) ratio, has been impacted by COVID-19 and continue to lag the nation.
    However, a 27 basis point increase occurred from 2020:Q1 through 2020:Q4.

•   Some of this increase in ROAA is due to a decline in provision expense of 5 basis points quarter-over-quarter (QoQ), as asset quality metrics remain strong.
    Additionally, with another round of stimulus approved on March 11, 2021, asset quality metrics may continue to be positively impacted, which would increase
    earnings results.

                                                                               Return on Average Assets
      1.8%                Annually                                                                                                                                                        Quarterly
      1.5%
      1.2%
      0.9%
      0.6%
      0.3%
      0.0%
      -0.3%
      -0.6%

                         Third District - P25 to P75                         Nation - P25 to P75                            Third District - Median                            Nation - Median

                                The decline in earnings as of year-end 2017 for the District and nation is primarily due to the change in tax law for deferred tax assets (DTA) and mortgage servicing rights (MSR).
                                Many banks had to revalue their position downward at year-end 2017, which negatively impacted earnings.
                                                                                                                                                                                                                       13
Earnings
Net Interest Margin

• The federal funds rate has fallen 200 basis points since 2019 to a bound of 0.00% ‒ 0.25%, which has negatively impacted
  the net interest margin (NIM) as interest income declines.
• The Third District also remains lower than that of the nation before, during, and after the Great Recession.

    5.00%           Annually                                                 Net Interest Margin                                                                                 Quarterly

    4.75%
    4.50%
    4.25%
    4.00%
    3.75%
    3.50%
    3.25%
    3.00%
    2.75%
    2.50%

                    Third District - P25 to P75                        Nation - P25 to P75                          Third District - Median                         Nation - Median

                           The fed funds rate fell from the interest rate bound of 2.00%‒2.25% in July 2019. During the remainder of 2019 and early 2020, there were four decreases in the rates. As of
                           March 15, 2020, the fed funds rate fell 200 basis points to a bound of 0.00%‒0.25%. Earnings can be negatively impacted due to a lower yield on newly underwritten loans and
                                                                                                                                                                                                          14
                           the inability to reprice deposit and borrowings in a timely manner as to not impact net interest income.
Earnings
Yield on Assets and Cost of Funds
•                                                As discussed on the previous slide, the NIM has compressed considerably when compared with that of the nation. The primary reason is because Third District CBOs maintain a lower yield
                                                 on assets and a higher cost of funds, driven mostly by a highly competitive rate environment for both loans and deposits.

•                                                With the fed funds rate at the 0.00%‒0.25% bound, earnings may remain pressured for future reporting periods as banks may be forced to underwrite loans at a lower rate. However,
                                                 earnings will be positively impacted by the decline in interest expense.

•                                                Given the low-rate environment for the District and the nation, both the cost of funds and yield on assets fell, with the gap between the two falling to 15 basis points in 2020:Q4.

                                                                                                    Yields on Assets vs. Costs of Funding
                                                          8.00%             Annually                                                                                                                  Quarterly                  0.00%
Yield on Assets and Cost of Funds Percentatges

                                                                                                                                                                                                                                          Margin Difference between District and Nation
                                                          7.00%                                                                                                                                                                  -0.10%

                                                          6.00%
                                                                                                                                                                                                                                 -0.20%
                                                          5.00%
                                                                                                                                                                                                                                 -0.30%
                                                          4.00%
                                                                                                                                                                                                                                 -0.40%
                                                          3.00%                                                                                                                                          Current difference
                                                                                                                                                                                                           has fallen to         -0.50%
                                                          2.00%                                                                                                                                           15basis points

                                                          1.00%                                                                                                                                                                  -0.60%

                                                          0.00%                                                                                                                                                                  -0.70%

                                                                  3D Margin vs. Nation (R Axis)      3D Yield on Assets (L Axis)     Nation Yield on Assets (L Axis)     3D Cost of Funds (L Axis)      Nation Cost of Funds (L Axis)

                                                                                                                                                                                                                                                                                          15
Earnings
Provision Expense
•   The provision expense grew during 2020 as publicly traded firms having to comply with CECL guidelines, as five community banks have adopted ASC 2016-13 (CECL).
    However, with strong asset quality metrics, many banks reported a lower provision expense as of 2020:Q4.

•   Additionally, given the economic stimulus to consumers and corporations, asset quality metrics remain historically strong. As a result, future provision expense to fund the
    allowance for capital losses (ACL) or the allowance for loan and lease losses (ALLL) may not experience significant increases. Should the economy begin to wane,
    increased provisions could increase, which would have a negative impact on earnings.

                                                                   Provisions / Average Assets
        1.3%                Annually                                                                                                                Quarterly

        1.1%

        0.9%

        0.7%

        0.5%

        0.3%

        0.1%

       -0.1%

                           Third District - P25 to P75             Nation - P25 to P75               Third District - Median               Nation - Median

                                                                                                                                                                                   16
Earnings
Noninterest Income

• Historically, noninterest income (fee income, overdraft fees, interchange fees) for the Third District has outpaced that
  of the nation. However, in the more recent quarters, the nation has caught up or surpassed the District in certain
  instances, placing further pressure on earnings.

   1.1%             Annually                   Noninterest Income / Average Assets                          Quarterly

   0.9%

   0.7%

   0.5%

   0.3%

   0.1%

                 Third District - P25 to P75       Nation - P25 to P75   Third District - Median   Nation - Median

                                                                                                                             17
Earnings
Overhead Expense
•   Median overhead expense has decreased consistently since 2009 for the Third District and the nation. Additionally, as a result of COVID-19, 2020:Q4 salary expense,
    occupancy expense, and other personnel expenses have continued to decline. The Third District overhead ratio is the lowest since 2004.

•   The reduction in noninterest expenses may also be a sign that banks are trying to run their institutions in an increasingly lean manner so they can control their expenses,
    which could have a positive impact on overall earnings.

                                                           Overhead Expense to Average Assets
     4.0%                   Annually                                                                                                                Quarterly

     3.6%

     3.2%

     2.8%

     2.4%

     2.0%

                          Third District - P25 to P75             Nation - P25 to P75               Third District - Median               Nation - Median

                                                                                                                                                                                  18
Earnings
Core Profitability

• As of 2020:Q4, the Third District’s median core profitability ratio increased by 2 basis points YoY to 1.33%, while the nation decreased
  8 basis points to 1.44%. The lower-core profitability measure for the District is due primarily to a lower NIM but has increased slightly
  on a quarterly basis to lead the nation by 7basis points.

                                                             Core Profitability
                                            Pre-Tax Income Excluding Provisions / Average Assets
   2.50%              Annually                                                                                       Quarterly

   2.00%

   1.50%

   1.00%

   0.50%

   0.00%

                      Third District - P25 to P75        Nation - P25 to P75      Third District - Median      Nation - Median

                                                                                                                                              19
Asset Quality
Noncurrent Loans

• Asset quality metrics continue to exhibit strong performance. However, asset quality performance for 2020:Q4 and
  the previous quarters could have masked some problem loans, which were kept current due to the government
  stimulus, emergency lending facilities, and forbearances. As some of these programs end, obligors may not be able
  to service their debt, which could result in an increase in problem loans.

    4.0%          Annually                         Noncurrent Loan Rate                                  Quarterly

    3.5%

    3.0%

    2.5%

    2.0%

    1.5%

    1.0%

    0.5%

    0.0%

                  Third District - P25 to P75   Nation - P25 to P75   Third District - Median   Nation - Median

                                                                                                                      20
Asset Quality
Noncurrent Loans by Category

• Third District loan performance continues to show ongoing improvement among the principal loan categories, which are near
  or below 2006–2007 metrics. As the median C&I noncurrent loans ratio has fallen 54 basis points to 0.53% YoY, there was a
  small uptick in noncurrent loans for total CRE loans (up 17 basis points to 0.83%) and nonfarm nonresidential CRE (up 23
  basis points to 0.92%).

                                                    Noncurrent Loan Ratios by Loan Category
8.00%              Annually                                                                                                                                                      Quarterly
7.00%

6.00%

5.00%

4.00%

3.00%

2.00%

1.00%

0.00%

                          All Loans            Single & Multifamily             Consumer              C&I           C&LD            CRE (Total)            Nonfrm Nonres

                        This chart uses a 10% capped mean, or winsorized mean, to compute the average District and national ratios. The capped mean is a statistical measure of central tendency
                        without losing observations, especially robust for a small sample. The capped mean is used to reduce the effects of outliers on the calculated average by “capping” values of the
                                                                                                                                                                                                            21
                        upper and lower 5% bounds of institutional data reported.
Asset Quality
Nonperforming Assets

• Additionally, the Third District’s median level of nonperforming assets has been decreasing steadily since 2012. The
  decline is primarily due to the lower level of other real estate owned (OREO) within the District as compared with the
  nation.

                                                               Nonperforming Assets*
    6.0%           Annually                                                                                                                                                  Quarterly
    5.5%
    5.0%
    4.5%
    4.0%
    3.5%
    3.0%
    2.5%
    2.0%
    1.5%
    1.0%
    0.5%
    0.0%

                     Third District - P25 to P75                         Nation - P25 to P75                          Third District - Median                            Nation - Median

                        * NPAs (nonperforming assets) are the total of other real estate owned (OREO) + noncurrent loans (loans 90+ days past due + nonaccrual loans).
                                                                                                                                                                                           22
Asset Quality
The ALLL Reserve Coverage Ratio
•   The ALLL reserve coverage ratio for both District and national CBOs continues to increase, primarily because of the higher unemployment rate from the pandemic.

•   The increase in the ALLL coverage ratio was two-fold: Provision expense more than doubled from 2019:Q4, from $130 million to $337 million. Additionally, asset quality
    remains strong through 2020:Q4, with noncurrent loans decreasing to pre-Great Recession performance.

                                                     Allowance for Loan & Lease Loss Coverage Ratio*
       325%                Annually                                                                                                                                                  Quarterly

       275%

       225%

       175%

       125%

        75%

        25%

                          Third District - P25 to P75                        Nation - P25 to P75                           Third District - Median                         Nation - Median

                                  * The reserve coverage ratio, or ALLL coverage, is calculated by dividing noncurrent loans by the allowance for loan and lease losses.
                                                                                                                                                                                                 23
Asset Quality
Net Charge-off Rates

• Net charge-off rates have declined steadily since 2010 and are now below pre-crisis loss levels for both the
  District and the nation. This may change in coming quarters as stimulus other emergency loan programs begin
  to tail off, which may, in turn, lead to an increase in charge-offs within the District and nation.

                 Annually
                                              Net Charge-offs / Loans
    1.4%                                                                                                  Quarterly
    1.2%

    1.0%

    0.8%

    0.6%

    0.4%

    0.2%

    0.0%

   -0.2%

                Third District - P25 to P75       Nation - P25 to P75   Third District - Median   Nation - Median

                                                                                                                      24
Asset Quality
Troubled Debt Restructurings*

• Third District troubled debt restructurings continue to decline annually; however, the metrics
  remain somewhat elevated when compared with the nation.

                Annually
                                                       Troubled Debt Restructurings**                                                                                          Quarterly
   2.4%

   2.1%

   1.8%

   1.5%

   1.2%

   0.9%

   0.6%

   0.3%

   0.0%

                Third District - P25 to P75                        Nation - P25 to P75                           Third District - Median                            Nation - Median

                       * Troubled debt restructurings (TDRs) were not included on the Call Report until the March 2009 reporting period.
                       ** Under the new standard, a holding company will recognize the entire gain, if any, and derecognize the OREO at the time of sale if the transaction meets the requirements of
                                                                                                                                                                                                        25
                       FASB Topic 606 and its five criteria.
Asset Quality
Other Real Estate Owned and Foreclosures

• One- to four-family other real estate owned (OREO*) continues to decrease; however, the Third District continues to trail in the
  foreclosure process because of the judicial foreclosure process in Pennsylvania, Delaware, and New Jersey.

• Foreclosures have continued to decline due to the stimulus checks and the moratorium of foreclosures, which was recently extended
  until June 30, 2021. Additionally, loans in forbearance continue to decline as consumers catch up on past payments.

                         1-4 Family OREO***                                                                                                                Loans in Process of Foreclosure**
1.6%     Annually                                                                           Quarterly                           1.0%              Annually                                                                                 Quarterly
1.4%                                                                                                                            0.9%

                                                                                                                                0.8%
1.2%
                                                                                                                                0.7%
1.0%
                                                                                                                                0.6%
0.8%                                                                                                                            0.5%

0.6%                                                                                                                            0.4%

                                                                                                                                0.3%
0.4%
                                                                                                                                0.2%
0.2%
                                                                                                                                0.1%
0.0%
                                                                                                                                0.0%

            Third District - P25 to P75                         Nation - P25 to P75                                                                     Third District - P25 to P75                               Nation - P25 to P75
            Third District - Median                             Nation - Median                                                                         Third District - Median                                   Nation - Median
                                   * As a percentage of one- to four-family loans.
                                   ** Loans in the process of foreclosure were not included in the Call Report until the March 2008 reporting period. Pennsylvania, Delaware, and New Jersey are all judicial foreclosure states that can extend
                                   the foreclosure process.                                                                                                                                                                                            26
                                   *** Under the FASB’s new revenue recognition standard (Topic 606), a bank or holding company will recognize the entire gain, if any, and derecognize the OREO at the time of sale if the transaction meets
                                   the requirements of FASB Topic 606 and its five criteria.
Loan Growth
Third District Commercial Bank Median Loan Growth*

•   Third District commercial bank median loan growth* in most categories YoY was positive; however, loan contraction continues to occur in the
    junior lien, HELOC, and leases categories.

•   The significant increase in the C&I portfolio was due to the PPP emergency loan program, which totaled ~$10 billion in loans for the District as of
    2020:Q4.

                                  Leases                                       0.22%

                                  HELOC                         -2.23%

         Construction & Land Development                                                           14.07%

                             Junior Liens                -5.41%

              Nonfarm Nonresidential CRE                                                 6.86%

                               Consumer                -6.73%

                              Multifamily                                                  8.58%

                                Farmland                     -3.20%

                    1-4 Family Mortgages                                         2.31%

                  Commercial & Industrial                                                                                                                                                     80.22%

                              Total Loans                                                        12.38%

                                         -20%            -10%             0%             10%            20%             30%             40%             50%             60%           70%   80%        90%

                                   * This chart shows the median YoY percentage loan growth for Third District commercial banks that meet the community bank definition on Slide 8.
                                                                                                                                                                                                             27
Capital Adequacy
Total Risk-Based Capital Ratio
•   Although capital ratios have increased post-crisis, Third District and national total risk-based capital (RBC) levels have mostly flattened since 2011, with the exception of 2020. The decline
    for the first six months is due to banks opting-in to the community bank leverage ratio (CBLR), which included 26 community banks in the Third District as of 2020:Q4. Most of these banks
    had ample levels of total RBC as of 2019:Q4 prior to the CBLR opt-in.

•   The total RBC ratio also remains well below the level of the nation, a difference of 103 basis points as of 2020:Q4. Much of this can be attributed to Third District CBOs having a larger
    concentration of commercial real estate (CRE) loans, which require a higher amount of capital.

                               Annually
                                                                  Total Risk-Based Capital
        22%                                                                                                                                                          Quarterly

        20%

        18%

        16%

        14%

        12%

        10%

                              Third District - P25 to P75                  Nation - P25 to P75                   Third District - Median                   Nation - Median

                                                                                                                                                                                                      28
Capital Adequacy
Dividend Payments*
•   As of 2020:Q4, median dividend payments* in the Third District climbed to levels seen prior to the COVID-19 outbreak. Many banks took an abundance of caution to
    preserve capital given the economic uncertainty. However, as asset quality remains strong and earnings have increased, banks did increase their dividends.

•   Some banks have provided dividends to their holding companies to service debt; for example, 13 banks in 2020 have issued subordinated debt.

                           Annually
                                                                                         Dividends                                                                                    Quarterly
      100%

       80%

       60%

       40%

       20%

        0%

                             Third District - P25 to P75                        Nation - P25 to P75                          Third District - Median                          Nation - Median

                                 * Some banks pay dividends semiannually; therefore, 1Q and 3Q dividends are normally lower than those for 2Q or 4Q. However, the dividend payout (DPO) ratio for the Third
                                 District is above the value when compared with a year ago, which may indicate that banks may have paid out more of their net income as dividends in 2020.
                                                                                                                                                                                                              29
Liquidity
      Short-Term Investments and Loans to Assets

      • Third District banks continue to hold fewer short-term investments compared with that of the nation. Rather, Third District institutions
        have opted to grow their loan portfolio, and while organic loan growth was not robust, PPP loans have helped increase the growth of
        total loans and assets. However, loan growth was not as strong as 2020 progressed, with the 2020:Q4 Third District median loan to
        asset ratio equal to 2015 metrics.

                    Short-Term Investments / Assets*                                                                                                                Loans / Assets
22%      Annually                                                                         Quarterly                        85%            Annually                                                                      Quarterly
20%
                                                                                                                           80%
18%
16%                                                                                                                        75%
14%
                                                                                                                           70%
12%
10%                                                                                                                        65%
8%                                                                                                                         60%
6%
                                                                                                                           55%
4%
2%                                                                                                                         50%
0%
                                                                                                                           45%

             Third District - P25 to P75                          Nation - P25 to P75
                                                                                                                                            Third District - P25 to P75                               Nation - P25 to P75
             Third District - Median                              Nation - Median                                                           Third District - Median                                   Nation - Median

                                           * Short-term investments equals the sum of interest-bearing bank balances + federal funds sold + securities purchased under agreements to resell + debt securities with a
                                           remaining maturity of one year or less.
                                                                                                                                                                                                                                    30
Liquidity
Noncore Funding Dependence Ratio

• Many Third District banks depend on noncore funding sources to fund balance sheet growth given the competition for deposits. As a
  result, Third District exposure to these noncore sources of funding continues to outpace that of the nation. However, there has been a
  decrease in noncore funding in 2020 due to increased deposits as a result of the PPP emergency loan program as well as the
  government stimulus packages for consumers. At present, banks are flush with liquidity and should be for some time.

                                           Net Noncore Funding Dependence*
     40%              Annually                                                                                                                                       Quarterly
     35%                                                                           In 2010, the FDIC increased the
     30%                                                                           insurance limit from $100,000 to
                                                                                   the current $250,000 threshold.
     25%
     20%
     15%
     10%
      5%
      0%
     -5%
    -10%
    -15%
    -20%

                     Third District - P25 to P75                     Nation - P25 to P75                      Third District - Median                   Nation - Median

                            * Net noncore funding dependence measures the degree to which banks fund longer-term assets with noncore funding sources.
                                                                                                                                                                                 31
Problem Banks
•        Problem banks within the nation increased by 5 YoY to 56 as of 2020:Q4; however, a downward trend has continued since the peak in 2011.

•        Four banks failed 2020, including Ericson State Bank in Ericson, NE, The First State Bank in Barboursville, WV, First City Bank of Florida, and
         Almena State Bank, in Almena KS.

                                                                                                                                               Problem Bank Changes
250                                                                                                                                                                                                                                                                                                                                                       1000
                                                                                                                                                                                                                                     ■ Bank failures during quarter                                                                                       900
200
                                                                                                                                                                                                                                     ■ Quarterly change in problem banks                                                                                  800
150                                                                                                                                                                                                                                                                                                                                                       700
                                                                                                                                                                                                                                                                                                                                                          600
100
                                                                                                                                                                                                                                                                                                                                                          500
    50
                                                                                                                                                                                                                                                                                                                                                          400

     0                                                                                                                                                                                                                                                                                                                                                    300
                                                                                                                                                                                                                                                                                                                                                          200
 -50
                                                                                                                                                                                                                                                                                                                                                          100
-100                                                                                                                                                                                                                                                                                                                                                      0
          1Q09
                 2Q09
                        3Q09
                               4Q09
                                      1Q10
                                             2Q10
                                                    3Q10
                                                           4Q10
                                                                  1Q11
                                                                         2Q11
                                                                                3Q11
                                                                                       4Q11
                                                                                              1Q12
                                                                                                     2Q12
                                                                                                            3Q12
                                                                                                                   4Q12
                                                                                                                          1Q13
                                                                                                                                 2Q13
                                                                                                                                        3Q13
                                                                                                                                               4Q13
                                                                                                                                                      1Q14
                                                                                                                                                             2Q14
                                                                                                                                                                    3Q14
                                                                                                                                                                           4Q14
                                                                                                                                                                                  1Q15
                                                                                                                                                                                         2Q15
                                                                                                                                                                                                3Q15
                                                                                                                                                                                                       4Q15
                                                                                                                                                                                                              1Q16
                                                                                                                                                                                                                     2Q16
                                                                                                                                                                                                                            3Q16
                                                                                                                                                                                                                                   4Q16
                                                                                                                                                                                                                                          1Q17
                                                                                                                                                                                                                                                 2Q17
                                                                                                                                                                                                                                                        3Q17
                                                                                                                                                                                                                                                               4Q17
                                                                                                                                                                                                                                                                      1Q18
                                                                                                                                                                                                                                                                             2Q18
                                                                                                                                                                                                                                                                                    3Q18
                                                                                                                                                                                                                                                                                           4Q18
                                                                                                                                                                                                                                                                                                  1Q19
                                                                                                                                                                                                                                                                                                         2Q19
                                                                                                                                                                                                                                                                                                                3Q19
                                                                                                                                                                                                                                                                                                                       4Q19
                                                                                                                                                                                                                                                                                                                              1Q20
                                                                                                                                                                                                                                                                                                                                     2Q20
                                                                                                                                                                                                                                                                                                                                            3Q20
                                                                                                                                                                                                                                                                                                                                                   4Q20
                                                                                                               Δ Problems (L axis)                                          Failures (L)                                    Problem Bks (R axis)

                                                                   Source: FDIC; problem banks are defined as having a CAMELS composite rating of 4 or 5. CAMELS is an acronym for the components assessed at a safety and soundness
                                                                   examination. The components are Capital, Asset Quality, Management, Earnings, Liquidity, and Sensitivity to Market Risk.
                                                                                                                                                                                                                                                                                                                                                                 32
                                                                   The 20-year high of problem institutions reached 888 as of 2011:Q1.
You can also read