The Quest for "Compounders" + Zooplus (ETR: ZO1) - MOI Global | Best Ideas 2018 January 11-13, 2018 - Hayden Capital
←
→
Page content transcription
If your browser does not render page correctly, please read the page content below
The Quest for “Compounders” + Zooplus (ETR: ZO1)
              MOI Global | Best Ideas 2018
                   January 11-13, 2018

                                                               Hayden Capital
                                                     79 Madison Ave, 3rd Floor
                                                        New York, NY. 10016

                                                          Office: (646) 883-8805
                                                         Mobile: (513) 304-3313
                                             Email: fred.liu@haydencapital.com
Disclaimer
These materials shall not constitute an offer to sell or the solicitation of an offer to buy any interests in any fund or account managed
by Hayden Capital LLC (“Hayden Capital”) or any of its affiliates. Such an offer to sell or solicitation of an offer to buy will only be
made pursuant to definitive subscription documents between a fund and an investor.

The fees and expenses charged in connection with the investment may be higher than the fees and expenses of other investment
alternatives and may offset profits. No assurance can be given that the investment objective will be achieved or that an investor will
receive a return of all or part of his or her investment. Investment results may vary substantially over any given time period.

Reference and comparisons are made to the performance of other indices (together the “Comparative Indexes”) for informational
purposes only. Hayden Capital’s investment program does not mirror any of the Comparative Indexes and the volatility of Hayden
Capital’s investment strategy may be materially different than that of the Comparative Indexes. The securities or other instruments
included in the Comparative Indexes are not necessarily included in Hayden Capital’s investment program and criteria for inclusion in
the Comparative Indexes are different than those for investment by Hayden Capital. The performance of the Comparative Indexes
was obtained from published sources believed to be reliable, but which are not warranted as to accuracy or completeness. Unless
noted otherwise, the returns of the Comparative Indexes presented do not reflect fees or transaction costs, but those returns do
reflect net dividends, if any.

                                            Fred Liu, CFA | 646-883-8805 | fred.liu@haydencapital.com                                 2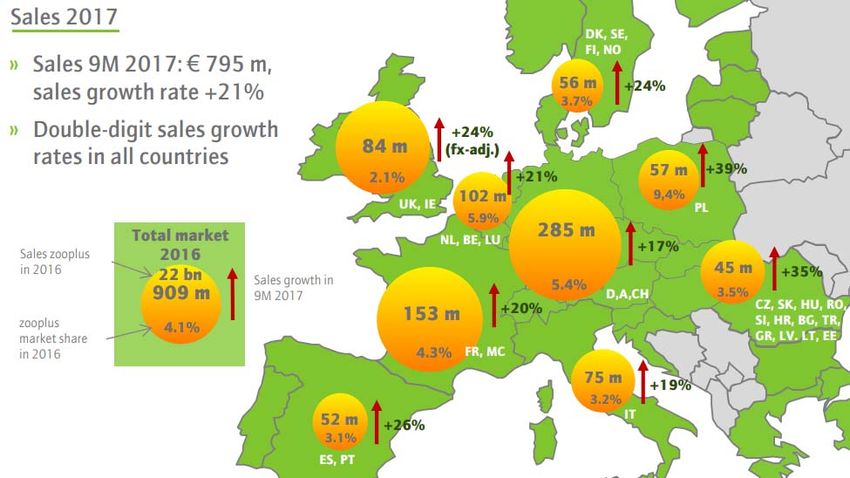
About Me

Fred Liu, CFA
Managing Partner

Fred Liu is Hayden Capital’s founder and portfolio manager. He
holds a B.S. in finance and international business from the Leonard
N. Stern School of Business at New York University. He also holds
the Chartered Financial Analyst (CFA) designation.

Prior to founding Hayden Capital, Fred was a research analyst at
New Street Research responsible for covering the cable and satellite
industries. Before this, he was the industrials analyst on J.P.
Morgan’s Small Cap Equity fund, a five-star Morningstar ranked
strategy that invested in securities under $2 Billion in market cap.

Fred purchased his first stock at the age of 11, and has been an avid
value investor ever since. He currently resides in New York City.

                                           Fred Liu, CFA | 646-883-8805 | fred.liu@haydencapital.com   3
Who Is Hayden Capital?
Investment Strategy: We invest primarily via a long-only, low-turnover, global equity strategy. Investments are under-written with a
10+ year view. The goal is to compound our capital in-line with these businesses’ growth in earnings power.
•    We focus on underlying business unit economics, as opposed to market factors like sentiment or multiple expansion, as the
     source of our returns.
•    Our typical portfolio comprises of 6 – 15 high-quality companies, that we have studied for an extensive period.
•    We don’t aim to “beta-hedge” our positions, as this typically results in sacrificing long-term gains for reducing short-term
     volatility. As long-term investors, we would rather have a superior (although lumpy) annual return, than a steady (but mediocre)
     return.
•    In fact, we embrace volatility in most cases as it allows us to purchase companies we like for cheaper.

Investment Objective: Achieve returns exceeding the broader Global Equity Markets (measured by the S&P 500 and MSCI World),
over a full market cycle. Hayden Capital seeks to achieve these returns primarily through publicly traded, marketable securities of U.S.
and non-U.S. companies.
•    No complex derivatives, “pair-trades”, or significant use of leverage.
•    All accounts are Separately Managed Accounts (“SMAs”), as opposed to a pooled structure. We think this is in the best interests
     of our clients, as it provides clients full ownership of their investments, daily liquidity, and transparency.

                                            Fred Liu, CFA | 646-883-8805 | fred.liu@haydencapital.com                                4
Performance

Performance Table                                                                                                                Cumulative Return Since Inception
Return percentage during period                                                                                                  Compared to S&P 500 Total Return Index & MSCI All-Country World Index

1   Hayden Capital returns are net of actual fees. Individual client performance may differ based on fee schedule and date of funding.
2   Includes Cash and previously an Inverse S&P 500 ETF, which allowed us to decrease our long exposure without paying taxes on profitable positions.
3   Hayden Capital launched on November 13, 2014. Performance for both Hayden Capital and indexes reflects performance beginning on this date.
4   Quarter-to-date performance as of December 12, 2017

                                                                                 Fred Liu, CFA | 646-883-8805 | fred.liu@haydencapital.com                                                               5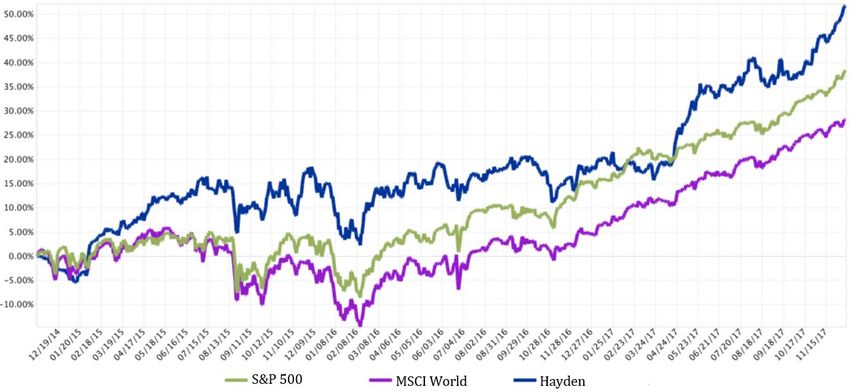
Our Process

Its more valuable to talk about how we fish, rather than show one we’ve already
            caught… but don’t worry, there’s still a fish at the end.

                       Fred Liu, CFA | 646-883-8805 | fred.liu@haydencapital.com   6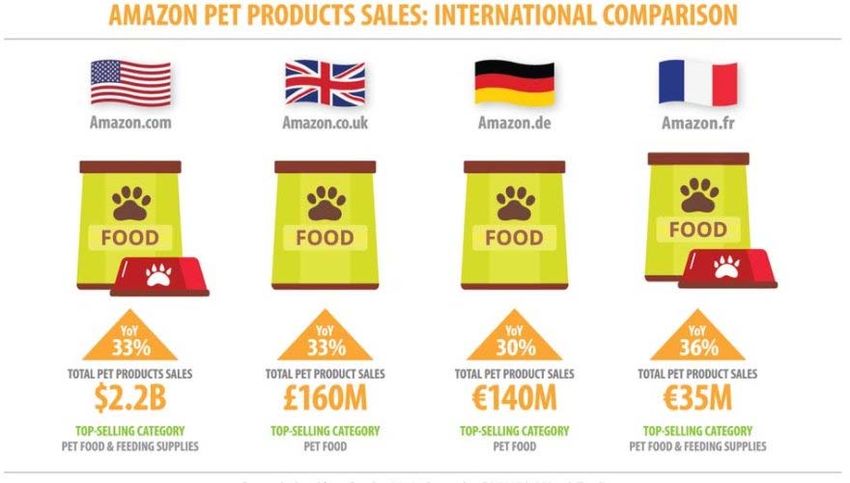
Broadly, There Are Three Types of Investors…
This is how I see the investing landscape, with investors largely broken down into three types. It’s possible to make money with
each method, but the skill set and questions to answer for success in each are different.
Distressed / Deep-value / Event-Driven Funds / Market Neutral / Hayden Capital / “Compounders” /
Sum of Parts Investors “Traders” Long-Term Investors
Growth accelerates
Intrinsic Value because:
…But over a long
Future ROIC >
time horizon, the
Historical ROIC
slope of the
Intrinsic Value
curve is a much
Value
Value
Value
larger driver of
returns.
Better to focus
your time here.
We aim to
purchase stock at
Stock Price a “cheap to fair”
valuation…
Time Time Time
“How do we unlock value / liquidate / “What’s the intrinsic value? Who cares? “How quickly is the intrinsic value
milk this company’s cash flows as quickly as I’m out in 6 months anyways… growing? Where is the company investing?
possible?”
What will cause other traders to change Do the future projects have higher returns
their perception / sentiment / multiple?” vs. historically, and thus cause the a change
/ inflection in the slope of the intrinsic
value curve?”
Fred Liu, CFA | 646-883-8805 | fred.liu@haydencapital.com 7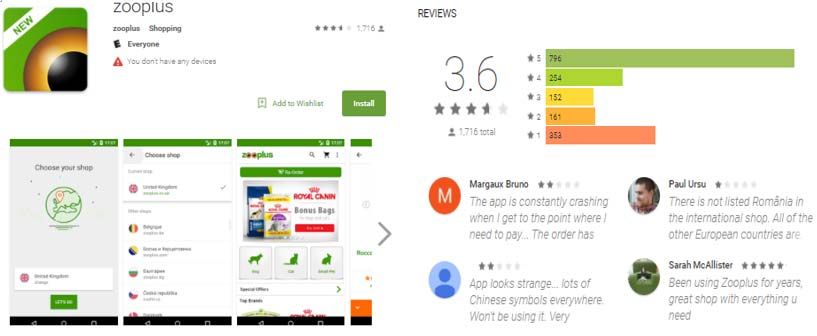
How Quickly Will Intrinsic Value Grow?

                                                            Hayden Capital /
                       Distressed / Deep-value /            “Compounders” /              Event-Driven Funds / Market Neutral /
                        Sum of Parts Investors             Long-Term Investors                         “Traders”

     Stock Return = [Dividend / Stock Buyback] + [Earnings Growth] + [Multiple Expansion / Contraction]

             Earnings Growth = Return on Invested Capital x Reinvestment Rate

                                    Fred Liu, CFA | 646-883-8805 | fred.liu@haydencapital.com                                    8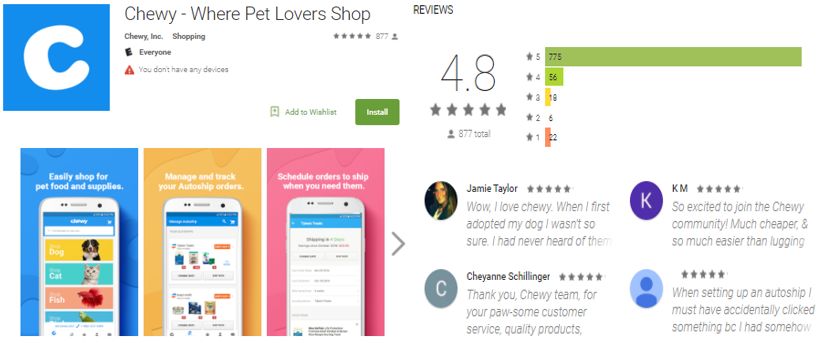
Theory vs. Reality
That’s great in theory… but how do you do it in practice? How do you get the data-points necessary to do this type
of analysis?
Managers should evaluate companies by going to the project level.
The best way to evaluate if someone is a good investor, is to test their decision making process. You need to evaluate the
next “layer” down.
But to know if they made the right decision and am thinking about it properly, you need to have your own opinion also.
It’s impossible to judge if it’s a smart choice (in your opinion), if you haven’t worked the problem out yourself.
Note, this process only matters for long-term investments. Just like how investment managers take years to prove if they have
an edge, companies can take years for projects to realize their full potential. This won’t matter if you’re holding a stock for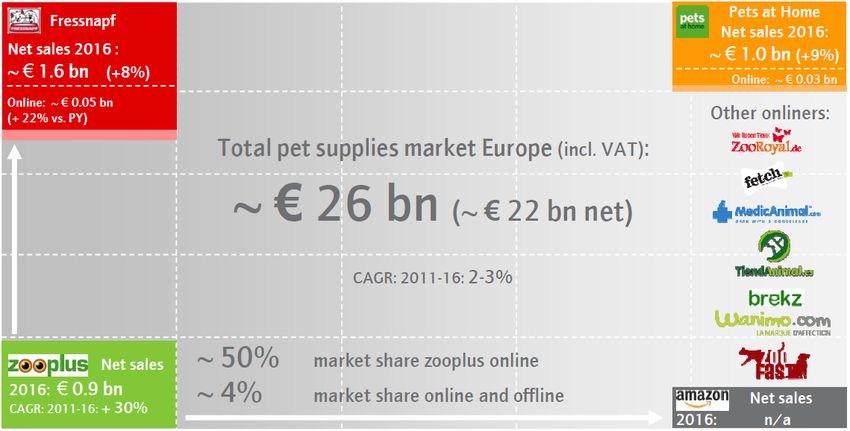
Everyone’s Investing In Something…
                                                                                                                             Allocator’s Questions:
                                                                          Allocator                                          • Which asset class has the highest
                                                    (Endowment, Family Office, HNWI, etc.)                                      opportunities for excess returns?
                                                                                                                             • Who among the asset class’
                                                                                                                                managers is most likely to capture
                                                                                                                                this alpha?

                                                                                                                             Investment Manager’s Questions:
                                                               Investment Manager                                            • Which companies have the best
                                                                                                                                reinvestment opportunities?
                                                   (Fixed Income vs. Equities vs. Commodities,                               • Which management teams are
                                                        Microcap vs. Arbitrage vs. Activist)                                    smart enough and have the right
                                                                                                                                incentives to pick the projects with
                                                                                                                                the highest returns?

                              Company A                                                                            Company B
                    (Reallllyyyy Bad Management)                                                            (World-Class Management)

      Project A                 Project B                     Project C                   Project A                Project B                       Project C
      20% IRR                   15% IRR                      5% IRR +                     12% IRR                  5% IRR                         2% IRR +
  (Great Management’s       (Decent Management’s      Prestige + Higher Salary        (Great Management’s      (Decent Management’s        Prestige + Higher Salary
         Choice)                   Choice)             (Bad Management’s Choice)             Choice)                  Choice)               (Bad Management’s Choice)

      Notice, even though Company A has better overall opportunities for reinvestment (perhaps due to a better industry or better
           competitive position), its bad management will choose Project C, and thus make this an unattractive investment.

  In this scenario, Company B is a better choice (12% IRR vs. 5% IRR), due to smarter management, despite its worse opportunity set.
                                                 This is why good management matters.

                                                   Fred Liu, CFA | 646-883-8805 | fred.liu@haydencapital.com                                                    10
Look Below The Surface…
The best way to evaluate if someone is a good investor, is to
test their decision making process. You need to evaluate the
next “layer” down.
Allocator
But to know if they made the right decision and am thinking
about it properly, you need to have your own opinion also.
It’s impossible to judge if it’s a smart choice (in your opinion),
Allocator’s Process: if you haven’t worked it out yourself.
“Investment Manager: How
are you thinking about
Company A vs. B vs. C?
Why did you choose
Investment
Company B?” Manager
Company A Company C Investment Manager’s
Process:
“Company B: How are you
Company B thinking about Projects A vs.
B vs. C? Which will you
choose and why?”
Project A Project B Project C
Fred Liu, CFA | 646-883-8805 | fred.liu@haydencapital.com 11Reinvestment Rate Fred Liu, CFA | 646-883-8805 | fred.liu@haydencapital.com 12
Reinvestment Rate: How Much Is The Company Investing In Itself ?
Reinvested Earnings = Sustainable Earnings Power – Reported Earnings
Reinvestment Rate = Reinvested Earnings / Sustainable Earnings Power
Sustainable Earnings Power is what the business would theoretically earn if it stopped growing.
There no set “formula” for calculating this. It’s going to be industry & business model dependent.
For example, a commodity business may structurally only earn it’s cost structure difference vs the next most efficient
competitor.
Alternatively, a one-of-kind, mission-critical software provider (think Microsoft in 90’s) has enormous pricing power.
They could raise prices up to the point where new customers = lost customers.
For the last marginal customer in this scenario, the Price = Customer’s Marginal Utility
Commodity Retail Businesses
$ Earned
$4 Price "Investment" ‐>
to generate 20% growth
$ 100 Sustainable Earnings =
$ 96 $4 (Reinvested Earnings) + $1 (Reported Earnings) = $5
Reinvestment Rate =
$4 (Reinvested Earnings) / $5 (Sustainable Earnings) = 80%
Wal-club Inc. (0% Growth) Amachon Inc. (20% Growth)
Fred Liu, CFA | 646-883-8805 | fred.liu@haydencapital.com 13Reinvestment Rate: How Much Is The Company Investing In Itself ?
The better the reinvestment opportunities, the higher the reinvestment rate should be.
If a company has unlimited opportunities to earn 50% returns, management better be plowing every cent back into the
company, and reporting $0 EPS (assuming investments are expensed).
Note: Some companies have a high return project, but limited capacity.
A new factory may cost $5M, with 50% returns. But the business generates $20M a year… what do you do with the
other 15M?
Assuming the other 75% is returned, that’s only 12.5% growth.
Lots of opportunities to deploy capital are just as important as the Return on Invested Capital.
Earnings Growth Drivers
Illustrative Example
Year 1 Year 2 Year 3 Year 4 Year 5
Capital Reinvested
Prior Year Earni ngs $ 20 $ 23 $ 27 $ 32
x Reinves tment Ra te 80% 80% 100% 100%
= Addl Capital Reinvested $ 16 $ 19 $ 27 $ 32
Earnings Growth
Exi s ti ng Ca pi ta l $ 100 $ 116 $ 135 $ 161
+ Rei nves ted Ea rni ngs 16 19 27 32
= Tota l Ca pi ta l Inves tment $ 100 $ 116 $ 135 $ 161 $ 194
x Return on Inv. Capital 20% 20% 20% 20% 20%
= Earnings $ 20 $ 23 $ 27 $ 32 $ 39
memo: Growth Y/Y ‐ Earnings 16.0% 16.0% 20.0% 20.0%
Fred Liu, CFA | 646-883-8805 | fred.liu@haydencapital.com 14Incremental Return on Invested Capital
Fred Liu, CFA | 646-883-8805 | fred.liu@haydencapital.com 15Start with a Framework / Thesis (i.e.. a blank sheet of paper)
Investing and “data-point” analysis is similar to coloring. You’re simply trying to fill in the dots (i.e. piece together knowledge)
to see the end picture.
For example, you think it could be a “wolf ” (it’s what the directions say), but you’re skeptical… There’s no way to find out, until
you start coloring.
(“Wolf ” in this case = an attractive business)
Fred Liu, CFA | 646-883-8805 | fred.liu@haydencapital.com 16Find Data-points that Confirm or Deny the Thesis (i.e. Fill In The Dots)
The picture’s starting to come together… there’s some sort of shape, but it’s still not clear.
Some dots are outside the framework, but the majority seem to fit the outline.
Why’s that look like a Giraffe though??
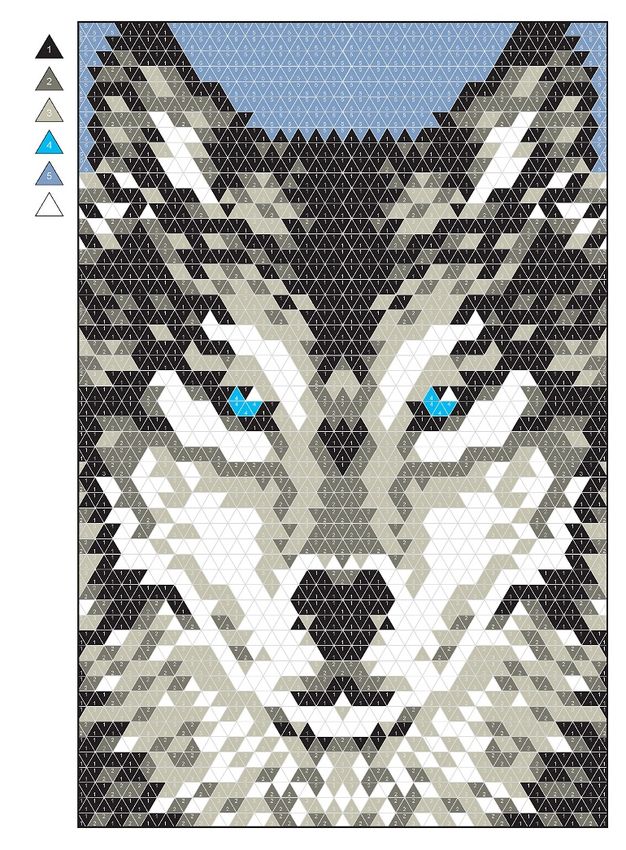
Fred Liu, CFA | 646-883-8805 | fred.liu@haydencapital.com 17Hey, There It Is! You Were Right! It’s a “Wolf ”.
• Turns out it’s a “Wolf ” after-all!… It just took some work to fill in the dots and test the thesis.
• Note: In investing, it’s often too late to wait till the picture is complete. It will be obvious to everyone else by that point too.
• To get an edge, start coloring earlier than other people, collect more “dots” than other people, and invest when the picture is 80% filled in and you’re
confident in the final outcome.
*Astute readers will notice the last three pictures aren’t the same… just checking that you’re paying attention.
Fred Liu, CFA | 646-883-8805 | fred.liu@haydencapital.com 18A Case Study: Zooplus (ZO1)
Fred Liu, CFA | 646-883-8805 | fred.liu@haydencapital.com 19Europeans Love Their Pets… But Not As Much As Americans (Yet)
Europeans are increasingly shopping online for pet supplies, with online pet sales growing ~15% y/y.
E-commerce is rapidly taking share from brick & mortar, due to the convenience and lower prices of online retailers.
This is with an industry growing overall at 2-3% a year.
Pet care spending per household is still less than the US.
Estimated to reach ~€200 per household vs. ~$380 in the US, in five years.
Zooplus customers already spend more than average, at ~€190 per customer per year (vs. ~€150 for Western Europe
today). It seems Zooplus’ customer experience promotes new product discovery, and drives sales.
If Europeans increase their spending to match Americans, this will be a major driver for the industry (but it’s not something
we’re counting on yet).
Global Pet Care Spending Pet Care Spending, Per Household
Annual growth, from 2010-14 2022 estimates from Euromonitor
Source: Fung Global Retail & Technology, Euromonitor State of Global Pet Care 2017
Fred Liu, CFA | 646-883-8805 | fred.liu@haydencapital.com 20Zooplus Taking A Larger Piece
E-commerce is taking share in the overall industry, and Zooplus is taking share within E-commerce.
Over the last five years Zooplus has grown at 28% y/y. This surpasses Pet Care E-Commerce’s growth of 15% y/y, and
the overall industry growth rate of 2-3%.
Zooplus is already the largest online pet supplies retailer in Europe, at 50% market share.
It’s going to surpass Pets at Home’s this year, making it the 2nd largest retailer overall.
We estimate Zooplus will surpass Fressnapf within the next 3 years, making it the largest retailer in Europe.
Zooplus Market Position vs. Competitors Zooplus Revenues
Industry players, as of 2016 € in millions
€ 1,165
€ 952
€ 743
€ 571
€ 427
€ 336
€ 257
€ 194
2010 2011 2012 2013 2014 2015 2016 2017E
Fred Liu, CFA | 646-883-8805 | fred.liu@haydencapital.com 21The Big, Bad, Amazon
It would be very naïve to ignore Amazon, when investing in an e-commerce company.
However, Amazon so far hasn’t been able to gain significant share in the pets space.
Chewy.com in the US is the best example of this.
Both Chewy and Amazon entered the pets space around the same time (2011), and Chewy has gained 50% share in
the US, and is set to grow 100% this year. We believe Amazon will likely target the US market first, and Chewy is a
good “canary in the coal mine”, which we’re watching closely.
Meanwhile, Amazon only has ~€350M in pets sales in its European markets or ~30% the size of Zooplus.
This is the same relative scale as 2014, when Amazon did ~€200M and Zooplus did €570M.
We believe there’s scale advantages to being the biggest, with an logistics system optimized for “heavy & bulky” packages.
Amazon’s International Sales - Pet Products Zooplus Sales By Country (2016)
Revenues for Q3 2016 – Q3 2017, from One Click Retail Sales and market share, for 2016
Fred Liu, CFA | 646-883-8805 | fred.liu@haydencapital.com 22Winning Customers’ ♡
For a commoditized, repeat purchase like Pet Food (80% of sales), what matters is low prices and convenience (i.e. quick
shipping).
This isn’t fashion, where you’ll spend hours joyfully browsing for that new handbag, and want a good “discovery”
experience (like shopping for entertainment in a mall).
For pet food, customers want to go from product page to check out as quick as possible.
We scraped the prices of 50 leading products on Zooplus, vs. competitors. Zooplus is 3% - 15% cheaper than competitors.
Even 3% - 8% cheaper on average than it’s most formidable competitor, Amazon.
This doesn’t even include Zooplus’ Savings Plan (pay €3 to get an extra 3% off for a year).
We can see evidence of customer satisfaction by teasing out the company’s order metrics.
Customers are ordering more frequently per year, from 2.5x in 2012 to 3.6x in 2017 (44% increase).
This will likely go up further, as subscription takes off (discussed later).
Customer Order Metrics Zooplus Prices vs. Competitors
# of orders per customer per year Prices as of Sept. 30, 2017; GR-UK-FR are AMZN’s top 3 markets
€ 58.0 Germany United Kingdom France
4.2
€ 56.0 AMZN Fressnapf AMZN Pets at Home AMZN
4.0
3.8 € 54.0
3.6
€ 52.0
3.4
€ 50.0 (3.2)%
3.2
3.0 (4.5)%
€ 48.0
2.9
€ 46.0 (6.8)%
2.6 (7.5)%
2.5 2.5
€ 44.0
€ 42.0
€ 40.0
2010 2011 2012 2013 2014 2015 2016 2017E 2018E 2019E 2020E
(15.6)%
Number of Orders Per Customer Basket Size Per Order (€)
Fred Liu, CFA | 646-883-8805 | fred.liu@haydencapital.com 23Customer Acquisition ROIC
One of the best uses of capital is acquiring customers (marketing, new customer promos, etc.)
We estimate it costs ~€5.20 to acquire a new customer. If they turn into a repeat customer, Zooplus makes its customer
acquisition cost (“CAC”) back after 1.5 years.
Blended, we estimate Zooplus makes a 30% IRR on customer acquisition spend.
Note: We have heard Chewy.com also has a 1.5 year payback on new customers. This implies the industry dynamics, and
consumer spending habits are similar across geographies.
However, since Americans spend 2x as much on their pets, Chewy can afford to spend more (in absolute terms) on
acquiring customers vs. Zooplus.
Returning Customer Value
Year 1 2 3 4 5 6 7 8 9 10
Retention Ra te 100.0% 79.0% 81.0% 89.1% 91.2% 92.3% 91.8% 92.2% 92.5% 95.8%
Sa l es per Acti ve Account € 166 € 254 € 264 € 262 € 268 € 283 € 308 € 321 € 334 € 358
x EBT Ma rgin (2.5)% 3.5% 3.5% 3.5% 3.5% 3.5% 3.5% 3.5% 3.5% 3.5%
= Op Income per Acti ve Acct (€ 4.2) € 8.9 € 9.2 € 9.2 € 9.4 € 9.9 € 10.8 € 11.2 € 11.7 € 12.5
x Ta x Ra te 36.2% 36.2% 36.2% 36.2% 36.2% 36.2% 36.2% 36.2% 36.2% 36.2%
= Profi t per Acti ve Acct (€ 2.6) € 5.7 € 5.9 € 5.8 € 6.0 € 6.3 € 6.9 € 7.2 € 7.4 € 8.0
memo: Remaining Accounts 100.0% 79.0% 64.0% 57.0% 52.0% 48.0% 44.0% 40.6% 37.6% 36.0%
memo: Wgt. Yearly Sales per Acct Created € 166 € 201 € 169 € 149 € 139 € 136 € 135 € 130 € 125 € 129
memo: Wgt. Yearly Op Income per Acct Created (€ 4.15) € 7.02 € 5.91 € 5.23 € 4.88 € 4.75 € 4.74 € 4.56 € 4.39 € 4.51
memo: Wgt. Yearly Profit per Acct Created (€ 2.65) € 4.48 € 3.77 € 3.33 € 3.11 € 3.03 € 3.02 € 2.91 € 2.80 € 2.88
memo: Cummulative Sales Per Acct Created € 166 € 367 € 536 € 685 € 824 € 960 € 1,096 € 1,226 € 1,351 € 1,480
memo: Cummulative Op. Income Per Acct Created (€ 4.15) € 2.87 € 8.79 € 14.01 € 18.89 € 23.65 € 28.39 € 32.94 € 37.33 € 41.84
memo: Cummulative Profit Per Acct Created (€ 2.65) € 1.83 € 5.60 € 8.94 € 12.05 € 15.08 € 18.10 € 21.01 € 23.81 € 26.68
Blended Customer IRR
Year 1 2 3 4 5 6 7 8 9 10
Operating Income
One‐time Cus tomer (Exp Va l ue) (€ 5.19) € 0.00 € 0.00 € 0.00 € 0.00 € 0.00 € 0.00 € 0.00 € 0.00 € 0.00
+ Returni ng Cus tomer (Exp Va l ue) (€ 1.70) € 2.88 € 2.42 € 2.14 € 2.00 € 1.95 € 1.94 € 1.87 € 1.80 € 1.85
= Wgt. Opera ti ng Income (€ 6.89) € 2.88 € 2.42 € 2.14 € 2.00 € 1.95 € 1.94 € 1.87 € 1.80 € 1.85
Net Profit
One‐time Cus tomer (Exp Va l ue) (€ 3.31) € 0.00 € 0.00 € 0.00 € 0.00 € 0.00 € 0.00 € 0.00 € 0.00 € 0.00
+ Returni ng Cus tomer (Exp Va l ue) (€ 1.09) € 1.84 € 1.55 € 1.37 € 1.28 € 1.24 € 1.24 € 1.19 € 1.15 € 1.18
= Wgt. Net Profi t (€ 4.40) € 1.84 € 1.55 € 1.37 € 1.28 € 1.24 € 1.24 € 1.19 € 1.15 € 1.18
Customer Acquisition IRR Calc.
Blended Customer IRR 30.3%
Returning Customer IRR 155.6%
Fred Liu, CFA | 646-883-8805 | fred.liu@haydencapital.com 24Hiring More Nerds, I Mean… Software Developers
Zooplus announced it’s hiring 60 more software developers, increasing the headcount from 90 to 150 (+67% increase).
If assume average of €150K per developer, this is €9M more in operating costs.
There are ~6M active customers today (vs. 4.83M in Q4 2016). At a 4% return customer margin, we just need each
existing customer to spend €38 more per year (€1.50 in profit) to justify this cost.
But this doesn’t include accelerating new customer growth, or raising the retention rate due to these new features /
initiatives. These factors would make the return even better.
New customer growth has already accelerated to 34% y/y last quarter, after increasing its CAC and lowering prices.
Launching new features and improving the customer experience will accelerate this further.
New Customer Growth Meet Zooplus’ New Hires
Q3 2017 Earnings Presentation Team photo
Fred Liu, CFA | 646-883-8805 | fred.liu@haydencapital.com 25Subscription Economics
Subscription is a newly announced feature – to be rolled out in Germany first, and then across other European markets.
For a product that’s a “chore” to shop for (unlike the joy of shopping for a Chanel purse, for example), automating the purchase
process adds a lot of value for customers.
Financially, increasing the retention rate and increasing the order frequency is very attractive.
For example, we estimate simply increasing the order frequency by 0.5x per customer per year will increase sales by €157
million (13% of 2017E sales). Currently, active customers only order ~3.5x per year.
At a 9.9% contribution margin (disclosed by the company last quarter), this would equate to roughly €16M in additional
profits.
For comparison, we’ve heard ~50% of Chewy’s orders are from subscription. On top of this, their customer Lifetime Value is
~$1,200. Zooplus’ customer LTV is ~€1,500, despite pet care spending being 50% lower than the US.
Customer Lifetime Value New Subscription Feature
2005-15 Cohort Currently in Germany only, with plans to roll-out to other countries soon
Fred Liu, CFA | 646-883-8805 | fred.liu@haydencapital.com 26Improving The Mobile Experience
Zooplus still has some work to do on the mobile-front, especially when compared to it’s US-rival Chewy. This is crucial, as
consumers increasingly move to a mobile-first experience.
Many complaints about the app crashing, incorrect translations / languages, etc.
Today, most customers are women, between ages 30 – 40, shopping from a desktop, at work. In order to reach a broader (and
younger) audience, Zooplus needs to improve it’s mobile application.
Doing so not only helps with attracting new customers, but also reducing churn.
It should also increase order frequency, since mobile shopping tends to be more impulsive and used as a “shopping list”
(i.e. “We just ran out of dog treats – I’ll add it to the cart now on my phone”).
Although we don’t have hard metrics yet, simple sensitivity analyses show that even a slight improvements in retention, order
frequency, or new customer growth will have great returns.
This is especially true given the relatively low cost of hiring more developers.
Chewy’s App (4.8 Rating) Zooplus’ App (3.6 Rating)
Google Play Store Google Play Store
Fred Liu, CFA | 646-883-8805 | fred.liu@haydencapital.com 27Proof of The Market’s Short-term Nature
Our Take:
On September 15, 2017, the company announced it was lowering the full year earnings guidance by ~€10M - €20M, to invest
more into the aforementioned projects.
Although we’re still gathering hard data / KPIs around these recent projects, it’s hard to see them as value-destructive.
Investors simply need to ask “Is this project a waste of money? Or is it adding value to customers, and will encourage them to
spend more (than the project costs)?”
However the market had different thoughts…
Market’s Reaction:
The stock was down ~22% the day of the announcement, and ended down 20% over the subsequent month (indicating the
market hadn’t digested the news / believe the projects were value-adding even a month later).
Obviously, we think they’re misunderstanding it. There’s an informational + analytical advantage here over the next 6 – 12
months, before the benefits from these initiatives start showing up in the financials.
Zooplus Stock Price After Announcement
August 15, 2017 – October 15, 2017
Fred Liu, CFA | 646-883-8805 | fred.liu@haydencapital.com 28So What’s It Worth?
Intrinsic Value Growth:
Over the next five years, we’re expecting revenues & earnings power to grow at 19% y/y (driven by the aforementioned projects,
price investments, logistics, etc.) and the stock price to compound at a similar rate. Over time, the company should be able to
achieve operating margins in the mid-to-high single digits (in-line with other global e-commerce companies). At a multiple of
0.9x sales or 13x normalized EBIT, we think this is a cheap-to-fair price to pay for such a company, with this growth potential.
For comparison, many traditional Brick & Mortar companies are still trading at 0.5x sales, with similar or lower margins,
and only GDP+ type growth.
At the current growth rate, we only need to get the next three years right, while getting growth in the subsequent years for
“free”. The tailwind / shift to online is alone very strong, and it’s very likely growth will last much longer than 3 years.
For example, if the subscription feature can achieve my (admittedly rough) estimates, the company would make €16M on a €9M
cost (developer salaries), for a 78% return on investment.
Even if the order frequency is lower than expected, it’s still a very attractive investment.
Public Comps: Zooplus vs. Chewy Valuation
Chewy.com was recently bought at a $3.35BN valuation. Chewy estimates from Recode.com & private conversations with those familiar
Admittedly, the company is growing faster than Zooplus, 3.7x
2016 Sales
1.9x
2017E Sales
>110% Implied Upside
vs. Chewy.com
but faces a more imminent Amazon threat. $ 3,350 Valuation
Even adjusting for growth, the purchase price was still 2x 1.1x 0.9x
that of Zooplus’ current valuation. 2016 Sales 2017E Sales
$ 1,800
€ 1,165
For The Full Thesis, Please See Our Zooplus Write-up $ 900
€ 1,081 € 952
Online:
http://www.haydencapital.com/investor-letters
Valuation Sales '16 Sales '17E Valuation Sales '16 Sales '17E
(EV) (EV)
Chewy Zooplus
Fred Liu, CFA | 646-883-8805 | fred.liu@haydencapital.com 29Remember… Trust, BUT Verify
Everyone’s allocating capital.
Clients give money to fund managers.
Fund managers give capital to Companies & the management teams.
Management teams invest capital into new projects with (hopefully) high returns.
We’re not going to calculate the exact ROIC or earning growth % the company will achieve next year.
Even if the information were knowable and public, there’s not enough time in the day to calculate every single project a
company embarks on (think Amazon).
We’re simply trying to get 80% of the way there. For the most part, this is a “sanity-check”.
The goal is to evaluate if management is someone we want to partner with & that the strategy makes sense.
Out of 100 different projects, we may evaluate the top 5 - 10 of them.
If these 5 - 10 projects are all proven to be attractive, 25% ROIC projects, then that gives us more confidence that
management is smart, and thinking about capital allocation in the right way.
On the other hand, if our analysis starts showing all these projects to be 2% earners, RUN AWAY!
Fred Liu, CFA | 646-883-8805 | fred.liu@haydencapital.com 30Contact Information
For More Information
Contact Us:
Fred Liu
Managing Partner
Hayden Capital
79 Madison Ave, 3rd Floor
New York, NY. 10016
Office: (646) 883-8805
Mobile: (513) 304-3313
Email: fred.liu@haydencapital.com
Fred Liu, CFA | 646-883-8805 | fred.liu@haydencapital.com 31You can also read