Corporate Management: A Comparison of Chinese & Indian IT Firms Perceived Equity
←
→
Page content transcription
If your browser does not render page correctly, please read the page content below

Global Journal of Management and Business Research: A
 Administration and Management
 Volume 21 Issue 4 Version 1.0 Year 2021
 Type: Double Blind Peer Reviewed International Research Journal
 Publisher: Global Journals
 Online ISSN: 2249-4588 & Print ISSN: 0975-5853

Corporate Management: A Comparison of Chinese & Indian IT
Firms Perceived Equity
 By Hu Haibin
 Limkokwing University
 Abstract- Digitalization has increased awareness of the students. Access of Clients to the data
and information has also improved in the era of transformative marketing. Because of these
developments, Corporate Management of every firm is always struggling to differentiate
themselves from revelries. Two neighbors in Asia China and India are continually positioning
themselves in the market to show themselves as leaders in corporate world. Corporate
Managements are continually looking for a competitive edge. In this study based on Aker and
Keller Customer Based brand equity model the authors have designed on a survey and got
responses of 111 China and 86 Indian Finance students regarding IT sector corporate
management. After data collection and Analysis using structure equation modelling, the frame
work was validated. The paper concludes that Perceived quality and image are the most
important variables in brand equity.
Keywords: corporate brand equity, brand awareness, brand loyalty, perceived quality, china &
india.
GJMBR-A Classification: JE L Code: M10

CorporateManagementAComparisonofChineseIndianITFirmsPerceivedEquity
 Strictly as per the compliance and regulations of:

© 2021. Hu Haibin. This is a research/review paper, distributed under the terms of the Creative Commons Attribution-
Noncommercial 3.0 Unported License http://creativecommons.org/licenses/by-nc/3.0/), permitting all non-commercial use,
distribution, and reproduction in any medium, provided the original work is properly cited.
Corporate Management: A Comparison of
 Chinese & Indian IT Firms Perceived Equity
 Hu Haibin

Abstract- Digitalization has increased awareness of the 2019; Farooq & Raju, 2019b; Kumar, 2018; Meyer,
students. Access of Clients to the data and information has 2018; Varadarajan, 2018).
also improved in the era of transformative marketing. Because Before digitalization Corporate Management
of these developments, Corporate Management of every firm and business were considered two different activities, in
is always struggling to differentiate themselves from revelries.
 literature, most of the content on Client equity is

 2021
Two neighbors in Asia China and India are continually
positioning themselves in the market to show themselves as considered contrary to the Corporate Management.
 However, there are many similarities between Corporate

 Year
leaders in corporate world. Corporate Managements are
continually looking for a competitive edge. In this study based Management and Brand Equity. Goal of any business is
on Aker and Keller Customer Based brand equity model the to identify the needs and wants in any market, design
 1
authors have designed on a survey and got responses of 111 and manufacture products as per the needs of the
China and 86 Indian Finance students regarding IT sector market, distribute and make sure the availability of the

 Global Journal of Management and Business Research ( A ) Volume XXI Issue IV Version I
corporate management. After data collection and Analysis products in the market, convince customers that his
using structure equation modelling, the frame work was product or service is good compared to the existing
validated. The paper concludes that Perceived quality and
 products and services and make sure his products are
image are the most important variables in brand equity. The
firms brand awareness has the least impact on brand equity. selling and he is making profit. Similarly, in Corporate
Through independent sample t-test, this paper has also Management, the Corporate Management of every firm
compared both countries Corporate Management. The always concerned about the needs and want of the
research paper concludes that Perceived quality of China is Firm. Keeping in view the needs and wants of the Firm,
better than India while Loyalty of Indian firms’ management is the Corporate Management design their manifesto, they
better than China. This research paper is useful for Corporate make sure their availability and awareness in every place
Management of every firm to improve their brand equity. The where there is a potential Client and are also striving to
study can also help the Corporate Management of every firm differentiate themselves and make themselves better
to focus on the factors which matter to the progress of most.
 choice compared to its rivalry (Burt, 2011).
Keywords: corporate brand equity, brand awareness,
 Despite having so much similarity between
brand loyalty, perceived quality, china & india.
 Corporate Management and business on the foundation
 I. Introduction level, there are very few studies (French & Smith, 2010)
 conducted on political Corporate Management. Most of

B
 randing is all about differentiation. A symbol, the studies in Corporate Management is conducted on
 name, logo, tagline, values, product and services political marketing, role of Corporate Management in
 can differentiate one company from another economics and economic growth of the countries, and
company (Evans, 2017; Liu, Wong, Shi, Chu, & Brock, political marketing strategies, however, these studies
2014; Petburikul, 2009; Ponnam & Krishnatray, 2008; discussed Corporate Management as a separate
Rajasekar & Nalina, 2008). The evolution in digitalization phenomenon compared to business (Andrei, 2018;
has transformed all walks of life (Farooq, Muhammad, Development, n.d.; French & Smith, 2010; Rutter,
Raju, Kalimuthu, & Qadir, 2019; Farooq & Raju, 2019a). Hanretty, & Lettice, 2018; Urien, 2012). This research
This transformation in the digital world has increased the paper aims to fulfill the gap between political and
importance of brand and quality of services (Buzdar et businesses on a brand level. The main hypothesis of
al., 2016; Farooq, 2018). Digitalization has empowered this study is that Corporate Management of every firm is
customers; It has increased the role of word of mouth in also just like brands. In earlier studies, the authors
the success of every brand (Farooq & Jabbar, 2014). mainly focused on creating the model for citizen-based
Beside business word of mouth also impacted the brand equity and Client-based brand equity in which
Corporate Management. Digital revolution has business is shown as a separate phenomenon, but as
empowered the end users, which led to era of per the goal of this study, the customer based brand
transformative marketing, In era of transformative equity of Aaker will be validated. (D. A. Aaker, 2009; J.
marketing the research should reevaluate and validate L. Aaker, 1997).
existing concepts (Farooq, Khalil-Ur-Rehman, et al.,

Author: Dept. of Management, Limkokwing University of Creative
Technology. e-mail: huhaibin320@gmail.com

 © 20 21 Global Journals
Corporate Management: A Comparison of Chinese & Indian IT Firms Perceived Equity

 II. Literature Review In Customer-Based Brand Equity Model of
 Aaker (1996) the second variable is Brand Image. Brand
 a) Political Brand Equity image is one of the oldest variables in branding. It
 Two things are essential for very important for covers the Chinese Corporate Management of the brand
 any business. One of the customers and the second is in the minds of customers. As per Aaker, it covers the
 the brand. The brand is the identification of the business reason why customers can buy a brand. The most
 which differentiates the company from the other prominent question in brand image is the ‘History of the
 companies in its area (Kumar et al., 2010; Lilien et al., brand’ or clean image of the brand. The concept of
 2010; Manoj, Jitendra, & Naithani, 2016). After unique brand equity was introduced in the 1990s. In that era,
 identification, the essential aspect of the brand is the concept of green marketing was introduced.
 measuring and tracking the brand value which is most Therefore, in previous studies the aspects of brand
 often the name is brand equity. Higher brand equity, image which is covered in the literature is the social
 better the company performance (Farooq, Janjua, & responsibility aspect of the brand in several studies (Abu
 2021

 Khurshid, 2016). Brand equity has two types. One is the ELSamen, 2015; Ashraf, Ilyas, Imtiaz, & Ahmad, 2018;
 commercial brand equity of the company, and the other Chen & Tseng, 2010; Farooq et al., 2016; Kakati &
 Year

 one is the customer-based brand equity. The customer- Choudhury, 2013; Ruževiči ūtė & Ruževičius, 2010; Seo
 based brand equity is of the prominent brand equity & Park, 2018; Sirapracha & Tocquer, 2012; Svendsen &
 2 models being used since the 1990s. The customer- Prebensen, 2013; Yuwo, Ford, & Purwanegara, 2013).
 based brand equity model was first given by David In Customer-Based Brand Equity Model of
Global Journal of Management and Business Research ( A ) Volume XXI Issue IV Version I

 Aaker on which letter on prominent scholars like Keller Aaker (1996) the third variable is Perceived Quality.
 also worked and improved this model. The most Perceived quality has the highest impact in most the
 prominent and well known model which is adapted in studies on customer band brand equity (Jamal Abad,
 many studies over the year and has been valued as Hossein, Abad, & Hossein, 2013; Priluck & Till, 2010;
 most effective model is Customer-Based Brand Equity Ramaiyah & Ahmad, H. et al., 2010). Perceived quality
 (CBBE) model (Chen & Tseng, 2010; Farooq & Jabbar, covers the credibility of the brand and trust of the
 2014; Huang & Shih, 2017; Keller, 2001; Sirianni, Bitner, customers on the brand. The fourth variable is brand
 Brown, & Mandel, 2013; Van Birgelen, De Ruyter, De loyalty. Brand loyalty is the most widely studied concept
 Jong, & Wetzels, 2002). in marketing literature. It covers the intention of the
 As Aaker (1996) the customer-based brand customers to stay with any company or switch the
 equity model has mainly four components. Combination company. Brand loyalty also includes the intention of the
 of these points makes the customer-based brand equity customers to stay in case of an increase in prices. The
 of the company. The component of customer-based reason behind measuring this aspect is that there is a
 brand equity is brand Awareness, brand image, possibility that the customers are sticking with a brand
 perceived quality and Brand loyalty. Brand awareness is because of its pricing. The perceived quality of the
 the extent to which the customers are aware of the brand covers the Corporate Management quality. Based
 brand. It has a further three components. The first on the literature the figure-1 one shows the model of this
 component is the top of mind question. Its methodology study.
 is unique. This top of mind question and measured is
 also used as the company performance factor in most
 of the companies (Aaker, Kumar, Day, 2009). In brand
 awareness, one question is asked from the customers,
 which is “When you think about the industry, which
 companies in that industry first comes in your mind.”
 The company which customers tell the researcher is
 marked as top of mind brand. This top of mind brand is
 also called an Unaided factor of awareness. For
 measurement of brand awareness, the second question
 is asked from the customers to list the companies which
 come in customers mind after the top of mind brands. If
 one author is studying more than 3 brands, he can also
 add the aided part of the awareness which is giving
 customers the list of the brand or ask him, you did not
 mention the one brand in the first question of top of
 mind and in the second question of listing the brand, do
 you know this brand? The respondent can answer the
 “yes” and know, and that company gets the least score
 in the awareness.

 © 20 21 Global Journals
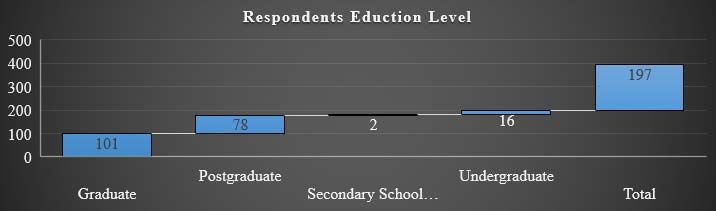
Corporate Management: A Comparison of Chinese & Indian IT Firms Perceived Equity

 Brand Awareness

 Brand Image Brand Equity

 Brand Loyalty

 Perceived Quality

 Figure 1: Theoretical Framework of the study

 III. Research Methodology not contesting from that area or they had personal

 2021
 dislikes on the electable level. As this is a quantitative
 Using G power sample extraction formula with study, the next section explains the data collection and
the impact 0.15, the total required sample for the study

 Year
 analysis method.
was 120. A questionnaire was designed online on a
google document, and through the referral system, it IV. Data Collection and Analysis
was requested to the firm’s members to fill the survey. 3
 With referral sampling or snowball sampling
With snowball sampling technique total of 111 CHINA

 Global Journal of Management and Business Research ( A ) Volume XXI Issue IV Version I
 total, 203 responses were collected. Out 203 only five
samples data was collected and 85 samples were
 responses were discarded in the screening phase. Total
collected from INDIA. The questionnaire which was used
 56% of respondents of the study are the CHINA
in this study was adapted from Aaker (1996) model. The
 supports while 44% of respondents responded as Indian
questionnaire started with screening question from the
 Client and supporter. In total there were 197
respondents about the firms they support and the firms
 respondents out of which 125 respondents were male,
they voted in 2018. All those questionnaires were both
 and 72 respondents were female. In age bracket, there
supported and voted Management answers bedefinite
 are 89 respondents were 18 to 25, Second respondents
are kept in the final analysis. The reason behind the
 were 93, and third age bracket was 15 respondents.
exclusion of the Client can be their own electable
 Regarding education 101 respondents were graduates,
personality. There were 5 sample questions which were
 78 were postgraduates, 16 respondents were
excluded where respondents were supporting the
 undergraduates, and two are secondary school level
different Management and voted a different
 educated.
Management because their favorite Management was

 © 20 21 Global Journals
Corporate Management: A Comparison of Chinese & Indian IT Firms Perceived Equity
 2021

 Table 1: Construct Validity and Reliability
 Year

 Outer Cronbach's
 4 Constructs Items R2 F2
 Loadings Alpha
 Corporate 1. Top of Mind Brand 0.90
Global Journal of Management and Business Research ( A ) Volume XXI Issue IV Version I

 Management 0.67 -0.22
 Awareness 2. Second Name Management 0.73

 1. Easily Approachable Leaders 0.87
 2. Trustworthy Leaders 0.81
 Corporate
 3. Honest Leaders 0.84
 Management 0.82 0.27
 Perceived Quality 4. Management Leaders fulfill their
 0.87
 promises
 5. Management leaders are aware of
 0.77
 country issues
 1. Management Organize events for
 0.86
 Student
 2. Management Represent my values 0.90

 The firms Image 3. Management Has a clean image 0.89 0.88 0.53
 4. Kind Leaders and workers 9.82
 5. All people around me support this
 0.87
 Management
 1. As a Client, this Management is my
 0.76
 first choice
 The firms Loyalty 2. I am satisfied with their work 0.83 0.85 0.71 0.23

 3. I will recommend to others 0.91

 In data analysis, the researchers used internal consistency (Cronbach Alpha) are also above
 numerous statistical tools. Microsoft collected data the required threshold.
 sheet was further analyzed to filter the responses based Table-2 also contains Coefficient of
 on screening questions. After filtration of responses, the determination (R2) values. The R2 value shows the
 researchers have used the smart P is to validate the impact of independent variables on the dependent
 model results. Smart PLS 2 was used to perform SEM. variable. The combined effect of in depended variables
 Construct Validity and Reliability were tested before of this study (The firm’s awareness, The Corporate
 proceeding to analysis and drawing any conclusions Management Perceived Quality, The Corporate
 based on data. Table-2 shows the detailed Structure Management Image, and The Corporate Management
 Equation Model first assessing phase key results. To Loyalty) is 71% on dependent variables. This model
 test the validity of data first number outer loadings measures 71%% of brand equity components with a
 against each item as shown in figures are validated and confidence of 95%. After making sure, the model is fit
 are above the required threshold of 0.7. Values of through all aspects, construct reliability, validity all

 © 20 21 Global Journals
Corporate Management: A Comparison of Chinese & Indian IT Firms Perceived Equity

parameters are as per thresholds the bootstraCMIng Managment, but at the same, the relationship is not
technique was aCMLied to the model to test the statistically significant. Besides the core relationship
hypothesis. It has been concluded that there all between the The firmspolitical equity factors and the
independent variables have a significant positive direct overall The firmsscore, the role of the factors is
impact on brand equity except brand awareness. It can significant. All political equity, The Corporate
be observed from the bootstraCMIng BootstraCMIng Managment Image, The Corporate Managment
results that there is a significant relationship between Perceived Quality and The Corporate Managment
The firmsbrand equity variables and dependent variable Loyalty items has a significant relationship with political
The firmsequity. The most significant positive equity.
relationship is between the The Corporate Managment
 a) Equity of Corporate Management
Image and The firmsequity. The t-score between The
 Brand Equity is the equity of a brand in the
Corporate Managment Image and The firmsequity is
 minds of customers. Political equity is the equity of firms
7.140 which is above the threshold of 1.96 required

 2021
 in the minds of its supporters and Student. The political
score of t-test to validate the relationship. The second
 equity of the two Corporate Management of every Firm
most important relationship between the The firmsequity

 Year
 studied in this paper. The total The Corporate
is the relationship between The Corporate Managment
 Management Equity (CME) of both Corporate
Perceived Quality and political equity. The Corporate
 Managements has been concluded after combining 5
Managment Loyaltyalso has a significant positive
 score of Corporate Management Awareness (CMA),
relationship with equity. The only factor which does have

 Global Journal of Management and Business Research ( A ) Volume XXI Issue IV Version I
 Corporate Management Perceived Quality (CMPQ),
a significant relationship with the political equity the
 Corporate Management Image (CMI)and Corporate
political awareness. The impact of awareness with
 Management Loyalty (CML).
equity is also negative. It means if customers get more
aware, it will impact on the equity of the political
 ∑ ∑ ∑ ∑
 ( ) = {� �+� �+� �+� �}
 n n n n
 As per the equation, the political equity of both factors relationship. Its impact is the highest. The last
Corporate Management of every firm has been variable is The Corporate Management Loyalty. It is the
calculated. The CHINA has higher equity (16.33) only component of the firm’s equity where INDIA has
compared to INDIA. The area in which CHINA is more outnumbered the CHINA. The Student of INDIA is more
popular and has a better score is Awareness. The loyal compared to CHINA. INDIAsupporters intend to
Student of CHINA feels they are more aware. It has been stay with this Management even when they are not in
observed in data that the top of mind brand of many power. The impact of loyalty on the overall score is very
INDIA supporters is also CHINA. For the second less. Also, the difference between the loyalty of INDIA
question, the other Corporate Management which and CHINA supporters score is very less. There is only
Student could remember beside the top of mind 100% 0.01 points difference which negligible. Safely it can be
CHINA supporter’s second company name is INDIA said that the score of the loyalty of both Corporate
while for INDIA supporters only 60% recalled the second Management of every firms almost equal. Equally, the
The firms CHINA, 40% of INDIA Student on second score make less impact on the differentiation of the
named the PPP. The reason behind this can be several Corporate Management. Regarding having the highest
years of competition between PPP and INDIA. While score, The Corporate Management Loyalty has the
CHINA is a new Management mainly competing with highest score. It also means both Management
INDIA and CHINA leaders mainly criticizes the INDIA members will stay loyal with each other and there can
leaders. For The Corporate Management Perceived be a long-term rivalry between these two Corporate
Quality the CHINA has also out numbered the INDIA. Management
However, the difference in perceived quality is minimal.
There is a vast difference in the political brand image of b) Differences between Political Corporate
the Corporate Management. The CHINA supporters feel Management
that their Management is cleaner, socially responsible In the first variable, there are considerable
and leaders are not corrupt while in the mind of INDIA differences in means score of the top of mind political
supporters there is slight less trust and perceived quality Management. The CHINA is the top of mind It is very
in the minds of the supporters. This aspect of Political different between the top of mind of CHINA and INDIA.
Brand Image has been explained in detail in the The CHINA awareness is very high, even the votes of
Independent sample t-test while explaining this PMNL when asked to remember the first the firms which
Corporate Management in detail. The image of the comes in your mind when you think about Corporate
Management is one of the critical variables as seen in Management said that the first Management which
the relationship between brand equity and the other comes in our mind is the CHINA. For the second the

 © 20 21 Global Journals
Corporate Management: A Comparison of Chinese & Indian IT Firms Perceived Equity firms does not matter what is the first the firms always and awareness about the firms issues the CHINA has the INDIA is the second the firms in the minds of outnumbered the INDIA. In Corporate Management of Student. every firm loyal, there is insignificant very less difference The second variable is The Corporate between the loyalty of CHINA and INDIA members. The Management Image. Image is the factor which impacts loyalty of the members is the only area where both the most on the firm’s equity. In the Management Corporate Management can be called equal among represent my values and clean image the CHINA has supporters. However, keeping in view the image some outnumbered the INDIA. The third factor is perceived Student can shift from INDIA to CHINA. quality, in perceived quality, the trustworthy, honesty Table 2: Difference between Corporate Management of every firm Independent Sample t-test Independent Sample t-test results 2021 Means Difference between CHINA and INDIA Reporters Year CHINA n=111 INDIAn=86 Variable (Corporate Management Awareness) t-test M SD M SD 6 1. Top of Mind CM 4.6 1.1 2.3 1.7 11.5 Global Journal of Management and Business Research ( A ) Volume XXI Issue IV Version I 2. Second Name Management 2.4 1.6 4.9 0.4 -15.9 CHINA n=111 INDIAn=86 Variable (The Corporate Management Image) t-test M SD M SD 1. Management Organize events for Student 3.7 1.1 3.7 0.9 0.1 2. Management Represent my values 4.2 0.9 3.9 1.1 2.1 3. Management Has a clean image 4.3 0.8 3.5 1.2 5.7 4. Kind Leaders and workers 4.1 1.0 3.9 1.2 0.7 5. All people around me support this Management 4.4 0.9 4.1 1.2 1.9 CHINA n=111 INDIAn=86 Variable (The Corporate Management Perceived t-test Quality ) M SD M SD 1. Easily Approachable Leaders 3.2 1.2 3.2 1.3 1.3 2. Trustworthy Leaders 3.8 1.1 3.6 1.0 1.2 3. Honest Leaders 3.7 1.2 3.5 1.0 1.1 4. Management Leaders fulfill their promises 4.2 1.0 4.0 1.2 1.6 5. Management leaders are aware of country issues 3.9 1.1 3.6 1.3 1.6 CHINAn=111 INDIAn=111 Variable (The Corporate Management Loyalty) t-test M SD M SD 1. As a Client, this Management is my first choice 4.5 0.8 4.6 0.6 -0.8 2. I am satisfied with their work 4.4 0.8 4.2 1.1 1.1 3. I will recommend to others 4.4 1.0 4.4 0.9 2.1 V. Conclusion and Discussions CHINA is the most popular Management across Top asian countries compared to the rest of the Corporate Based on all secondary data, starting from the Management. The CHINA has got votes from every number of Corporate Management of every firm in Top corner of Top Asian countries. Among four provinces the Asian countries,, total Corporate Management who CHINA has got not only significant seats but also a could secure any position in the 2018 elections, a total remarkable symbolic success of earning the prestige to number of elected parliamentarians in all national, represent the federation. The CHINA has admired the provincial and senate assembly it is evident that the second most popular Management in Punjab with a very © 20 21 Global Journals
Corporate Management: A Comparison of Chinese & Indian IT Firms Perceived Equity

slight difference from leading Management INDIA; In introduction of formula and way in which the firm’s
Sindh, it has emerged as the second largest equity can be measured. The researchers around the
Management, In KPK it has outnumbered all the political globe can use this formula and questionnaire to
Corporate Management. In Baluchistan among measure the political equity of the Corporate
mainstream Corporate Management the except CHINA, Management in the eyes of their votes.
no other Management could gain any seats. These are For managers and political Corporate
the results of the election. Based on election and Media Management, this research paper carries significant
availability these two Corporate Management were guidelines. The first aspect is the image of the
selected as the sample of study to research about Management; the image is important than loyalty,
political equity of the political Corporate Management. quality, and awareness. So, when doing awareness, the
Our research on two companies and responses of 197 Corporate Management must be careful what message
Student of these Corporate Management has also they are delivering. In the context of Top Asian countries,
concluded that CHINA has better political equity it has been observed in the last 4 years that CHINA

 2021
compared to the INDIA. The core area where CHINA has criticized the INDIA government, which resulted in
a better score is the Corporate Management Image and CHINA awareness. The awareness of CHINA has

 Year
The Corporate Management Perceived Quality. The firm increased so much that INDIA supporters and Student
Brand Image means that the Management cares about top of mind the firms is CHINA. The critical component
its Client and it has a clean image. In these two aspects, image of CHINA has improved because of Criticism on 7
CHINA has better score compared to the INDIA. For the INDIA; in response INDIA team instead of criticizing

 Global Journal of Management and Business Research ( A ) Volume XXI Issue IV Version I
perceived quality two factors are mainly important which CHINA spent time on responding to CHINA which
caused the difference between CHINA and INDIA. The resulted again in the bad image of INDIA. For both
CHINA has better score regardingtrustworthiness and political Corporate Management, the image should be
honesty. The assertiveness among the Student and the main concern. Corporate Management must be
trust of Student also cause loyalty among the Student. careful while adding bad image leaders; it can impact
The image and perceived quality are the factors which in on total equity of the Management. For INDIA manager
the future can result in the loyalty of the Student. sit’s recommended to exclude the dishonest and
 The most impacting variable on the firm’s equity corrupt person leaders, this can increase the political
is the image and perceived quality. CHINA has already equity of the Management. CHINA is already the most
an excellent image in the eyes of its customers. The popular, honest, trustworthy political brand in Top Asian
Management members of CHINA must sustain its countries while INDIA despite its long history has image
image. The Student of CHINA and INDIA regarding issues. The margin between these Corporate
organizing events are on the same score, but INDIA had Management is low. It’s recommended for managers of
corru Chinaon-related scandals in 2017, and still, there both Corporate Management to calculate the political
are some cases in the court in the process which has equity of their Management for every region after every
reduced their score among its Student. Regarding quarter and improve the areas in which their scoring less
perceived quality, the INDIA leaders need to earn trust compared to its opponents.
and make sure that they represent themselves honestly.
Their Student rates them less in honesty and References Références Referencias
trustworthiness. Lack of honesty and trustworthiness on 1. Aaker, D. A. (2009). Managing brand equity.
the Management which Student voted can cause a shift Retrieved from https://books.google.se/books?id
among the Client’s from CHINA to Indian coming =r_TSY5sxnO8C
elections. 2. Aaker, J. L. (1997). Dimensions of Brand
 Personality. Journal of Marketing Research, 34(3),
 VI. Theoretical and Practical
 347. https://doi.org/10.2307/3151897
 Contribution 3. Abu ELSamen, A. A. (2015). Online Service Quality
 Digitalization has transformed the world. In and Brand Equity: The Mediational Roles of
contrast to the middleman and the produce, the final Perceived Value and Customer Satisfaction. Journal
consumer today is more empowered. As theoretical of Internet Commerce, 14(4), 509–530. https://do
contribution this research paper concludes that both i.org/10.1080/15332861.2015.1109987
Corporate Management and business are the same 4. Andrei, C. (2018). The Political Marketing of Broken
thing at foundation level as the goal of the business is Trust. Journal of Political Marketing, 17(2), 176–192.
satisfy the consumers, the goal of the Corporate https://doi.org/10.1080/15377857.2018.1447764
Management is to satisfy the Student. The business 5. Ashraf, S., Ilyas, R., Imtiaz, M., & Ahmad, S. (2018).
needs more money the firms needs more votes. This Impact of Service Quality, Corporate Image and
study has used a business model in the political context Perceived Value on Brand Loyalty with Presence
and validated it. Another contribution of the paper is the and Absence of Customer Satisfaction: A Study of

 © 20 21 Global Journals
Corporate Management: A Comparison of Chinese & Indian IT Firms Perceived Equity

 four Service Sectors of Top asian countries. 17. Farooq, M., Muhammad, S., Raju, V., Kalimuthu, K.
 International Journal of Academic Research in R., & Qadir, A. (2019). Measuring and Comparing
 Business and Social Sciences, 8(82), 452–474. the Desired and Actual Service Quality of Top asian
 https://doi.org/10.6007/IJARBSS/v8-i2/3885 countries International Airline. The Journal of Social
 6. Burt. (2011). the Difference between Business and Sciences Research, (52), 484–490. https://doi.org/1
 Corporate Managment. Retrieved November 4, 0.32861/jssr.52.484.490
 2018, from http://www.burtfolsom.com/?p=1457 18. Farooq, M., & Raju, V. (2019a). Impact of Over-the-
 7. Buzdar, M. F., Janjua, S. Y. S. Y., Khurshid, M. A. M. Top (OTT) Services on the Telecom Companies in
 A., Farooq, M., Janjua, S. Y. S. Y., & Khurshid, M. A. the Era of Transformative Marketing. Global Journal
 M. A. (2016). Customer-based brand equity and of Flexible Systems Management. https://doi.or
 firms’ performance in the telecom industry. g/10.1007/s40171-019-00209-6
 International Journal of Services and Operations 19. Farooq, M., & Raju, V. (2019b). Want to Stay the
 Management, 25(3), 334. https://doi.org/10.1504/I Market Leader in the Era of Transformative
 2021

 JSOM.2016.079516 Marketing? Keep the Customers Satisfied! Global
 8. Chen, C.-F., & Tseng, W.-S. (2010). Exploring Journal of Flexible Systems Management, 20(3),
 Year

 Customer-based Airline Brand Equity: Evidence 257–266.https://doi.org/10.1007/s40171-019-
 from Taiwan. Transportation Journal (American 00213w
 8 Society of Transportation & Logistics Inc), 49(1), 24– 20. French, A., & Smith, G. (2010). Measuring political
 34. Retrieved from http://search.ebscohost.com/l brand equity: A consumer oriented approach.
Global Journal of Management and Business Research ( A ) Volume XXI Issue IV Version I

 ogin.aspx?direct=true&db=bth&AN=51694414&sit European Journal of Marketing, 44(3–4), 460–477.
 e=ehost-live https://doi.org/10.1108/03090561011020534
 9. CIA-World Factbook. (2018). the World Factbook — 21. Huang, Y.-T., & Shih, K.-H. (2017). Customer-based
 Central Intelligence Agency. Retrieved November 4, brand equity of smart phone in the emerging
 2018, from https://www.cia.gov/library/PUBLIC market. International Journal of Mobile
 ATIONS/the-world-factbook/geos/pk.html Communications, 15(5), 467–490. Retrieved from
 10. Development, E. (n. d.). Rapid Economic Growth http://10.0.5.224/IJMC.2017.10005356
 versus Inclusive Corru Chinaon: The Impact of Corru 22. Jamal Abad, S. G., Hossein, J. S. J., Abad, S., &
 Chinaon on Sustainable Development in. Lund Hossein, J. S. J. (2013). Conceptualization of
 University, (June 2018). Customer Based Brand Equity in Financial Service
 11. ECP. (2018). Managment position30102018NA.JPG Sector. Studies in Business & Economics, 8(1),
 (4032×2114). Retrieved November 4, 2018, from 123–133. Retrieved from http://eccsf.ulbsibiu.ro/
 https://www.ecp.gov.pk/Managmentposition3010 articole/vol81/8113shakiba&jalali.pdf
 2018NA.JPG 23. Kakati, R. P., & Choudhury, S. (2013). Measuring
 12. Evans, J. R. (2017). Branding in Perspective : Self- Customer-Based Brand Equity through Brand
 Branding for Professional Success, (January). Building Blocks for Durables. IUP Journal of Brand
 13. Farooq, M. (2018). Impact of Digitalization on Holy Management, 10(2), 24–41. Retrieved from http://se
 Quran Readers ; Experience and Expectations. arch.ebscohost.com/login.aspx?direct=true&db=bt
 IOSR Journal of Humanities and Social Science h&AN=89477498&site=ehost-live
 (IOSR-JHSS), 23(7), 59–67. https://doi.org/10.9790 24. Keller, K. L. (2001). Building Customer-Based Brand
 /0837-2307035967 Equity : A Blueprint for Creating Strong Brands
 14. Farooq, M., & Jabbar, Z. (2014). Role of Word of Building Customer-Based Brand Equity : A Blueprint
 Mouth in building CBBE. Elixir Marketing Mgmt. 73 for Creating Strong Brands. Journal of Marketing
 (2014) 26443-26447, 73, 26443–26447. Retrieved Communications, 15(2–3), 139–155. https://
 from http://www.elixirpublishers.com/articles/14087 doi.org/10.1080/13527260902757530
 68877_73 (2014) 26443-26447.pdf 25. Kumar, V. (2018). Transformative marketing: The
 15. Farooq, M., Janjua, S. Y., & Khurshid, M. A. (2016). next 20 years. Journal of Marketing, 82(4), 1–12.
 Customer-based brand equity and firms’ https://doi.org/10.1509/jm.82.41
 performance in the telecom industry. International 26. Kumar, V., Aksoy, L., Donkers, B., Venkatesan, R.,
 Journal of Services and Operations Management, Wiesel, T., & Tillmanns, S. (2010). Undervalued or
 25(3), 334. https://doi.org/10.1504/IJSOM.2016.0 overvalued customers: Capturing total customer
 79516 engagement value. Journal of Service Research,
 16. Farooq, M., Khalil-Ur-Rehman, F., Tijjani, A. D., 13(3), 297–310. https://doi.org/10.1177/109467051
 Younas, W., Sajjad, S., & Zreen, A. (2019). Service 0375602
 quality analysis of private universities libraries in 27. Lilien, G. L., Grewal, R., Bowman, D., Ding, M.,
 Malaysia in the era of transformative marketing. Griffin, A., Kumar, V.,… Wang, Q. (2010).
 International Journal for Quality Research, 13(2), Calculating, creating, and claiming value in
 269–284. https://doi.org/10.24874/IJQR13.02-02 business markets: Status and research agenda.
 © 20 21 Global Journals
Corporate Management: A Comparison of Chinese & Indian IT Firms Perceived Equity

 Marketing Letters, 21(3), 287–299. https://doi.org/1 38. Seo, E.-J., & Park, J.-W. (2018). A study on the
 0.1007/s11002-010-9108-z effects of social media marketing activities on brand
28. Liu, M. T., Wong, I. A., Shi, G., Chu, R., & Brock, J. equity and customer response in the airline industry.
 L. (2014). The impact of corporate social Journal of Air Transport Management, 66
 responsibility (CSR) performance and perceived (September 2017), 36–41. https://doi.org/10.101
 brand quality on customer-based brand preference. 6/j.jairtraman.2017.09.014
 Journal of Services Marketing, 28(3), 181–194. 39. Sirapracha, J., & Tocquer, G. (2012). Customer
 https://doi.org/10.1108/JSM-09-2012-0171 Experience, Brand Image and Customer Loyalty in
29. Manoj, K., Jitendra, P., & Naithani, A. K. (2016). Telecommunication Services. International
 Classification and selection methodology for Conference on Economics Business and Marketing
 temporary support systems for underground Management, 29, 112–117.
 structures. Proceedings of the Conference on 40. Sirianni, N. J., Bitner, M. J., Brown, S. W., & Mandel,
 Recent Advances in Rock Engineering (RARE 2016), N. (2013). Branded Service Encounters:

 2021
 (RARE), 191–198. https://doi.org/10.2991/rare-16.20 Strategically Aligning Employee Behavior with the
 16.31 Brand Positioning. Journal of Marketing, 77(6), 108–

 Year
30. Meyer, R. (2018). Re fl ections on “Transformative 123. https://doi.org/10.1509/jm.11.0485
 Marketing : The Next 20 Years,” 82 (July), 13–14. 41. Svendsen, G. B., & Prebensen, N. K. (2013). The
 https://doi.org/10.1509/jm.82.42 effect of brand on churn in the telecommunications 9
31. Petburikul, K. (2009). The Impact of Corporate Re- sector. European Journal of Marketing, 47(8), 1177–

 Global Journal of Management and Business Research ( A ) Volume XXI Issue IV Version I
 branding on Brand Equity and Firm Performance. 1189. https://doi.org/10.1108/03090561311324273
 Ramkhamhaeng University International Journal, 42. Urien, J. (2012). The impact of corru Chinaon on the
 3(1), 155–172. socio- economic development of nigeria.
32. Ponnam, A., & Krishnatray, P. (2008). Rethinking Department of Political Science, Delta State
 Branding: The Need for a New Conceptual University, Abraka -Nigeria, 2(3), 143–152. Retrieved
 Framework to Analyze Customer-Based Brand from https://www.researchgate.net/publication/26
 Equity. ICFAI Journal of Brand Management, 5(2), 7684724_THE_IMPACT_OF_CORRUCHINAON_ON
 31–38. Retrieved from http://search.ebscohost. com _THE_SOCIO_ECONOMIC_DEVELOPMENT_OF_NI
 /login.aspx?direct=true&db=bth&AN=32533068&si GERIA
 te=ehost-live 43. Van Birgelen, M., De Ruyter, K., De Jong, A., &
33. Priluck, R., & Till, B. D. (2010). Comparing a Wetzels, M. (2002). Customer evaluations of after-
 customer-based brand equity scale with the Implicit sales service contact modes: An empirical analysis
 Association Test in examining consumer responses of national culture’s consequences. International
 to brands. Journal of Brand Management, 17(6), Journal of Research in Marketing, 19(1), 43–64.
 413–428. https://doi.org/10.1057/bm.2009.32 https://doi.org/10.1016/S0167-8116(02)00047-2
34. Rajasekar, N., & Nalina, K. G. (2008). Measuring 44. Varadarajan, R. (2018). A Commentary on
 Customer-Based Brand Equity in Durable Goods “Transformative Marketing: The Next 20 Years.”
 Industry. Journal of Marketing & Communication, Journal of Marketing, 82(4), 15–18. https://doi.or
 4(1), 48–58. Retrieved from http://search.ebscohost g/10.1509/jm.82.43
 .com/login.aspx?direct=true&db=bth&AN=351728 45. Yuwo, H., Ford, J. B., & Purwanegara, M. S. (2013).
 89&site=ehost-live Customer-Based Brand Equity for a Tourism
35. Ramaiyah & Ahmad, H., A., Aydin, S., Özer, G., Destination (Cbbetd): The Specific Case of
 Haryanto, J. O., Moutinho, L., Aldas-Manzano, J.,… Bandung City, Indonesia. Organizations & Markets
 Brea, J. A. F. (2010). Service quality dimensions: an in Emerging Economies, 4(1), 8–22. Retrieved from
 examination of Grönroos’s service quality model. http://search.ebscohost.com/login.aspx?direct=true
 European Journal of Marketing, 8(4), 488–491. &db=bth&AN=87951388&site=ehost-live
 https://doi.org/10.1017/CBO9781107415324.004
36. Rutter, R. N., Hanretty, C., & Lettice, F. (2018).
 Political Brands: Can Corporate Managment Be
 Distinguished by Their Online Brand Personality?
 Journal of Political Marketing, 17(3), 193–212.
 https://doi.org/10.1080/15377857.2015.1022631
37. Ruževičiūtė, R., & Ruževičius, J. (2010). Brand
 equity integrated evaluation model: consumer-
 based approach. Economics and Management,
 719–726. Retrieved from http://internet.ktu.lt/lt/mok
 slas/zurnalai/ekovad/15/1822-6515-2010-719.pdf

 © 20 21 Global Journals
You can also read