Monthly Market Outlook May 2019 - Monthly Market Outlook June 2019 Equity & Fixed Income Outlook - ICICI Prudential Mutual Fund

Page created by Denise Elliott
 
CONTINUE READING
Monthly Market Outlook May 2019 - Monthly Market Outlook June 2019 Equity & Fixed Income Outlook - ICICI Prudential Mutual Fund
Monthly Market Outlook
      June 2019
Monthly Market Outlook
      May 2019
 Equity & Fixed Income Outlook
Monthly Market Outlook May 2019 - Monthly Market Outlook June 2019 Equity & Fixed Income Outlook - ICICI Prudential Mutual Fund
Global Indices Performance
                                                     Returns Performance - May 2019
                  4     3.1                                                                                                                                                              • Russian markets rose 3.1%
                                 1.7                                                                                                                                                       during the month owing to a
                  2                        0.7
                  0                                                                                                                                                                        rise in crude prices (Russia’s
  Returns (%)

                                                                                                                                                                                           key export). Indian markets
                 -2
                                                                                                                                                                                           cheered the re-election of the
                 -4                                 -2.5                                                                                                                                   incumbent government and
                                                                   -3.5 -3.8
                 -6                                                                 -4.3 -5.0                                                                                              rose by 1.7%
                                                                                                       -5.8 -5.9
                 -8                                                                                                     -6.7 -6.8 -7.3 -7.4
                -10                                                                                                                                              -8.3                    • Mostly, markets ended in
                                                                                                                                                                             -9.4          negative terrain owing to
                -12
                                                                                                                                                                                           global growth slowdown &

                                                                                                                                           South Korea
                                           Brazil
                                                     Switzerland

                                                                                             Germany
                                                                                                       China
                                                                                                               Europe
                                  India

                                                                   UK

                                                                                                                        US

                                                                                                                                                         Japan
                                                                                                                                                                 Singapore
                                                                                                                                                                             Hong Kong
                        Russia

                                                                                    Taiwan
                                                                        Indonesia

                                                                                                                                  France
                                                                                                                                                                                           escalating US-China Trade
                                                                                                                                                                                           issues

Germany - DAX Index; China - SSE Composite Index; France - CAC 40 Index; Japan - Nikkei; Eurozone - Euronext 100; Hong Kong - HangSeng; US - Dow Jones; Singapore - Strait Times; Russia - RTS Index; Indonesia - Jakarta Composite Index; U.K. - FTSE;
South Korea - Kospi; Brazil - Ibovespa Sao Paulo Index; Indonesia – Jakarta Composite Index; Switzerland – Swiss Market Index; Taiwan – Taiwan Stock Exchange Corporation; India – S&P BSE Sensex; Returns in % terms. Data Source: MFI; Returns are
absolute returns for the PRI variant of the index calculated between April 30, 2019 – May 31, 2019. Past performance may or may not be sustained in future                                                                                                2
Monthly Market Outlook May 2019 - Monthly Market Outlook June 2019 Equity & Fixed Income Outlook - ICICI Prudential Mutual Fund
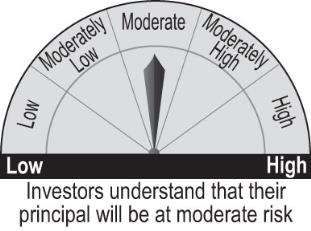
Sectoral Indices Performance - India
                                                       Returns Performance - May 2019
                 12 10.6 9.6                                                                                                                                                                   • Capital Goods &
                  8          6.2 5.8                                                                                                                                                             Financials outperformed
  Returns (%)

                                     4.8 4.1 3.5                                                                                                                                                 in May given the
                  4                              2.5 2.1
                                                         0.3                                                                                                                                     improved policy
                  0                                                                                                                                                                              environment post election
                 -4                                          -1.3 -1.6 -2.1                                                                                                                      results
                                                                            -2.9
                 -8                                                              -6.6 -7.4                                                                                                     • Sectors like IT and Auto
                -12                                                                                                                                                                              were impacted by trade
                                                     Bankex

                                                                                                         Power
                                                               Telecom
                                                                         Infra

                                                                                                                                                                             HC
                                                                                                                                          Energy
                                                                                                                 Basic Materials
                                 Realty

                                                                                                                                   FMCG
                        CG

                                                                                             Oil & Gas

                                                                                                                                                   Auto
                                                                                                                                                          IT
                                                                                   CD

                                                                                                                                                                   Metal
                                           Finance

                                                                                                                                                                                                 tensions and weak sales
                                                                                                                                                                                                 data due to slowing
                                                                                                                                                                                                 consumption respectively

All indices are of S&P BSE and carry the prefix of S&P BSE; Abbreviated CD - S&P BSE Consumer Durables; CG - S&P BSE Capital Goods; FMCG - S&P BSE Fast Moving Consumer Goods; HC - S&P BSE Health Care; Infra. - S&P BSE India Infrastructure; IT - S&P
BSE Information Technology, NBFC – Non-banking Finance Companies. Data Source: MFI; Returns are absolute returns for the TRI variant of the index calculated between April 30, 2019 – May 31, 2019; Past performance may or may not be sustained in future
                                                                                                                                                                                                                                                             3
Monthly Market Outlook May 2019 - Monthly Market Outlook June 2019 Equity & Fixed Income Outlook - ICICI Prudential Mutual Fund
OUR EQUITY OUTLOOK:
REFORMS CONTINUITY TO SHAPE INDIA‟S LONG
          TERM GROWTH STORY

                                           4
General Elections Outcome 2019
                             The incumbent government won the general elections with a significant majority
                         owing to various reforms executed in the past and potential continuity of the same in future

              GROWTH IN VOTE SHARE OF                                                              LOK SABHA REPRESENTATION
             THE INCUMBENT GOVERNMENT                                                                     OVER YEARS

        No. of Seats won by the Incumbent Government                                          What does the Lok Sabha look like
                                                                                 400
  305                                           303                                     353
                                                                                 350                  336
  300                                                                            300                                     262

                                                                  No. of Seats
  295                                                                            250                                                  218
  290                                                                            200                                            181
                                                                                                                   159
  285                                                                            150
                            282                                                               91
                                                                                 100                        60
  280
                                                                                  50
  275
                                                                                   0
  270                                                                                    2019        2014           2009         2004
                           2014                2019                                Incumbent Government & Allies     Opposition & Allies
Source: Election Commission of India
                                                                                                                                            5
Key Reforms Implemented over the last 5 Years

                                                                                                    GST has resulted in a simpler indirect taxation framework with the removal of
         GST Implementation                                                                         multiple tax slabs across different states. This would further result in higher tax-to-
                                                                                                    GDP ratio and reduce India‟s consolidated Fiscal Deficit

                                                                                                                 The „Jan Dhan Yojna‟ was started in 2014 under which ~350 Mn bank
          Financial Inclusion                                                                                    accounts* have been opened primarily being used for savings & payments.
                                                                                                                 These accounts can be used for DBT-related cash transfers

                                                                                                                              This law helped boost home buyer confidence and made it difficult
             RERA Implementation                                                                                              for unscrupulous property developers to survive

                                                                                                                                         India did not have a bankruptcy law until 2017. The passing of the
               Bankruptcy Law                                                                                                            law and the action thereafter has reduced the resolution time for
                                                                                                                                         the bankruptcy related cases from 5+ years earlier to 18-24 months.

                                                                                                                                                 5 associate banks of State of Bank of India were merged
                                                                                                                                                 into SBI. Also, Vijaya Bank and Dena Bank were merged
                 PSU Bank Consolidation                                                                                                          into Bank of Baroda, reducing the number of state owned
                                                                                                                                                 banks from 26 to 19

*Source: CLSA. GST – Goods & Services Tax, GDP – Gross Domestic Product, RERA – Real Estate Regulation Act/Authority, PSU – Public Sector Unit
                                                                                                                                                                                                               6
Current Scenario

                                                       01          The Incumbent Government has been re-elected
                                                                            with a significant majority

                                                               02
           Continuity of Reforms & Initiatives are expected
           from the Incumbent Government which is a big
              positive for the markets in the long term

                                                                The current environment however, poses some major
                                                               challenges to the newly-elected government including a

                                                      03      slowdown in economy, Fiscal Concerns, NBFC Concerns,
                                                               revitalizing PSU Banks, etc. However, the continuity in
                                                                  reforms should help in navigating these concerns

                                                              04
           We have been neutral on equities. However, the
               outlook has turned more positive on the
            expectations of continued reforms by a stable
                             government

NBFC – Non Banking Financial Company
                                                                                                                         7
Analysis of market returns post election results
        Whenever the election outcome is favourable, there tends to be a short term spurt in market returns. However, over long term,
                markets seek direction from macro-economic indicators which highlight the overall health of the economy.

                2009 - 2014 S&P BSE Sensex Index Performance                                                   2014 - 2019 S&P BSE Sensex Index Performance

    26,000

    24,000                                                                                          42,000
                       1Y                                4Y Returns
    22,000
                     Returns                                9.5%                                    37,000              1Y
                      15.9%                                                                                           Returns            4Y Returns
    20,000
                                                                                                                       14.9%                8.8%
    18,000                                                                                          32,000

    16,000
                                                                                                    27,000
    14,000

    12,000                                                                                          22,000
                 May-09

                                    May-10

                                                      May-11

                                                                         May-12

                                                                                  May-13

                                                                                           May-14

                                                                                                             May-14

                                                                                                                                May-15

                                                                                                                                             May-16

                                                                                                                                                      May-17

                                                                                                                                                               May-18

                                                                                                                                                                        May-19
Source: BSE India, Past performance may or may not be sustained in future.
                                                                                                                                                                                 8
Current Valuations Fully Priced-In
      A look at various economic indicators highlight the fact that valuations are not as reasonable as they were in 2014.
                                      Also, there are signs of slowdown in the economy.

                          Valuations                                                                                                 April 2014                                    April 2019

                          Trailing P/E Nifty 50                                                                                           18.79                                         29.33

                          Trailing P/B Nifty 50                                                                                            3.23                                          3.76

                          Trailing P/E Nifty Midcap 100                                                                                   15.56                                         33.71

                          Trailing P/B Nifty Midcap 100                                                                                    1.65                                          2.85

                          Trailing P/E Nifty Smallcap 100                                                                                 19.28                                         33.48

                          Trailing P/B Nifty Smallcap 100                                                                                  0.90                                          2.06
                                                                                                                                  66%
                          Market Cap to GDP Ratio (April 30, 2019)                                                                                                                     82.2%
                                                                                                                          (as on 31st Mar 2014)
All data is as of April 30, 2019. Source: NSE, BSE India, Reserve Bank of India, Edelweiss Securities, Kotak Securities, Axis Direct; P/E: Price to Earnings Ratio; P/B: Price to Book Ratio.
                                                                                                                                                                                                9
Growth numbers slowing down
       Indian Economy slowed down in Q4FY19 to 5.8% from 6.6% in Q3FY19 and 7.7% in Q4FY18. Activities related to
                              capital expenditure slowed down which led to the fall in GDP

                                                                                   GDP Data
                           9.0%
                                                                         7.7%        8.0%
                           8.0%                                                                          6.6%
                                               7.0%                                            7.0%
                           7.0%
                                                                                                                   5.8%
                 GDP (%)

                           6.0%
                           5.0%
                           4.0%
                           3.0%
                           2.0%
                           1.0%
                           0.0%
                                            Q3 FY18                   Q4 FY18       Q1 FY19   Q2 FY19   Q3 FY19   Q4 FY19

Source: CRISIL Research; Data as of March 31, 2019; GDP – Gross Domestic Product
                                                                                                                            10
High Frequency Indicators – Activity Index Growth
                                The overall economic activity witnessed a slowdown to its lowest level since 2013

                                                                     Activity Index Growth
                         12                                                                                                             25

                                                                                                                                              Index of Activity Growth (%)
                         10                                                                                                             20
        GDP Growth (%)

                                                                                                                                        15
                          8
                                                                                                                                        10
                          6
                                                                                                                                        5
                          4
                                                                                                                                        0
                          2                                                                                                             -5
                          0                                                                                                             -10
                              Oct-08

                                          Apr-10

                                                            Oct-11

                                                                        Apr-13

                                                                                        Oct-14

                                                                                                       Apr-16

                                                                                                                      Oct-17

                                                                                                                               Apr-19
                                                   GDP growth (%)           Index of activity Growth (%) - 3m m.a. (rhs)
Source: Jefferies Research.
                                                                                                                                                                             11
High Frequency Indicators – Private Consumption
                                             Private Consumption showing a downtrend in growth

                                                                Auto Sales (YoY Growth)
                     50%
                     40%                           37.5%
                     30%
       YoY Growth

                     20%                                                                  17.2%
                     10%                     22.3%
                                                                                      1.6%
                      0%
                    -10%                                                                                                                   -17.1%
                    -20%                                                                                                                   -16.4%
                    -30%

                                                                                     Oct-18
                                                                  Aug-18

                                                                                              Nov-18
                                                                           Sep-18

                                                                                                       Dec-18

                                                                                                                Jan-19

                                                                                                                                  Mar-19
                           Apr-18

                                                                                                                         Feb-19
                                    May-18

                                              Jun-18

                                                                                                                                              Apr-19
                                                       Jul-18

                         Domestic 2 Wheeler Sales (YoY Growth)                      Domestic Passenger Vehicle Sales (YoY Growth)
Source: Morgan Stanley Research.
                                                                                                                                                       12
High Frequency Indicators – Air Traffic

                                    Number of Air Passengers Flying have been declining Year-On-Year

                                                                   Air Traffic
                    25%
                            21.7%
                    20%
       YoY Growth

                                                                        15.6%
                    15%

                    10%

                    5%
                                                                                                                              -1.1%
                    0%
                                             Jun-18

                                                                                          Nov-18

                                                                                                            Jan-19

                                                                                                                                 Mar-19
                                                                                 Oct-18

                                                                                                   Dec-18
                          Apr-18

                                    May-18

                                                               Aug-18

                                                                        Sep-18

                                                                                                                     Feb-19
                                                      Jul-18

                    -5%

Source: Morgan Stanley Research.
                                                                                                                                          13
FPI Flows Trend – Month on Month

                                               FPI flows could get volatile going ahead depending on Global Growth concerns and
                                                                           Global Central Bank Policies

                                     40,000                                                                                         33,981
       Net FPI Flows (In INR Crs.)

                                     30,000
                                                                                                                                         21,193
                                     20,000                                                                                     17,220

                                     10,000                                                                                               7,920

                                          0
                                               May-16

                                                               Nov-16

                                                                           May-17

                                                                                                        May-18

                                                                                                                                           May-19
                                                                                          Nov-17

                                                                                                                       Nov-18
                                     -10,000

                                     -20,000

                                     -30,000
                                                                                                                  -28,921
                                     -40,000
Source: NSDL; Data as of May 31, 2019. FPI – Foreign Portfolio Investors
                                                                                                                                                    14
Valuations –
   Divergence between Growth and Value Stocks
                  P/E ratio of MSCI India growth and MSCI India value
                                  indices, 2010-19 (%)
     35                                                                                                                  33.1
                                                                                                                                 Value and special
     30                                                                                                                           situation themes
                                                                                                                                expected to play out
     25                                                                                                                  22.7     due to significant
                                                                                                                                disconnect between
     20                                                                                                                          price and value in
                                                                                                                                 many „Growth‟ and
     15
                                                                                                                                   „Value‟ stocks
     10
                     Sep-14
                              Dec-14
                                       Mar-15

                                                         Sep-15
                                                                  Dec-15
                                                                           Mar-16

                                                                                             Sep-16

                                                                                                      Mar-17
                                                                                                      Dec-16

                                                                                                      Sep-17
                                                                                                      Dec-17
                                                                                                      Mar-18

                                                                                                      Sep-18
                                                                                                      Dec-18
                                                                                                      Mar-19
            Jun-14

                                                Jun-15

                                                                                    Jun-16

                                                                                                      Jun-17

                                                                                                      Jun-18
                                   MSCI Growth Index                                                  MSCI Value Index
Source: Morgan Stanley; Data as of March 31, 2019
                                                                                                                                                       15
Case for Long Term Investing &
Managing Volatility

                                                     Implementation of reforms measures and
  Stability and past track record of Reforms        the subsequent results to take ~3-5 years.
  Continuity of the incumbent Government to        Hence, a minimum investment horizon of 3-5
 ensure long term growth story remains intact                years is recommended

 However, short term volatility to prevail given
                                                   We also believe staggered investments over long
  the current economic scenario. Hence we
                                                    term in the form of SIP in Equity Schemes may
   recommend Asset Allocation Schemes to
                                                                help in wealth creation
            benefit from volatility
                                                                                                     16
Outlook – Asset Allocation, Value &
Special Situations Theme
      Neutral stance on equities as valuations look
      completely priced in. However the outlook has
      improved.

      Volatility may prevail due to global and domestic
      factors

      Recommend lump sum investment in Asset
      Allocation Schemes to benefit out of volatility

      Equity accumulation, in mid/small/multicaps,
      should be in a staggered manner via SIP/STP

      Value and special situation themes expected to
      play out during 2019

                                                          17
Schemes to manage Volatility:
Our Asset Allocation Bouquet

            These schemes aim to benefit from volatility and manage equity exposure based on valuations

   ICICI Prudential                 ICICI Prudential              ICICI Prudential Balanced             ICICI Prudential                ICICI Prudential                   ICICI Prudential
Regular Savings Fund*             Equity Savings Fund                  Advantage Fund                   Multi-Asset Fund               Equity & Debt Fund               Asset Allocator Fund^

                                                                         Dynamic Asset
                                             Equity                       Allocation or                         Multi                                                                Fund of
       Conservative                                                                                                                            Aggressive
                                            Savings                        Balanced                            Asset                                                                  Funds
       Hybrid Fund                                                                                                                               Hybrid
                                              Fund                         Advantage                         Allocation
                                                                              Fund
        Net Equity–                       Net Equity–                       Net equity –                    Net Equity –                       Net Equity–                      Net Equity Level*:
         10-25%                            15-50%                            30-80%                          10-80%                             65-80%                               0-100%

The asset allocation and investment strategy will be as per the Scheme Information Document, *This scheme will attract debt taxation. ^Investors may please note that they will be bearing the
recurring expenses of this Scheme in addition to the expenses of the underlying Schemes in which this Scheme makes investment.
                                                                                                                                                                                                     18
ICICI Prudential Balanced Advantage Fund*
                                S&P BSE Sensex Levels vis-a-vis ICICI Prudential BAF Net Equity Exposure (%)

                     40000                                                                                                           Net Equity                                      39,032 80
                                                                                             Net Equity
                                                                                                                                       77.65
                                                                                               77.4                                                                                         75

                                                                                                                                                                                                     ICICI Prudential Balanced Advantage
                                                                                                                                               35,965
                     35000                                                                                                                                                                  70

                                                                                                                                                                                                         Fund Net Equity Exposure (%)
                                                                                                                                                                                            65
     Sensex Levels

                     30000                                                                                      29,183                                                                      60
                                                                                                                                                                                            55
                     25000                                                                                                                                                                  50
                                                                                                                                                                                            45
                                                                                                                          23002
                     20000                                                                                                                                                                  40
                                                                                             18,620                Net Equity Net Equity
                                                                                                                                31.6                                                  42.0 35
                     15000                                                                                           34.3                                                                   30
                                        Jan'11

                                                                                                                                Jan'16
                                                       Nov'11
                             Mar'10

                                                                                    Jul'13

                                                                                                                 Mar'15

                                                                                                                                               Nov'16

                                                                                                                                                                            Jul'18
                                                                                                   May'14

                                                                                                                                                                                            May'19
                                                                      Sep'12

                                                                                                                                                             Sep'17
                                                                    Sensex Level                            Net Equity Exposure %
Source: BSE India & MFIE, Data as of May 31, 2019. The in-house valuation model starts from March 2010 onwards. ICICI Prudential BAF stands for ICICI Prudential Balanced Advantage Fund.
* An open ended dynamic asset allocation fund. The investment strategy will be as per Scheme Information Document
                                                                                                                                                                                                                                           19
ICICI Prudential Asset Allocator Fund#
  “Allocate between equity and debt at right time without tax impact*”
  ICICI Prudential Asset Allocator Fund is an open ended Fund of Funds which has a flexibility to invest across
  equity and debt schemes#

  Investment Universe:
      •Up to 100% in equity mutual fund schemes managed by ICICI Prudential Mutual Fund or any other Mutual
       Fund(s)
      •Up to 100% in debt mutual fund schemes managed by ICICI Prudential Mutual Fund or any other Mutual
       Fund(s)
  Allocation between asset classes
      •The Scheme will be actively managed by experienced Fund Managers.
      •The Scheme allocates between equity and debt mutual fund schemes based on in-house valuation model.
To hedge against inflation or in adverse market situations, the Scheme may invest up to 50% in gold mutual fund schemes. Note: Subscriptions under the dividend plan of the scheme have been discontinued w.e.f. March 06, 2019
*On change in allocation by the scheme. For more details on tax please consult with your tax advisor. The asset allocation and investment strategy will be as per Scheme Information Document. ) Investors may note that they will
be bearing the recurring expenses of this scheme in addition to the expenses of the underlying Schemes in which the scheme makes investment.
(# An open ended fund of funds scheme investing in equity oriented schemes, debt oriented schemes and gold ETFs/ schemes
                                                                                                                                                                                                                                     20
Schemes to benefit from Value & Special
   Situations Theme
           These schemes aim to create wealth over long term by investing in opportunities at
                                       reasonable valuations

                                                                                                                           ICICI Prudential Value Discovery Fund^

                                                                             01                                                         Value Fund with Equity Levels –
                                                                                                                                                  65 - 100%

                                                                                                                                                                                   Fund of
                                                                                                                                                                                    Funds

          ICICI Prudential India Opportunities Fund*
       Special Situations Fund with Equity & Equity related
        instruments of special situations theme of around
                            80 - 100%.
                                                                                                                        02
*An open ended equity scheme following special situations theme. ^An open ended equity scheme following a value investment strategy. The investment strategy of the schemes will be as per the Scheme
Information Document                                                                                                                                                                                    21
ICICI Prudential India Opportunities Fund

                                               Situations that can be turned into opportunities

                                                       (1) Special Situation due to temporary Crisis in
                                                             a. Company b. Sectors c. Economy

                (2) Government                                                                (3) Global Events/Uncertainties
          Action/Regulatory Changes

The investment strategy will be as per Scheme Information Document
                                                                                                                                22
Schemes to benefit from growth story

                                    These schemes aim to benefit from the long term growth story

                                                                                                                                              GROWTH
                                                                                                 ICICI Prudential
                                                                                                 Multicap Fund#
                                                          ICICI Prudential
                                                          Midcap Fund^                                   Multicap Fund
                                                                                                         Equity Levels –
                   ICICI Prudential                                                                        65 - 100%
                   Smallcap Fund*                                    Midcap Fund
                                                                     Equity Levels–
                    Smallcap Fund                                      65 - 100%
                     Equity Levels–
                       65 - 100%
* An open ended equity scheme predominantly investing in small cap stocks. ^ An open ended equity scheme predominantly investing in mid cap stocks. # An open ended equity scheme investing across
large cap, mid cap, small cap stocks. The investment strategy of the schemes will be as per the Scheme Information Document
                                                                                                                                                                                                     23
ICICI Prudential Midcap Fund –
Investment Universe

                  Compounders with                                                     Structural                Cyclical
                    Stable Growth                                                       Growth                   Growth

             Long Term Wealth Creators                                     Long Term Wealth creators       Tactical Compounders
                with Stable Growth                                          Beneficiaries of Structural   Beneficiary of Economic
             Consumption ideas, Brands                                        changes in economy                   Cycles
              & High moat businesses

The investment strategy of the scheme will be as per the Scheme Information Document                                                24
ICICI Prudential Multicap Fund

                              Flexibility to invest across market capitalization

                                                              Well diversified across various sectors and stocks

                              Mix of Value and Growth Strategy

        • Top down and bottom up approach
        • Less sector skewness and Midcap/ Smallcap allocation would be based
          directionally as per our In-House Market Cap Model

The investment strategy of the scheme will be as per the Scheme Information Document
                                                                                                                   25
Our SIP Recommendations

 ICICI Prudential         ICICI Prudential               ICICI              ICICI Prudential         ICICI Prudential
 Value Discovery          Large & Midcap               Prudential            Smallcap Fund          US Bluechip Equity
       Fund                     Fund                  Midcap Fund                                          Fund
(An open ended equity    (An open ended equity     (An open ended equity   (An open ended equity    (An open ended equity
  scheme following a    scheme investing in both   scheme predominantly    scheme predominantly        scheme investing
   value investment       largecap and midcap       investing in mid cap    investing in smallcap      predominantly in
       strategy)                stocks)                    stocks)                 stocks)          securities of large cap
                                                                                                      companies listed in
                                                                                                     the United States of
                                                                                                          America.)

                                                                                                                              26
Equity Valuation Index
    170

    150
                                                                            Book Partial Profits

    130                                                                                                                                                         117.73                        Equity valuations show that
                                                                                          Incremental Money to Debt                                                                           the market valuations are in
    110                                                                                                                                                                                      the zone where investors are
                                                                                                    Neutral                                                                                    recommended to invest in
                                                                                                                                                                                              Asset Allocation / Balanced
      90                                                                                                                                                                                       Advantage Funds & Credit
                                                                                                                                      Invest in Equities
                                                                                                                                                                                             Risk/Medium Duration Funds
      70
                                                                                                    Aggressively invest in Equities
      50
             May-06

                          May-07

                                      May-08

                                                  May-09

                                                              May-10

                                                                          May-11

                                                                                      May-12

                                                                                                  May-13

                                                                                                                          May-15

                                                                                                                                       May-16

                                                                                                                                                   May-17

                                                                                                                                                               May-18

                                                                                                                                                                           May-19
                                                                                                              May-14

Equity Valuation index is calculated by assigning equal weights to Price-to-Earnings (PE), Price-to-Book (PB), G-Sec*PE and Market Cap to GDP ratio. G-Sec – Government Securities. GDP – Gross Domestic Product; Asset Allocation – Schemes that
invest both in equity and fixed income
                                                                                                                                                                                                                                                    27
OUR FIXED INCOME OUTLOOK:
   PLAY ON LIQUIDITY & CARRY

                               28
Current Scenario

                                                     01
                                                              RBI has delivered a 50 bps rate cut. However due
                                                              to tight liquidity conditions, transmission remains
                                                               a challenge. Going forward, RBI is expected to
                                                                  take various measures to improve liquidity

                                                              02
            Liquidity is also expected to improve due to
           government expected to do non-discretionary
                        spending post budget.

                                                     03         June – September period is seasonally less
                                                                       stressful for system liquidity

          We expect liquidity to improve, which in turn can
           be positive for the short end of the yield curve   04
Source : RBI, Data as on 31-May-2019                                                                                29
Play on Liquidity –
   System Liquidity likely to turn positive
       100                                        Daily Interbank Liquidity(in US$, Bn)
         80
         60
                                                                                                                                     Liquidity
         40                                                                                                                        Conditions
                                                                                                                                remained in the
         20
                                                                                                                                  deficit mode.
           0                                                                                                                      However, we
        -20                                                                                                                      believe system
                                                                                                                              liquidity is likely to
        -40                                                                                                                       turn positive
        -60
                                         Dec-13

                                                                        Dec-15

                                                                                                   Dec-17
               Aug-12

                           Apr-13

                                                      Aug-14

                                                               Apr-15

                                                                                 Aug-16

                                                                                          Apr-17

                                                                                                            Aug-18

                                                                                                                     Apr-19
Source : RBI, Data as on 30-April-2019                                                                                                                 30
Government Surplus expected to come down

                                   Government of India Surplus Cash Surplus with RBI (INR Bn)

   1100                                                                                                  Govt. has been
                                                                                                     maintaining high cash
                                                                                                    balance with RBI. Since
     800
                                                                                                   the election is behind us,
                                                                                                   we expect govt. to push
     500                                                                                              the surplus into the
                                                                                                     system through non-
                                                                                                    discretionary spending,
     200                                                                                              which may result in
                                                                                                        positive liquidity.
    -100

                                                                    Dec-18
            Apr-18

                                 Jun-18

                                             Aug-18

                                                        Oct-18

                                                                                          Apr-19
                                                                               Feb-19
Source : RBI, Data as on 30-April-2019                                                                                          31
Currency in Circulation (CIC )Trend Seasonal Trend

       4.0%                                    Currency in Circulation MoM% 5Y Avg
       3.5%
       3.0%
                                                                        Currency in circulation dips in
       2.5%                                                          sequential terms between Jun-Sept       Seasonally, the
                                                                                                             May-September
       2.0%
                                                                                                           period is when the
       1.5%                                                                                               CIC reduces due to
       1.0%                                                                                               lower demand, this
                                                                                                            is positive for the
       0.5%                                                                                                      liquidity.
       0.0%
      -0.5%
      -1.0%
                     Apr      May      Jun   Jul   Aug   Sep   Oct   Nov    Dec     Jan    Feb     Mar
Source : RBI, Data as on 31-Mar-2019                                                                                              32
RBI Dividend to Government
                         Surplus Transferable to the Government of India (US$ bn)
     12
                                                   10.8                                                                               10.5
                                                                               10.1
     10
                        8.7                                                                                                                                      RBI usually
       8                                                                                                                                                        transfers the
                                                                                                           6.1
                                                                                                                                                             surplus dividend to
       6                                                                                                                                                     the government in
                                                                                                                                                              August. This will
       4                                                                                                                                                      further boost the
                                                                                                                                                               system liquidity
       2

       0
                     F2015                       F2016                       F2017                      F2018*                     F2019**
Source: RBI, Budget, Morgan Stanley Research *Includes Interim dividend of INR100bn in F2018. ** Includes interim dividend of INR 280bn in F2019. Note the years are as per GoI's fiscal year
accounting (Apr-Mar)
                                                                                                                                                                                                33
Going Forward - RBI Expected to Ease Liquidity

                            RBI Tools

  OMO                        Foreign
            Cash Reserve                Accommodative   Dividend/
Purchases                   Exchange
               Ratio                        Stance      Reserve
                             SWAP

                                                                    34
RBI using OMOs & FX SWAP to Manage Liquidity

                                                              OMO Operations (In INR Bn)
       600                                                                                                                                             FX SWAP‟s
       500                                                                                                                                             500
       400                                                                                                                                                                    RBI is
       300                                                                                                                                                       250       implementing
                                                                                                                                                                           measures like
       200                                                                                                                           200
                                                                                                                           100                                            OMOs & Foreign
       100
                                                                                                                                                                         Exchange Swap to
         0                                                                                                                                                                manage liquidity
      -100
      -200
      -300
                                 Dec-16

                                                                                       Dec-17

                                                                                                                                              Dec-18
               Aug-16

                        Oct-16

                                                   Apr-17

                                                            Jun-17

                                                                     Aug-17

                                                                              Oct-17

                                                                                                         Apr-18

                                                                                                                            Aug-18

                                                                                                                                     Oct-18

                                                                                                                                                                Apr-19
                                                                                                                  Jun-18
                                          Feb-17

                                                                                                Feb-18

                                                                                                                                                       Feb-19
Source : RBI, Data as on 30-April-2019                                                                                                                                                       35
Improvement in Liquidity Conditions & Short End Space
                          2009 Phase                                              2017 Phase
    -6,00,000                                                                                       14
    -5,00,000                                                                                       13
                                                             Surplus Zone                                Liquidity conditions
    -4,00,000                                                                                       12
    -3,00,000
                                                                                                            is expected to
                                                                                                    11        improve as
    -2,00,000
                                                                                                    10     discussed in the
    -1,00,000                                                                                              previous slides.
                                                                                                    9
             -                                                                                           This shift is positive
     1,00,000
                                                                                                    8     for the short term
                                                                                                    7            rates
     2,00,000
     3,00,000                                                  Deficit Zone                         6

     4,00,000                                                                                       5

                          Liquidity (In Crs.)   1 Year AAA Yield (%)        10 Year AAA Yield (%)
Source : RBI, Data as on 24-May-2019                                                                                              36
Play on Carry –
Strong case for investment in Credit Risk Funds

                       Valuations are attractive

 Industry Flows are slowing                 Sentiments are Negative
            down
                                                                      37
Valuations are Attractive –
  ICICI Prudential Credit Risk Fund – Spread Over Repo

                                                             Phase 1                                                   Phase 2
    6

    5                                                                                                                                                 Current Spread :
                                                                                                                                                            4.5
    4

    3
                                                                                                                                                    Average Spread :
    2                                                                                                                                                     2.9

    1

    0

        Nov-16

        Nov-17

        Nov-18
        Jun-11

        Jun-15

        Jun-16
        Mar-11

        Sep-11

        Mar-12
        Jun-12
        Sep-12

        Mar-13
        Jun-13
        Sep-13

        Mar-14
        Jun-14
        Sep-14

        Mar-15

        Sep-15

        Mar-16

        Feb-17

        Feb-18

        Feb-19
        Dec-10

        Aug-17

        Aug-18
        Dec-11

        Dec-12

        Dec-13

        Dec-14

        Dec-15

        Aug-16

        May-17

        May-18

        May-19
Data as on 31-May-2019, YTM values taken since scheme inception. Source: MFI Explorer, Past performance may or may not be sustained in the future
                                                                                                                                                                         38
ICICI Prudential Medium Term Bond Fund–
  Spread Over Repo (Last 10 Year Trend)
                                                                                        Phase 1                                    Phase 2
      5

      4                                                                                                                                            Current Spread :
                                                                                                                                                         4.0
      3
                                                                                                                                                   Average : 2.13
      2

      1

      0

     -1

     -2
          Sep-09

          Sep-10

          Sep-11

          Sep-12

          Sep-13

          Sep-14

          Sep-15

          Sep-16

          Sep-17

          Sep-18
          Jan-10

          Jan-11

          Jan-12

          Jan-13

          Jan-14

          Jan-15

          Jan-16

          Jan-17

          Jan-18

          Jan-19
          May-09

          May-10

          May-11

          May-12

          May-13

          May-14

          May-15

          May-16

          May-17

          May-18

          May-19
Data as on 31-May-2019, YTM values taken for the last 10 years. Source: MFI Explorer, Past performance may or may not be sustained in the future
                                                                                                                                                                      39
Invest when Flows are Muted

                                       Credit Risk Funds Category AUM (In Crs) - Industry Level
  92,000                                                                                    90,924
  90,000
  88,000
  86,000
  84,000                                                                                                                                                           81,181
  82,000
                                                                                                                                                                             79,911
  80,000
  78,000
  76,000
  74,000
                         Mar-18

                                       Apr-18

                                                     May-18

                                                                   Jun-18

                                                                                               Aug-18

                                                                                                                      Oct-18

                                                                                                                                                                    Mar-19
                                                                                 Jul-18

                                                                                                                                                                              Apr-19
                                                                                                                               Nov-18

                                                                                                                                        Dec-18
                                                                                                             Sep-18

                                                                                                                                                 Jan-19

                                                                                                                                                          Feb-19
Source: MFIE. The funds considered are only Credit Risk Funds as per SEBI classification. Data as of April 30, 2019
                                                                                                                                                                                       40
Why ICICI Prudential Accrual Funds

                      Robust     Strong Credit   Better Risk
     Investment
                    Investment     Selection      Adjusted
     Philosophy
                      Process       Process       Returns

                                                               41
Investment Philosophy

         01                Safety
                                            The investment team
                                         seeks to achieve Safety,
                                           Liquidity and Returns
                                         (SLR) in order of priority
              Liquidity             02    for managing variety of
                                              our fixed income
                                                  schemes.

         03               Returns

                                                                      42
Robust Investment Process

        CREDIT RESEARCH            PORTFOLIO CONSTRUCTION            PORTFOLIO MONITORING

    Involves assessment of :                                        • Regular review of macro-
                                   • Based on investment
                                                                      economic variables, liquidity
    • Past track record of the       mandate of the scheme
                                                                      and credit risk
      company
                                   • Yield and interest rate risk   • Regular monitoring of
    • Cash flows
                                     management based on              financial and business
    • Asset Quality                  interest rate view and             profile of issuers
                                     technical factors
    • Assessment of Management                                      • Regular meetings with
      risk & Business risk                                            company managements
                                   • Liquidity risk management
    • Credit Ratings by external     to avoid asset-liability       • Performance and portfolio
      credit rating agencies          mismatch                        analysis

                                                                                                      43
Strong Credit Selection Process

           Target list filters
 •   Independent research team               Decision making is
 •   Self-origination model                  not concentrated to
 •   External credit rating                      one person

                                                              Focus not just on
                                                             credit and liquidity
  Independent                                                  risk but also on
evaluation by Risk                                              diversification
      Team                        CREDIT
                                 SELECTION

                                                                                    44
Accrual Schemes

Scheme Name                                                                       Yield to Maturity   Modified Duration
ICICI Prudential Credit Risk Fund                                                      10.54%             1.43 Years

ICICI Prudential Medium Term Bond Fund                                                 9.96%              2.04 Years

ICICI Prudential Floating Interest Fund                                                8.77%             234.78 Days

These schemes aim to provide better risk-adjusted returns based on our investment process

Data as of May 31, 2019; Past performance may or may not be sustained in future
                                                                                                                          45
High Quality Portfolio

                                                                                                                                           Exposure to
                                                                                            Average      Yield to Maturity    Modified
Scheme Name                                                                                                                                   AAA*
                                                                                            Maturity           (YTM)          Duration
                                                                                                                                            securities

ICICI Prudential Money Market Fund                                                       172.49 Days          7.20%          160.86 Days      100%

ICICI Prudential Savings Fund                                                            388.11 Days          7.74%          297.65 Days     86.78%

ICICI Prudential Short Term Fund                                                            2.47 Years        8.19%          1.86 Years      82.51%

ICICI Prudential Corporate Bond Fund                                                        2.38 Years        7.89%          1.68 Years      99.99%

ICICI Prudential Banking & PSU Debt Fund                                                    3.80 Years        8.07%          2.38 Years      80.57%

Data as of May 31, 2019; Past performance may or may not be sustained in future. *AAA, G-Sec and Cash
                                                                                                                                                         46
Outlook – Play on Liquidity & Carry
                We continue to remain sanguine towards the short end
                of the yield curve and on spread assets

                We may tactically alter duration based on the spread
                opportunity available in different market segment

                We believe the next rate cut would be data-dependent

                Accrual schemes have moved into „buy‟ territory with
                attractive valuations, reduced flows, and negative
                sentiments (NBFC liquidity crunch).

                Risk-reward benefit has turned favourable; good time to
                earn carry with high credit spreads available in the
                corporate bond space

NBFC – Non-Banking Financial Companies
                                                                          47
Debt Valuation Index
     10
       9                                                                                                                                                                                •   We recommend investors to
                                                              Aggressively in High Duration
                                                                                                                                                                                            invest in Low Duration
       8                                                                                                                                                                                    schemes or accrual schemes
                        High Duration
       7                                                                                                                                                                                    such as ICICI Prudential
                                                                                                                                   High Duration
                                                                                                                                                                                            Credit Risk Fund.
       6
       5                                                                                                                                                                                •   For those investors who aim
                                       Moderate Duration
       4                                                                                                                                                                                    to benefit from volatility we
                                                                                                                                                                          2.44              recommend investment in
       3                                    Low Duration                                                                                                                         2.50       ICICI Prudential All Seasons
       2                                                                                                                                                                                    Bond Fund.
                                                Ultra
                                                Ultra Low
                                                      Low Duration
                                                          Duration
       1
                              Sep-16
                     Jul-16

                                                                            Jul-17

                                                                                                                         May-18
                                                                                                                                  Jul-18
            May-16

                                                                   May-17

                                                                                     Sep-17

                                                                                                                                           Sep-18

                                                                                                                                                                               May-19
                                                 Jan-17

                                                                                                       Jan-18

                                                                                                                                                             Jan-19
                                       Nov-16

                                                          Mar-17

                                                                                              Nov-17

                                                                                                                Mar-18

                                                                                                                                                    Nov-18

                                                                                                                                                                      Mar-19
Debt Valuation Index considers WPI, CPI, Sensex YOY returns, Gold YOY returns and Real estate YOY returns over G-Sec yield, Current Account Balance and Crude Oil Movement for calculation. WPI – Wholesale Price Index;
CPI – Consumer Price Index. None of the aforesaid recommendations are based on any assumptions. These are purely for reference and the investors are requested to consult their financial advisors before investing.
                                                                                                                                                                                                                            48
Fixed Income Recommendations

ICICI Prudential Floating Interest Fund
                                                          Cash Management Solution
                                                (aims to benefit from better risk adjusted returns)
ICICI Prudential Ultra Short Term Fund

ICICI Prudential Medium Term Bond Fund
                                                                 Accrual Schemes
                                             (aims to benefit from capturing yields at elevated levels)
ICICI Prudential Credit Risk Fund

                                                           Dynamic Duration Schemes
ICICI Prudential All Seasons Bond Fund
                                          ( aims to benefit from volatility by actively managing duration)

                                                         Low/Short Duration Schemes
ICICI Prudential Short Term Fund
                                              (aims to benefit from mitigating interest rate volatility)

                                                                                                             49
Our Equity Schemes

 Scheme Name                                 Type of Scheme

 ICICI Prudential Bluechip Fund              An open ended equity scheme predominantly investing in large cap stocks

 ICICI Prudential Large & Mid Cap Fund       An open ended equity scheme investing in both large cap and mid cap stocks.

 ICICI Prudential Midcap Fund                An open ended equity scheme predominantly investing in mid cap stocks.

 ICICI Prudential Smallcap Fund              An open ended equity scheme predominantly investing in small cap stocks.

 ICICI Prudential Value Discovery Fund       An open ended equity scheme following a value investment strategy.

                                             An open ended equity scheme investing across large cap, mid cap, small cap
 ICICI Prudential Multicap Fund
                                             stocks.

 ICICI Prudential India Opportunities Fund   An Open Ended Equity Scheme following Special Situation theme

                                             An open ended equity scheme investing predominantly in securities of large cap
 ICICI Prudential US Bluechip Equity Fund
                                             companies listed in the United States of America.

                                                                                                                              50
Our Hybrid Schemes / Fund of Funds Scheme

 Scheme Name                               Type of Scheme

ICICI Prudential Balanced Advantage Fund   An open ended dynamic asset allocation fund

ICICI Prudential Regular Savings Fund      An open ended hybrid scheme investing predominantly in debt instruments

                                           An open ended scheme investing in equity, arbitrage and
ICICI Prudential Equity Savings Fund
                                           debt.
                                           An open ended hybrid scheme investing predominantly in equity and equity
ICICI Prudential Equity & Debt Fund
                                           related instruments
                                           An open ended scheme investing in Equity, Debt, Gold/Gold ETF/units of REITs &
ICICI Prudential Multi-Asset Fund
                                           InvITs and other asset classes as may be permitted from time to time.

  Scheme Name                              Type of Scheme

                                           An open ended fund of funds scheme investing in equity oriented schemes, debt
  ICICI Prudential Asset Allocator Fund
                                           oriented schemes and gold ETFs/schemes.
                                                                                                                            51
Our Debt Schemes
    Scheme Name                                                                     Type of Scheme
                                                                                    An open ended ultra-short term debt scheme investing in instruments such that the Macaulay
      ICICI Prudential Ultra Short Term Fund
                                                                                    duration of the portfolio is between 3 months and 6 months.
                                                                                    An open ended short term debt scheme investing in instruments such that the Macaulay
      ICICI Prudential Short Term Fund
                                                                                    duration of the portfolio is between 1 Year and 3 Years.
                                                                                    An open ended medium term debt scheme investing in instruments such that the Macaulay
      ICICI Prudential Medium Term Bond Fund                                        duration of the portfolio is between 3 Years and 4 Years. The Macaulay duration of the portfolio
                                                                                    is 1 Year to 4 years under anticipated adverse situation.
      ICICI Prudential Credit Risk Fund                                             An open ended debt scheme predominantly investing in AA and below rated corporate bonds.

                                                                                    An open ended debt scheme predominantly investing in floating rate instruments (including
      ICICI Prudential Floating Interest Fund
                                                                                    fixed rate instruments converted to floating rate exposures using swaps/derivatives).

      ICICI Prudential All Seasons Bond Fund                                        An open ended dynamic debt scheme investing across duration.

      ICICI Prudential Savings Fund                                                 An open ended debt scheme with Macaulay Duration between 6 - 12 months
                                                                                    An open ended debt scheme predominantly investing in Debt instruments of banks, Public
      ICICI Prudential Banking & PSU Debt Fund
                                                                                    Sector Undertakings, Public Financial Institutions
      ICICI Prudential Corporate Bond Fund                                          An open ended debt scheme predominantly investing in AA+ or above rated securities.

      ICICI Prudential Money Market Fund                                            An open ended debt scheme investing in money market instruments
Macaulay Duration - The Macaulay duration is the weighted average term to maturity of the cash flows from a bond. The weight of each cash flow is determined by dividing the present value of the cash flow by the price.
                                                                                                                                                                                                                            52
Riskometers

ICICI Prudential Multi-Asset Fund is suitable for investors who are seeking*:

 Long term wealth creation
 An open ended scheme investing across asset classes.

*Investors should consult their financial advisers if in doubt about whether the product is suitable for them

ICICI Prudential Equity & Debt Fund is suitable for investors who are seeking*:

 Long term wealth creation solution
 A balanced fund aiming for long term capital appreciation and current income by investing in equity as well as fixed income securities.

*Investors should consult their financial advisers if in doubt about whether the product is suitable for them

ICICI Prudential Balanced Advantage Fund is suitable for investors who are seeking*:

 Long term wealth creation solution
 An equity fund that aims for growth by investing in equity and derivatives.
*Investors should consult their financial advisers if in doubt about whether the product is suitable for them

                                                                                                                                            53
Riskometers

ICICI Prudential Bluechip Fund is suitable for investors who are seeking*:

 Long term wealth creation
 An open ended equity scheme predominantly investing in large cap stocks.

*Investors should consult their financial advisers if in doubt about whether the product is suitable for them

ICICI Prudential Value Discovery Fund is suitable for investors who are seeking*:

 Long term wealth creation
 An open ended equity scheme following a value investment strategy

*Investors should consult their financial advisers if in doubt about whether the product is suitable for them

ICICI Prudential Large & Mid Cap Fund is suitable for investors who are seeking*:

 Long term wealth creation
 An open ended equity scheme investing in both largecap and mid cap stocks

*Investors should consult their financial advisers if in doubt about whether the product is suitable for them

                                                                                                                54
Riskometers

 ICICI Prudential Regular Savings Fund is suitable for investors who are seeking*:

  Medium to long term regular income solution
  A hybrid fund that aims to generate regular income through investments primarily in debt and money market instruments and long term
   capital appreciation by investing a portion in equity.

 *Investors should consult their financial advisers if in doubt about whether the product is suitable for them

 ICICI Prudential Credit Risk Fund is suitable for investors who are seeking*:
  Medium term savings
  A debt scheme that aims to generate income through investing predominantly in AA and below rated corporate bonds while
   maintaining the optimum balance of yield, safety and liquidity

 *Investors should consult their financial advisers if in doubt about whether the product is suitable for them

ICICI Prudential Medium Term Bond Fund is suitable for investors who are seeking*:

 Medium term savings
 A debt scheme that invests in debt and money market instruments with a view to maximize income while maintaining optimum balance
  of yield, safety and liquidity

*Investors should consult their financial advisers if in doubt about whether the product is suitable for them

                                                                                                                                         55
Riskometers
ICICI Prudential Smallcap Fund is suitable for investors who are seeking*:

 Long Term wealth creation
 An open ended equity scheme that seeks to generate capital appreciation by predominantly investing in equity and equity related
  securities of small cap companies.

*Investors should consult their financial advisers if in doubt about whether the product is suitable for them

ICICI Prudential Short Term Fund is suitable for investors who are seeking*:

 Short term income generation and capital appreciation solution
 A debt fund that aims to generate income by investing in a range of debt and money market instruments of various maturities.

*Investors should consult their financial advisers if in doubt about whether the product is suitable for them

ICICI Prudential All Seasons Bond Fund is suitable for investors who are seeking*:

 All duration savings
 A debt scheme that invests in debt and money market instruments with a view to maximize income while maintaining optimum balance
  of yield, safety and liquidity

*Investors should consult their financial advisers if in doubt about whether the product is suitable for them

                                                                                                                                     56
Riskometers
 ICICI Prudential Floating Interest Fund is suitable for investors who are seeking*:

  Short term savings
  An open ended debt scheme predominantly investing in floating rate instruments

 *Investors should consult their financial advisers if in doubt about whether the product is suitable for them

 ICICI Prudential Ultra Short Term Fund is suitable for investors who are seeking*:

  Short term regular income
  An open ended ultra-short term debt scheme investing in a range of debt and money market instruments

 *Investors should consult their financial advisers if in doubt about whether the product is suitable for them

ICICI Prudential Midcap Fund is suitable for investors who are seeking*:

 Long Term wealth creation
 An open-ended equity scheme that aims for capital appreciation by investing in diversified mid cap companies.

*Investors should consult their financial advisers if in doubt about whether the product is suitable for them

                                                                                                                  57
Riskometers
  ICICI Prudential India Opportunities Fund (The scheme is suitable for investors who are seeking*)

   Long term wealth creation

   An equity scheme that invests in stocks based on special situations theme.

  *Investors should consult their financial advisors if in doubt about whether the product is suitable for them.

ICICI Prudential Equity Savings Fund is suitable for investors who are seeking*:

 Long term wealth creation
 An open ended scheme that seeks to generate regular income through investments in fixed income securities, arbitrage and other
  derivative strategies and aim for long term capital appreciation by investing in equity and equity related instruments.

*Investors should consult their financial advisers if in doubt about whether the product is suitable for them

ICICI Prudential Multicap Fund is suitable for investors who are seeking*:

 Long term wealth creation
 An open ended equity scheme investing across largecap, mid cap and small cap stocks.

*Investors should consult their financial advisers if in doubt about whether the product is suitable for them

                                                                                                                                   58
Riskometers

ICICI Prudential US Bluechip Equity Fund is suitable for investors who are seeking*:

 Long term wealth creation
 An open ended equity scheme primarily investing in equity and equity related securities of companies listed on recognized stock
  exchanges in the United States of America
*Investors should consult their financial advisers if in doubt about whether the product is suitable for them

ICICI Prudential Savings Fund is suitable for investors who are seeking*:
     Short term savings
     An open ended low duration debt scheme that aims to maximize income by investing in debt and money market instruments while
      maintaining optimum balance of yield, safety and liquidity

*Investors should consult their financial advisers if in doubt about whether the product is suitable for them.

ICICI Prudential Banking & PSU Debt Fund is suitable for investors who are seeking*:

     Short term savings
    An open ended debt scheme predominantly investing in Debt instruments of banks, Public Sector Undertakings, Public Financial Institutions
     and Municipal Bonds
*Investors should consult their financial advisers if in doubt about whether the product is suitable for them.

                                                                                                                                                 59
Riskometers
ICICI Prudential Corporate Bond Fund is suitable for investors who are seeking*:

     Short term savings
     An open ended debt scheme predominantly investing in highest rated corporate bonds

*Investors should consult their financial advisers if in doubt about whether the product is suitable for them.

ICICI Prudential Money Market Fund is suitable for investors who are seeking*:

     Short term savings
     A money market scheme that seeks to provide reasonable returns, commensurate with low risk while providing a high level of liquidity

*Investors should consult their financial advisers if in doubt about whether the product is suitable for them.

 ICICI Prudential Asset Allocator Fund (An open ended fund of funds scheme investing in equity oriented schemes, debt
 oriented schemes and gold ETFs/ schemes) is suitable for investors who are seeking*:

• Long Term wealth creation
• An open ended fund of funds scheme investing in equity oriented schemes, debt oriented schemes and gold ETF/schemes.

*Investors should consult their financial advisors if in doubt about whether the product is suitable for them.

                                                                                                                                             60
Disclaimer For Mutual Funds

            Mutual Fund investments are subject to market risks, read all scheme related documents carefully.
All figures and other data given in this document are dated. The same may or may not be relevant at a future date. The AMC takes no responsibility of updating any data/information in this material
from time to time. The information shall not be altered in any way, transmitted to, copied or distributed, in part or in whole, to any other person or to the media or reproduced in any form, without
prior written consent of ICICI Prudential Asset Management Company Limited. Prospective investors are advised to consult their own legal, tax and financial advisors to determine possible tax,
legal and other financial implication or consequence of subscribing to the units of ICICI Prudential Mutual Fund. Past Performance may or may not be sustained in future.

Disclaimer: In the preparation of the material contained in this document, ICICI Prudential Asset Management Company Ltd. (the AMC) has used information that is publicly available, including
Budget speech and information developed in-house. The stock(s)/sector(s) mentioned in this slide do not constitute any recommendation and ICICI Prudential Mutual Fund may or may not have
any future position in this stock(s). Some of the material used in the document may have been obtained from members/persons other than the AMC and/or its affiliates and which may have
been made available to the AMC and/or to its affiliates. Information gathered and material used in this document is believed to be from reliable sources. The AMC however does not warrant the
accuracy, reasonableness and / or completeness of any information. We have included statements / opinions / recommendations in this document, which contain words, or phrases such as
“will”, “expect”, “should”, “believe” and similar expressions or variations of such expressions, that are “forward looking statements”. Actual results may differ materially from those suggested by
the forward looking statements due to risk or uncertainties associated with our expectations with respect to, but not limited to, exposure to market risks, general economic and political conditions
in India and other countries globally, which have an impact on our services and / or investments, the monetary and interest policies of India, inflation, deflation, unanticipated turbulence in
interest rates, foreign exchange rates, equity prices or other rates or prices etc. ICICI Prudential Asset Management Company Limited (including its affiliates), the Mutual Fund, The Trust and any
of its officers, directors, personnel and employees, shall not liable for any loss, damage of any nature, including but not limited to direct, indirect, punitive, special, exemplary, consequential, as
also any loss of profit in any way arising from the use of this material in any manner. Further, the information contained herein should not be construed as forecast or promise or investment
advice. The recipient alone shall be fully responsible/are liable for any decision taken on this material.

                                                                                                                                                                                                           61
You can also read