COVID-19 Pandemic and City-Level Nitrogen Dioxide (NO2) Reduction for Urban Centres of India
←
→
Page content transcription
If your browser does not render page correctly, please read the page content below
Journal of the Indian Society of Remote Sensing (July 2020) 48(7):999–1006
https://doi.org/10.1007/s12524-020-01130-7 (0123456789().,-volV)(0123456789().
                                                                          ,- volV)

    RESEARCH ARTICLE

COVID-19 Pandemic and City-Level Nitrogen Dioxide (NO2) Reduction
for Urban Centres of India
Asfa Siddiqui1       •   Suvankar Halder1 • Prakash Chauhan1 • Pramod Kumar1

Received: 28 May 2020 / Accepted: 15 July 2020 / Published online: 22 July 2020
Ó Indian Society of Remote Sensing 2020

Abstract
Air pollution poses a grave health risk and is a matter of concern for researchers around the globe. Toxic pollutants like
nitrogen dioxide (NO2) is a result of industrial and transport sector emissions and need to be analysed at the current
scenario. After the world realised the effect of COVID-19 pandemic, countries around the globe proposed complete
lockdown to contain the spread. The present research focuses on analysing the gaseous pollution scenarios, before and
during lockdown through satellite (Sentinel-5P data sets) and ground-based measurements (Central Pollution Control
Board’s Air Quality Index, AQI) for 8 five-million plus cities in India (Delhi, Ahmedabad, Kolkata, Mumbai, Hyderabad,
Chennai, Bengaluru and Pune). The long-term exposure to NO2 was also linked to pandemic-related mortality cases across
the country. An average of 46% reduction in average NO2 values and 27% improvement in AQI was observed in the eight
cities during the first lockdown phase with respect to pre-lockdown phase. Also, 53% of Corona positive cases and 61% of
fatality cases were observed in the eight major cities of the country alone, coinciding with locations having high long-term
NO2 exposure.

Keywords COVID-19  Air pollution  NO2  India  Lockdown

Introduction                                                                         hence, it is also known as novel coronavirus or SARS-
                                                                                     CoV-2. Some factors responsible for the susceptibility to
The most recently discovered coronavirus disease 2019                                novel coronavirus are diagnosed as history of diabetes,
(COVID-19) was declared a global public health emer-                                 heart ailments, exposure to smoking and hypertension
gency on January 30, 2020, and a global pandemic on                                  (Jiang et al. 2020; Rodriguez-Morales et al. 2020). As of
March 11, 2020, by the World Health Organization (2020).                             May 18, 2020, the world has recorded 53, 70,375 cases and
As indicated, the contagious nature of the virus is a matter                         3, 44,454 deaths with the highest mortality in the USA;
of grave concern worldwide and has shown a manifold                                  India has witnessed a total of 96,192 cases and 3039
increase since its inception in Wuhan, Hubei province in                             fatalities (WHO 2020). Preliminary analysis reveals that
China (Read et al. 2014). When the first COVID-19 patient                            the transmission rate for India is 1.7 (where the value is
was diagnosed in India on January 30, 2020, the world had                            ranging from 1.5 to 3.5 worldwide) (Ghosh et al. 2020).
already crossed the count of 8096 cases worldwide, i.e.                              The respiratory illness symptoms and mortality due to
more than the cases associated with severe respiratory                               prolonged exposure to gaseous pollutants like nitrogen
syndrome (SARS) in 2003 (WHO 2004). COVID-19 is a                                    dioxide (NO2), sulphur dioxide (SO2), particulate matter
respiratory disorder accompanied by symptoms of fever,                               (PM), carbon monoxide (CO), etc., have been reported
dry cough and breathing difficulty subsequently. The virus                           earlier in India and around the world in several studies
was not previously associated with disease in humans;                                (Abbey et al. 1995; Abbey and Burchette 1996; Balakr-
                                                                                     ishnan et al. 2019; Beeson et al. 1998; David et al. 2019;
                                                                                     Faustini et al. 2014; He et al. 2020; Liu et al. 2013; Ogen
& Asfa Siddiqui
  asfa.aas@gmail.com                                                                 2020; Siddique et al. 2011).
                                                                                        The Government of India took note of worsening situ-
1
     Indian Institute of Remote Sensing, Indian Space Research                       ation worldwide and to contain the epidemic’s effect,
     Organisation, Dehradun, Uttarakhand 248001, India

                                                                                                                                      123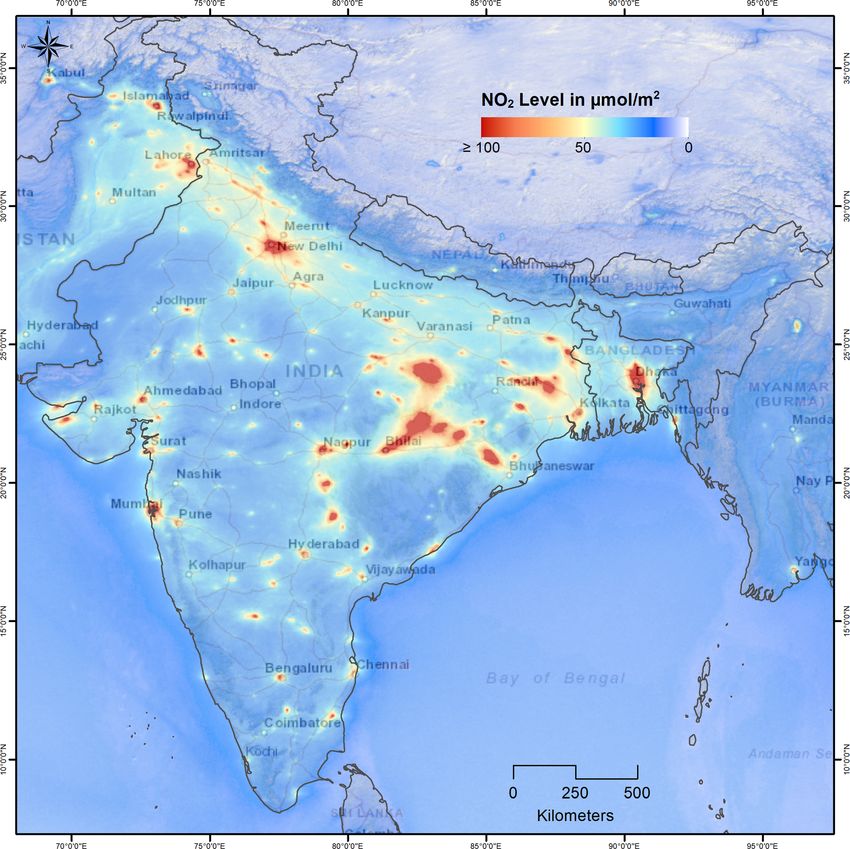
1000                                                          Journal of the Indian Society of Remote Sensing (July 2020) 48(7):999–1006

imposed the first nationwide public curfew on March 22,            Earth Engine API (Gorelick et al. 2017) and various gov-
2020. It was followed by lockdowns in three phases, viz.           ernment websites dispensing information related to
(1) March 24 to April 14, 2020, (2) April 15 to May 3,             COVID-19-related deaths.
2020, and (3) May 4 to May 17, 2020. The effect of                    The mean values of NO2 are analysed for pre-lockdown
lockdown is quite evident in the first two phases in terms of      period (March 11–March 23, 2020), lockdown-1 period
considerable reduction in the growth rate of the disease           (LD 1) (March 24–April 7, 2020) and lockdown-2 period
(Myllyvirta and Dahiya 2020). The effect could also be             (LD 2) (April 8–April 21, 2020) scenarios using Arc GIS
noticed on environmental factors around the globe in terms         10.1 platform. 8 five-million plus cities were selected for
of decreased haze, improvement in air and water quality            detailed analysis, viz. Delhi, Mumbai, Kolkata, Chennai,
exuded by limited anthropogenic activities in transport,           Bengaluru, Pune, Ahmedabad and Hyderabad. The urban
industrial and domestic sectors (Muhammad et al. 2020).            boundary of the city was delineated using a city clustering
   The use of satellite remote sensing for understanding the       algorithm for calculating the mean, maximum and standard
growing air pollution levels within the tropospheric column        deviation for the concentration of the pollutant during the
of Earth has been demonstrated earlier (Liji Mary David            three phases. For analysing the mortality cases due to the
and Nair 2013; Fishman et al. 2008; Martin 2008; Sellitto          pandemic, the temporal mean of NO2 was obtained using
et al. 2011). However, canopy-level near-surface air pol-          TROPOMI data for the period from March 2018 to
lution is seen to have a more adverse impact on human              February 2020. The maximum values of NO2 and deaths
health globally, especially in developing countries. The           were extracted corresponding to each district. Since city-
level of ambient air pollution is poorer in countries such as      level mortality information was not available, the maxi-
Nigeria, Bangladesh, India, Pakistan, China, far exceeding         mum value of NO2 within the district was assumed to
the standards set by World Health Organization (WHO)               represent the city. It was observed that the 8 five-million
while leading towards numerous deaths (nearly 4.9 million)         plus cities had more concentration of the pollutant as
annually, from all countries around the globe (Health              compared to the other fringe areas within the district.
Effects Institute 2019). In India, numerous researches have
indicated very high pollutant concentration over the Indo-
Gangetic Plain (Acharya and Sreekesh 2013; Prasad et al.           Results
2012; Sellitto et al. 2011; Shastri et al. 2017). The objective
of this research was to analyse the effect of lockdown on          Long-term analysis of tropospheric column NO2 (March
improving the levels of air pollution in various cities across     2018–February 2020) (Fig. 1) over India indicates hot
India using satellite-derived spatiotemporal data sets and         spots of NO2 at locations dominated by urbanisation or
ground-based measurements. Additionally, the relationship          presence of thermal power plants (TPPs) (both inland and
was explored between mortality and air pollution levels            coastal). The major emission hot spots shown in TRO-
within the selected cities.                                        POMI trop. column NO2 distribution coincide with thermal
                                                                   power plants of capacity more than 2000 MW. The hot
                                                                   spots of NO2 were reported from most urbanised locations
Materials and Methods                                              or the locations dominated by the presence of thermal
                                                                   power plants and other industries during the pre-lockdown
The long-term status of NO2 as a pollutant and the spatial         period. They were identified in Orissa, Chhattisgarh,
distribution of tropospheric NO2 for before and during             Madhya Pradesh and Jharkhand during the lockdown
COVID-19 lockdown scenarios were derived using the                 phase, since they were operational for catering to the
European Space Agency’s (ESA) Sentinel-5 precursor                 electricity demand of the country. The increased concen-
satellite data available through TROPOspheric Monitoring           tration of pollution can be attributed to domestic combus-
Instrument (TROPOMI). Central Pollution Control Board’s            tion, agricultural waste burning, incomplete fuel
(CPCB) Continuous Ambient Air Quality Monitoring                   combustion in the transport sector, industrial effluents
System (CAAQMS) data set was used to study the effect of           emitted directly in the atmosphere, power generation,
lockdown on Air Quality Index (AQI) of Indian cities. The          construction activity, etc. to name the most salient factors
status of mobility and reduction in traffic-induced pollution      associated with the anthropogenic activities. These factors
were recorded using Google-based mobility index report             have contributed to a large extent to increasing asthmatic
(Google 2020). Additionally, to understand the effect of           and other respiratory symptoms amongst masses.
long term exposure of NO2 on human health, COVID-19                   A detailed analysis of the NO2 levels for before and
positive cases and number of deaths was obtained for all           during lockdown indicates a 30–50% reduction in the
districts around the country of India as on 18 May 2020.           levels of NO2 across the country. Very high NO2 val-
The data set has been retrieved and analysed using Google          ues [ 100 lmol/m2 were observed in districts such as

123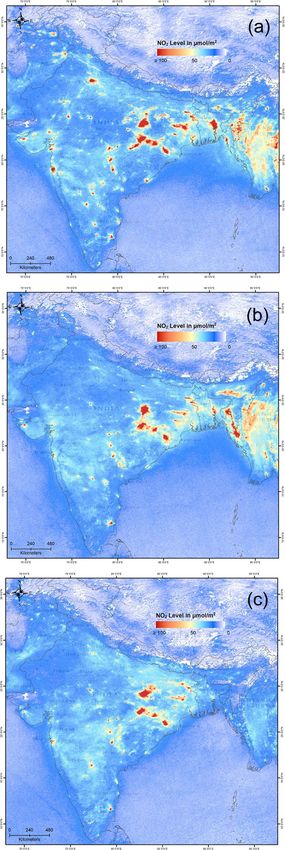
Journal of the Indian Society of Remote Sensing (July 2020) 48(7):999–1006 1001
Fig. 1 Long-term NO2 levels observed from Sentinel-5P data (March 2018–February 2020)
Sonbhadra (Uttar Pradesh), Singrauli (Madhya Pradesh), values as observed through Sentinel data can be seen in
several locations in Chhattisgarh (Korba, Balrampur, Delhi where the maximum and average values dropped by
Bilaspur, Champa, Surajpur, Koriya), West Bengal 70% followed by Bengaluru (63%), Mumbai (57%),
(Bankura, Murshidabad, Bardhaman, Malda), Odisha Ahmedabad (56%), Hyderabad (49%), Pune (37%), Kolk-
(Jharsuguda, Sambalpur, Angul, Dhenkanal), Cuddalore in ata (34%) and Chennai (33%) in maximum NO2 values
Tamil Nadu, Singhbhum in Bihar, Bellary in Karnataka, (Table 2).
etc., majority being thermal power plant locations in India The Air Quality Index (AQI) reported by CPCB sug-
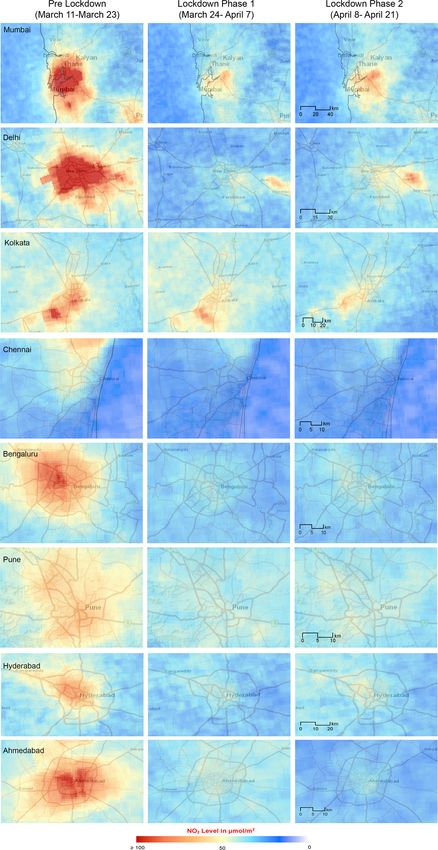
connected through central grid. Cities including Delhi, gests 27% average improvement in air quality cumulatively
Mumbai, Ahmedabad, Kolkata, etc., have shown a con- for the eight major cities of India (five million plus cities)
siderable decrease in the levels of NO2 as indicated in alone (http://www.cpcbenvis.nic.in/) (Table 1). The
Tables 1 and 2 and Figs. 2, 3 and 4. The major reduction
123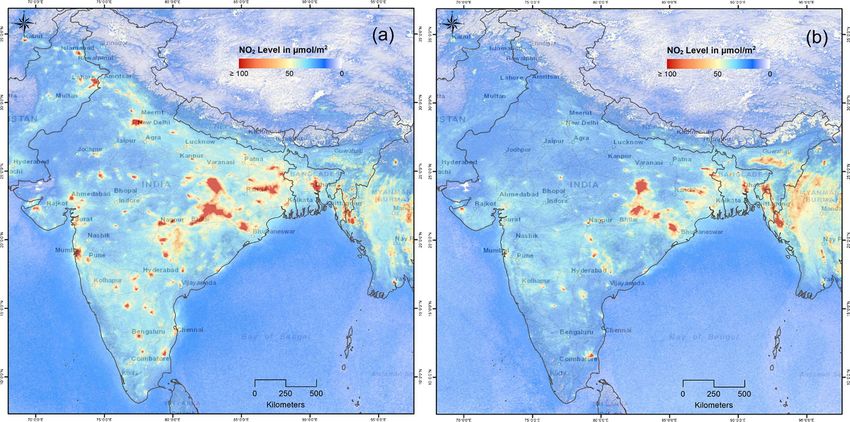
1002                                                              Journal of the Indian Society of Remote Sensing (July 2020) 48(7):999–1006

Table 1 Air Quality Index of
                                   Sl. no.   Name           Pre-lockdown        During lockdown (Phase 1)        During lockdown (Phase 2)
major cities in India for pre-
lockdown and during-lockdown       1         Delhi          150                  80                              113
(1 and 2) scenarios. Source:
Central Pollution Control          2         Ahmedabad      106                  91                               90
Board, State Pollution Control     3         Kolkata        121                 105                               62
Boards of respective states of     4         Mumbai         105                  74                               76
cities (https://app.cpcbccr.com/
                                   5         Hyderabad       77                  71                               63
AQI_India/)
                                   6         Chennai         63                  51                               44
                                   7         Bengaluru       80                  57                               56
                                   8         Pune            92                  55                               55

Table 2 Observed values of
                                   Sl no.     Name                Pre LD                     During-LD Phase 1          During-LD Phase 2
NO2 (Sentinel-5 P) for the pre-
                                                                  Max (mean ± SD)            Max (mean ± SD)            Max (mean ± SD)
lockdown and during-lockdown
(1 and 2) scenarios (in lmol/      1          Delhi               163.3 (116.2 ± 24.3)       49.3 (35.3 ± 4.5)          53.4 (41.8 ± 4.4)
m2). Source: Sentinel-5P
satellite data analysis            2          Ahmedabad           103.7 (84.7 ± 10.1)        45.1 (38.7 ± 2.4)          36.8 (30.6 ± 2.6)
                                   3          Kolkata              93.3 (63.2 ± 13.5)        61.4 (49.2 ± 5.1)          57.6 (44.4 ± 5.6)
                                   4          Mumbai              141.7 (84.1 ± 23.1)        60.5 (37.6 ± 5.2)          63.6 (38.5 ± 9.1)
                                   5          Hyderabad            82.7 (62.1 ± 9.3)         42.1 (35.3 ± 3.8)          47.3 (39.4 ± 3.8)
                                   6          Chennai              55.6 (34.1 ± 10)          37.4 (21.2 ± 4.1)          34.4 (21.4 ± 4.0)
                                   7          Bengaluru           101.4 (67.1 ± 15.1)        37.7 (32.3 ± 2.6)          41.8 (33.7 ± 3.4)
                                   8          Pune                 70.7 (59.6 ± 4.2)         44.2 (38.8 ± 2.3)          45.9 (38.8 ± 2.5)

Fig. 2 NO2 level during lockdown period from March 24 to April 7, 2020, for a 2019, b 2020

primary reason behind this reduction is restricted human               reduction is the median value for corresponding weekday
movement through the motorised mode of transport.                      during January 3–February 6, 2020, and is provided.
   Google-based tracking report on mobility from March                 Citywide detailed analysis is also provided in the report for
21 to May 02, 2020, also indicates a decrease of 85% in                better understanding. In Delhi, almost 80% of the total
retail and recreation sector and 64% in the transportation             pollution is contributed through the transport sector and
sector in India. The baseline value used to calculate the              saw a major drop as indicated through various reports like

123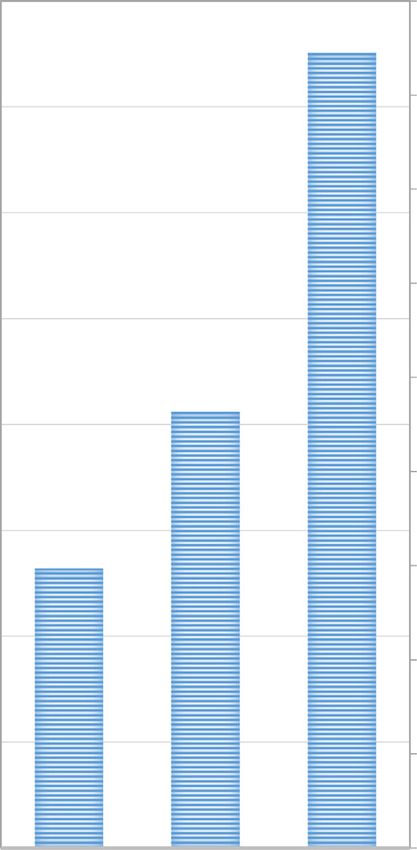
Journal of the Indian Society of Remote Sensing (July 2020) 48(7):999–1006                                                            1003

                                                                       b Fig. 3 Observed values of NO2 for a pre-lockdown from March 11 to
                                                                         24, 2020; during lockdown b Phase 1 from March 24 to April 7, 2020
                                                                         c Phase 2 from April 8 to April 21, 2020

                                                                         the Automotive Research Association of India (ARAI)
                                                                         and the Energy and Resources Institute (TERI). As per
                                                                         Central Pollution Control Board (CPCB) and Ministry of
                                                                         Environment and Forests (MoEF), the major share of air
                                                                         pollution was attributed to the motorised vehicles (* 70%)
                                                                         (Agarwal et al. 2014). Also, termination in construction
                                                                         activities led to reduced dust suspension. Another major
                                                                         reason is the closure of industrial activities around the
                                                                         major cities, which is also a major source of air pollution,
                                                                         particularly NO2. The mixing height increased in several
                                                                         cities, and it helped in vertical dispersion of pollutants,
                                                                         thereby reducing the level of pollution.
                                                                            It is also evident that the lockdown time, specifically
                                                                         between March 24 and April 7, 2020, could lower the air
                                                                         pollution levels significantly (* 46%) which rose to by
                                                                         5–10% in the case study cities of India during mid-April
                                                                         (Table 2, Figs. 2, 3). The reasons could be due to agri-
                                                                         cultural waste burning in northern parts of Pakistan and
                                                                         India, which contributed to this elevated effect. It was
                                                                         observed that several power plants were also operational
                                                                         during the lockdown in Madhya Pradesh, Orissa, Chhat-
                                                                         tisgarh and few other states in the country. The onset of dry
                                                                         conditions due to increasing air temperature after mid-
                                                                         April also led to dust from the Gulf area and elevated the
                                                                         air pollution scenario in the country, primarily in the north
                                                                         in terms of particulate matter (Central Pollution Control
                                                                         Board (CPCB) 2020).
                                                                            The relationship of NO2 with the rate of mortality in
                                                                         India due to COVID-19 pandemic revealed that higher
                                                                         mortality was reported in areas which had a long-term
                                                                         exposure to finer gaseous pollutants (particle size \ 2.5
                                                                         nm) like NO2. It corroborates the fact that long-term
                                                                         exposure to NO2 has weakened the immune system and
                                                                         also had profound effect on inflammation of the lungs.
                                                                         Nearly, 53% of total COVID-19 positive cases and 61% of
                                                                         deaths (1859 deaths out of total 3039 deaths in India) were
                                                                         reported in the eight major cities of India as on May 18,
                                                                         2020 (Fig. 5) (https://www.covid19india.org/). COVID-19-
                                                                         related deaths are recorded in 85 districts out of a total of
                                                                         720 districts in India, the majority of which were reported
                                                                         in major urban centres of the country. The highest deaths
                                                                         were reported in Mumbai, Ahmedabad, Pune, Kolkata and
                                                                         Delhi. Additionally, majority cases were also reported in
                                                                         these major cities indicating a severe impact of air pollu-
                                                                         tion on human health. Therefore, considering the associa-
                                                                         tion of high NO2 concentration with respiratory mortality
                                                                         (Chen et al. 2007; Ogen 2020), it can be concluded that
                                                                         exposure to toxic components within the air proves fatal in

                                                                                                                                123
1004 Journal of the Indian Society of Remote Sensing (July 2020) 48(7):999–1006 Fig. 4 NO2 levels in Indian cities during pre-lockdown and during-lockdown (1 and 2) scenarios 123
Journal of the Indian Society of Remote Sensing (July 2020) 48(7):999–1006 1005
1600 45000 analysis revealed a reduction in the values when compared
1503 with status in 2019 (first lockdown period) and when
analysed with respect to pre-lockdown scenario (46%
40000
1400 reduction in LD 1) which further rose nominally in the LD-
2 period (5–10%) for the 8 five-million plus cities alone.
35000
AQI for the major cities also showed an improvement of
No. of COVID-19 reported positive cases
No. of reported deaths due to COVID-19
1200 27% during LD-1 and 29% during LD-2 due to reduction in
usage of motorised vehicles and nonoperational thermal
30000 power plants. It was also observed that 53% of Corona
1000 positive cases and 61% of fatality cases were observed in
the eight major cities of the country alone, coinciding with
25000 locations having high long-term NO2 exposure.
824
800 The research could have incorporated detailed analysis
of all the cities and various other factors leading to high
20000
mortality rates in bigger cities including Delhi, Ahmed-
600 abad, Kolkata, Mumbai, etc. Factors including testing rate,
528 rate of mortality, urbanisation and congestion parameters,
15000
etc., could not be included due to paucity of information
400
during pandemic times. Certainly, the lockdown across the
10000 globe and in the Indian subcontinent has helped the envi-
ronment to regain and to minimise the imbalances.
200
5000 Acknowledgements The authors are thankful to the European Space
Agency (ESA) and the National Aeronautics and Space Administra-
tion (NASA) for providing requisite data sets (TROPOMI Sentinel-5P
0 0
and Aura OMI) for the analysis. We are grateful to Mr. Nadeem Alam
0-50 50-100 100-above and Mr. Ambadas B. Maske for providing requisite support during the
analysis of secondary data from CPCB.
Concentration of NO2 (µmol/m2) by range
Fig. 5 Concentration of NO2, reported cases and deaths due to Covid- Compliance with Ethical Standards
19 as on May 18, 2020
Conflict of interest The author declares no known competing finan-
cial interests or personal relationships that could have appeared to
fighting such diseases and could be one of the major factors influence the work reported in the paper.
for elevating the risk of air pollution-induced mortality.
The risk of death in a scenario of cytokine storm syndrome
due to inflammatory lungs can lead to death, as seen in References
cases worldwide (Arden et al. 2002; Beeson et al. 1998;
Blomberg et al. 1999; Bowatte et al. 2017; Chen et al. Abbey, D. E., & Burchette, R. J. (1996). Relative power of alternative
2007; Patrick 2016). It is also vital to understand that ambient air pollution metrics for detecting chronic health effects
in epidemiological studies. Environmetrics, 7, 453–470.
mortality during lockdown scenario may also be dependent Abbey, D. E., Hwanc, B. J., Burchette, R. J., Vancuren, T., & Mills, P.
upon total COVID-19 tested cases and total reported cases. K. (1995). Estimated long-term ambient concentrations of pm,
However, due to restricted and unavailable information, and development of respiratory symptoms in a nonsmoking
such detailed analysis could not be performed. population. Archives of Environmental Health, 50(2), 139–152.
https://doi.org/10.1080/00039896.1995.9940891.
Acharya, P., & Sreekesh, S. (2013). Seasonal variability in aerosol
optical depth over India: A spatio-temporal analysis using the
Conclusions MODIS aerosol product. International Journal of Remote
Sensing, 34(13), 4832–4849. https://doi.org/10.1080/01431161.
2013.782114.
The research aimed at studying the tropospheric NO2 levels Agarwal, O. P., Rathi, S., Kalra, K., Gupta, M., Pal, S., Lakshmi, A.,
in three phases for India (pre-lockdown and two during- et al. (2014). Review of urban transport in India. Indian Urban
lockdown scenarios of 2-week each duration). Long-term Transport, 79.
NO2 spatial analysis using TROPOMI Sentinel-5P data sets Arden, C., Burnett, R. T., Thun, M. J., Calle, E. E., Krewski, D., Ito,
K., et al. (2002). Lung cancer, cardiopulmonary mortality, and
could highlight the hot spots of higher concentration due to long-term exposure to fine particulate air pollution. Journal of
varied anthropogenic (domestic, vehicular and industrial) American Medical Association, 287(9), 132–1141.
and natural reasons. The 2-week mean value of NO2 spatial
1231006 Journal of the Indian Society of Remote Sensing (July 2020) 48(7):999–1006
Balakrishnan, K., Dey, S., Gupta, T., Dhaliwal, R. S., Brauer, M., disease 2019 (COVID-19). Journal of General Internal Medi-
Cohen, A. J., et al. (2019). The impact of air pollution on deaths, cine. https://doi.org/10.1007/s11606-020-05762-w.
disease burden, and life expectancy across the states of India: Liu, H. Y., Rn, A. B., Schindler, M., Sharma, M., Behera, S. N.,
The Global Burden of Disease Study 2017. The Lancet Planetary Katiyar, K., et al. (2013). Respiratory disease in relation to
Health, 3(1), e26–e39. https://doi.org/10.1016/S2542- outdoor air pollution in Kanpur, India. Archives of Environmen-
5196(18)30261-4. tal and Occupational Health, 68(4), 204–217. https://doi.org/10.
Beeson, W. L., Abbey, D. E., & Knutsen, S. F. (1998). Long-term 1080/19338244.2012.701246.
concentrations of ambient air pollutants and incident lung cancer Martin, R. V. (2008). Satellite remote sensing of surface air quality.
in California adults: Results from the AHSMOG study. Envi- Atmospheric Environment, 42(34), 7823–7843. https://doi.org/
ronmental Health Perspectives, 106(12), 813–822. 10.1016/j.atmosenv.2008.07.018.
Blomberg, A., Krishna, M. T., Helleday, R., Söderberg, M., Ledin, Muhammad, S., Long, X., & Salman, M. (2020). COVID-19
M.-C., Kelly, F. J., et al. (1999). Persistent airway inflammation pandemic and environmental pollution: A blessing in disguise?
but accommodated antioxidant and lung function responses after Science of the Total Environment, 728, 138820. https://doi.org/
repeated daily exposure to nitrogen dioxide. American Journal of 10.1016/j.scitotenv.2020.138820.
Respiratory and Critical Care Medicine, 159(2), 536–543. Myllyvirta, L., & Dahiya, S. (2020). Air quality improvements due to
Bowatte, G., Erbas, B., Lodge, C. J., Knibbs, L. D., Gurrin, L. C., COVID 19 lock-down in India. https://energyandcleanair.org/.
Marks, G. B., et al. (2017). Traffic-related air pollution exposure Ogen, Y. (2020). Assessing nitrogen dioxide (NO2) levels as a
over a 5-year period is associated with increased risk of asthma contributing factor to coronavirus (COVID-19) fatality. Science
and poor lung function in middle age. The European Respiratory of the Total Environment. https://doi.org/10.1016/j.scitotenv.
Journal. https://doi.org/10.1183/13993003.02357-2016. 2020.138605.
Central Pollution Control Board (CPCB). (2020). Impact of lockdown Patrick, D. L. (2016). Health & environmental effects of air pollution
on air quality. New Delhi: CPCB. health (pp. 1–3). http://www.epa.gov/globalwarming/.
Chen, T. M., Gokhale, J., Shofer, S., & Kuschner, W. G. (2007). Prasad, A. K., Singh, R. P., & Kafatos, M. (2012). Influence of coal-
Outdoor air pollution: Nitrogen dioxide, sulfur dioxide, and based thermal power plants on the spatial-temporal variability of
carbon monoxide health effects. American Journal of the tropospheric NO2 column over India. Environmental Monitoring
Medical Sciences, 333(4), 249–256. https://doi.org/10.1097/ and Assessment, 184(4), 1891–1907. https://doi.org/10.1007/
MAJ.0b013e31803b900f. s10661-011-2087-6.
David, L. M., & Nair, P. R. (2013). Tropospheric column O3 and NO2 Read, J. M., Bridgen, Jessica R. E., Cummings, Derek A. T., &
over the Indian region observed by ozone monitoring instrument Antonia Ho, C. P. J. (2014). Novel coronavirus 2019-nCoV:
(OMI): Seasonal changes and long-term trends. Atmospheric Early estimation of epidemiological parameters and epidemic
Environment, 65, 25–39. https://doi.org/10.1016/j.atmosenv. predictions. Antimicrobial Agents and Chemotherapy, 58(12),
2012.09.033. 7250–7257. https://doi.org/10.1101/2020.01.23.20018549.
David, L. M., Ravishankara, A. R., Kodros, J. K., Pierce, J. R., Rodriguez-Morales, A. J., Katterine Bonilla-Aldana, D., Tiwari, R.,
Venkataraman, C., & Sadavarte, P. (2019). Premature mortality Sah, R., Rabaan, A. A., & Dhama, K. (2020). Covid-19, an
due to PM2.5 over India: Effect of atmospheric transport and emerging coronavirus infection: Current scenario and recent
anthropogenic emissions. GeoHealth, 3(1), 2–10. https://doi.org/ developments—An overview. Journal of Pure and Applied
10.1029/2018GH000169. Microbiology. https://doi.org/10.22207/JPAM.14.1.02.
Faustini, A., Rapp, R., & Forastiere, F. (2014). Nitrogen dioxide and Sellitto, P., Bojkov, B. R., Liu, X., Chance, K., & Del Frate, F.
mortality: Review and meta-analysis of long-term studies. (2011). Tropospheric ozone column retrieval at northern mid-
European Respiratory Journal, 44(3), 744–753. https://doi.org/ latitudes from the ozone monitoring instrument by means of a
10.1183/09031936.00114713. neural network algorithm. Atmospheric Measurement Tech-
Fishman, J., Bowman, K. W., Burrows, J. P., Richter, A., Chance, K. niques, 4(11), 2375–2388. https://doi.org/10.5194/amt-4-2375-
V., Edwards, D. P., et al. (2008). Remote sensing of tropospheric 2011.
pollution from space. Bulletin of the American Meteorological Shastri, H., Barik, B., Ghosh, S., Venkataraman, C., & Sadavarte, P.
Society, 89(6), 805–821. https://doi.org/10.1175/ (2017). Flip flop of day–night and summer–winter surface urban
2008BAMS2526.1. heat island intensity in India. Scientific Reports, 7, 1–8. https://
Ghosh, P., Ghosh, R., & Chakraborty, B. (2020). COVID-19 in India: doi.org/10.1038/srep40178.
State-wise analysis and prediction. medRxiv. https://doi.org/10. Siddique, S., Ray, M. R., & Lahiri, T. (2011). Effects of air pollution
1101/2020.04.24.20077792. on the respiratory health of children: A study in the capital city
Google. (2020). COVID-19 community mobility report. https://www. of India. Air Quality, Atmosphere and Health, 4(2), 95–102.
google.com/covid19/mobility/. https://doi.org/10.1007/s11869-010-0079-2.
Gorelick, N., Hancher, M., Dixon, M., Ilyushchenko, S., Thau, D., & WHO. (2004). WHO guidelines for the global surveillance of severe
Moore, R. (2017). Google Earth engine: Planetary-scale geospa- acute respiratory syndrome (SARS) updated recommendations,
tial analysis for everyone. Remote Sensing of Environment, 202, October 2004. Department of Communicable Disease Surveil-
18–27. https://doi.org/10.1016/j.rse.2017.06.031. lance and Response, (October), 40. http://www.who.int/csr/
He, M. Z., Kinney, P. L., Li, T., Chen, C., Sun, Q., Ban, J., et al. resources/publications/WHO_CDS_CSR_ARO_2004_1.pdf.
(2020). Short- and intermediate-term exposure to NO2 and World Health Organization. (2020). Coronavirus disease (p. 2633).
mortality: A multi-county analysis in China. Environmental Geneva: World Health Organization. https://doi.org/10.1001/
Pollution, 261, 114165. https://doi.org/10.1016/j.envpol.2020. jama.2020.2633.
114165.
Health Effects Institute. (2019). State of global air 2019. Boston.
https://www.stateofglobalair.org/sites/default/files/soga_2019_ Publisher’s Note Springer Nature remains neutral with regard to
report.pdf. jurisdictional claims in published maps and institutional affiliations.
Jiang, F., Deng, L., Zhang, L., Cai, Y., Cheung, C. W., & Xia, Z.
(2020). Review of the clinical characteristics of coronavirus
123You can also read