Climate impact of aircraft-induced cirrus assessed from satellite observations before and during COVID-19
←
→
Page content transcription
If your browser does not render page correctly, please read the page content below
LETTER • OPEN ACCESS

Climate impact of aircraft-induced cirrus assessed from satellite
observations before and during COVID-19
To cite this article: Johannes Quaas et al 2021 Environ. Res. Lett. 16 064051

View the article online for updates and enhancements.

                               This content was downloaded from IP address 46.4.80.155 on 18/09/2021 at 21:54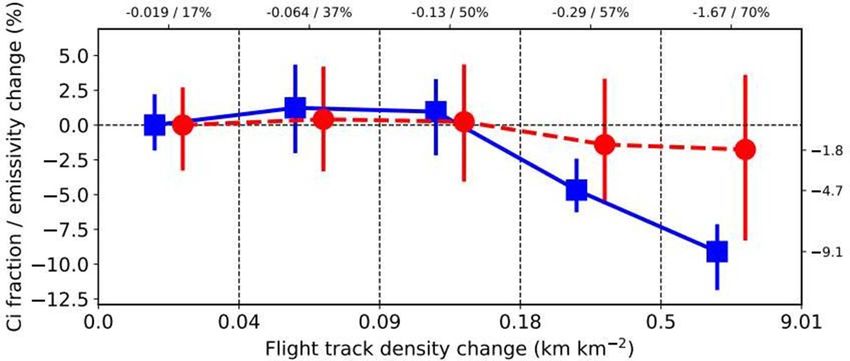
Environ. Res. Lett. 16 (2021) 064051 https://doi.org/10.1088/1748-9326/abf686
LETTER
Climate impact of aircraft-induced cirrus assessed from satellite
OPEN ACCESS
observations before and during COVID-19
RECEIVED
26 November 2020 Johannes Quaas1,∗, Edward Gryspeerdt2, Robert Vautard3 and Olivier Boucher3
REVISED 1
15 March 2021 Institute for Meteorology, Universität Leipzig, Leipzig, Germany
2
Space and Atmospheric Physics Group, Imperial College London, London, United Kingdom
ACCEPTED FOR PUBLICATION 3
Institut Pierre-Simon Laplace, Sorbonne Université/CNRS, Paris, France
9 April 2021 ∗
Author to whom any correspondence should be addressed.
PUBLISHED
2 June 2021 E-mail: johannes.quaas@uni-leipzig.de
Keywords: aviation-induced cirrus, aviation climate forcing, COVID-19
Original content from
this work may be used Supplementary material for this article is available online
under the terms of the
Creative Commons
Attribution 4.0 licence.
Any further distribution Abstract
of this work must
maintain attribution to
Aircraft produce condensation trails, which are thought to increase high-level cloudiness under
the author(s) and the title certain conditions. However the magnitude of such an effect and whether this contributes
of the work, journal
citation and DOI. substantially to the radiative forcing due to the aviation sector remain uncertain. The very
substantial, near-global reduction in air traffic in response to the COVID-19 outbreak offers an
unprecedented opportunity to identify the anthropogenic contribution to the observed cirrus
coverage and thickness. Here we show, using an analysis of satellite observations for the period
March–May 2020, that in the 20% of the Northern Hemisphere mid-latitudes with the largest air
traffic reduction, cirrus fraction was reduced by ∼9 ± 1.5% on average, and cirrus emissivity was
reduced by ∼2 ± 5% relative to what they should have been with normal air traffic. The changes
are corroborated by a consistent estimate based on linear trends over the period 2011–2019. The
change in cirrus translates to a global radiative forcing of 61 ± 39 mW m−2 . This estimate is
somewhat smaller than previous assessments.
1. Introduction material (available online at stacks.iop.org/ERL/16/
064051/mmedia). In a refined study using a more
The fact that aviation leads to condensation trails complex cloud scheme, Bock and Burkhardt [6]
(or contrails) that may create artificial cirrus and revised this estimate to 56 mW m−2 for 2006, imply-
potentially alter naturally occurring cirrus has been ing a forcing of 106 mW m−2 in 2019. Although they
well documented [1–3]. The former occurs through are based on physical processes, such models remain
the spreading of line-shaped contrails into larger, very difficult to validate against observations. Also,
amorphous cirrus while the latter is due to dehyd- the model does not necessarily include all mechan-
ration of the upper atmosphere and the impact of isms by which aircraft impacts high-level cloudiness.
the emitted aerosol on the cirrus properties. How- Boucher [7] used synoptic cloud reports from
ever, quantifying the global radiative impact of such a land and ship stations to detect a positive trend in cir-
perturbation is proving to be challenging. In a mod- rus occurrence and a negative trend in cloud amount
eling study, Burkhardt and Kärcher [4] quantified in the presence of cirrus over air traffic corridors.
the fractional coverage of aviation-induced cirrus for However their analysis was restricted to a 10 year
the year 2002 at 1%–4% in regions that experience a period as the database was discontinued. Satellite data
large amount of air traffic, mainly over Europe, West- have also been used to quantify the aviation impact
ern North America, and the North Atlantic Ocean. on cirrus. Tesche et al [8] found an increase in cir-
The associated global radiative forcing was estimated rus optical depth in satellite lidar observations in
in their study at 38 mW m−2 for 2002. Assuming portions of the satellite track that were crossed by
the forcing scales with air traffic, it would be about aircraft in comparison to neighboring control condi-
86 mW m−2 in the year 2019 given a growth rate tions. Stordal et al [9] correlated trends in cirrus cover
of approximately 5% per year [5], see supplementary with aircraft density data and obtained a noisy signal
© 2021 The Author(s). Published by IOP Publishing Ltd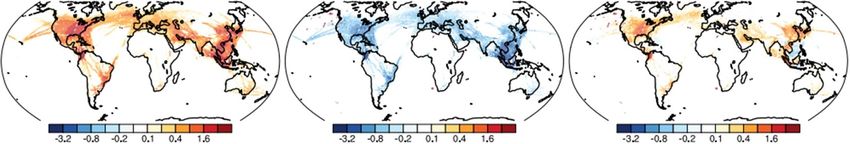
Environ. Res. Lett. 16 (2021) 064051                                                                      J Quaas et al

from which they estimate a regional increase in cloud      and period. The smallest differences correspond to
cover by 1%–2% attributable to aircraft, and estim-        regions unaffected by air traffic and, consequently, by
ated a radiative forcing of 30 mW m−2 in the period        its reduction in 2020.
1992–1999 vs 1984–1991.                                         The first quintile can thus serve as control con-
     A common problem to trend analyses is that mul-       ditions. Large differences in flight density corres-
tiple influences on cirrus, including global warming       pond to regions where aviation has the largest poten-
and natural decadal variability, may also act as con-      tial to affect cirrus. Small differences tend to occur
founding factors. For similar reasons it is difficult to   in early to mid-March 2020, when much of the
compare regions inside and outside air traffic cor-        international air traffic was still active, while large
ridors. Temporary reductions in air traffic thus offer     differences occur from mid-March onwards. The
exceptional conditions to test the hypothesis of an        reason for considering only quintiles of the distri-
impact of aviation on the cirrus cover. The ground-        bution and for transforming the space-time domain
ing of air traffic over the USA after the 9/11 terrorist   to a flight-track-density-difference coordinate is that
attacks offered such an opportunity. One study pos-        it allows broadening the statistics and suppressing
tulated an effect of the absence of contrails on the       the large weather noise. However, it comes at the
diurnal temperature range [10] but it has been later       expense that more subtle factors that may also influ-
called into question [11, 12]. Indeed the shutdown         ence the aircraft impact on cirrus [16, 17] are not
lasted only a few days and the observed changes were       controlled for.
largely consistent with the meteorological situation
after 9/11.                                                2. Results
     The COVID-19 pandemic is exceptional in com-
parison to previous air traffic shutdowns in that          We use satellite retrievals from the moderate resol-
the reduction in the number of flights is very sub-        ution imaging spectroradiometer (MODIS) [18]; on
stantial (about 70% in large regions, supplement-          board the Aqua and Terra satellites from which we
ary figure S1), over a long period of time (several        extract a cirrus cloud cover (cloud horizontal extent)
months) and at a near-global scale. This provides an       and cirrus effective emissivity as a measure of their
unprecedented opportunity to infer causality between       opacity (see supplementary material). The cirrus frac-
air traffic and cirrus cloudiness. The key obstacle        tion for each grid-box and each day in March–May
to the statistical analysis is that cirrus amount and      2020 is classified according to the difference in flight
properties are highly variable in space and time           track density (figure 1).
and bear interannual variability even when consid-              Statistics of the cirrus fraction in analogue cir-
ering 3 month period averages. On such a times-            culation conditions over the March–May 2011–2019
cale, cirrus cover—which is largely controlled by the      period, as well as of the March–May 2011–2019 cli-
weather—may deviate substantially from its long-           matology, are also shown. Mean values for cirrus
term climatology even in absence of air traffic change.    fractional cover are substantially larger than medians
In order to account for such variability, we define        (figure S2), indicating that the distribution is skewed
atmospheric circulation analogues by finding met-          at the 1◦ × 1◦ resolution considered here, with occa-
eorological situations in the months of March to           sionally large, but predominantly smaller fractional
May of years 2011–2019 that match the circulation          cirrus cover.
situation at each location and for each day in the              However, the results for means and medians are
March–May 2020 period (see supplementary mater-            largely consistent. The fractional covers show differ-
ial for details). Observed 2020 cirrus are then com-       ences of the order of ±1% for the four overpass times
pared to what they have been in other years under          (two during day and two during night, variability
those regional circulation analogues. Contrail cir-        shown by the vertical bars) both in terms of mean
rus clouds form in synoptic situations favoring large      and median, and about ±2% for the cirrus emissiv-
ice super-saturation areas [13]. Circulation analogues     ity. There is some systematic variability in cirrus cover
have been largely used in extreme event attribu-           and emissivity (opacity) between the different flight
tion studies in order to disentangle thermodynam-          track density change quintiles, with somewhat lower
ical and dynamical contributions of climate change to      cirrus coverage and also emissivity in the middle three
the change in intensity or probability of occurrence       flight track density change quintiles. This is attribut-
of climate extremes [14, 15]. They allow to estim-         able to the fact that these quintiles reflect different
ate various kinds of statistics conditioned to regional    regions (figure S1). The diurnal cycle in cirrus frac-
circulation.                                               tion is small (figure S3), with slightly more cirrus dur-
     This study focuses on the Northern Hemisphere         ing day than during night. It is more pronounced for
mid-latitudes from 27◦ N to 68◦ N where a large frac-      emissivity—cirrus are least opaque in the evening and
tion of the world air traffic takes place. The differ-     thickest in the night in our results.
ence (2019 minus 2020) in flight track density is con-          Cirrus statistics in the first quintile (control con-
sidered for each day and 1◦ × 1◦ grid-box (figure S1)      ditions) are systematically closer to each other for
and classified in quintiles spanning the entire domain     2020 and the circulation analogues than they are

                                              2
Environ. Res. Lett. 16 (2021) 064051 J Quaas et al
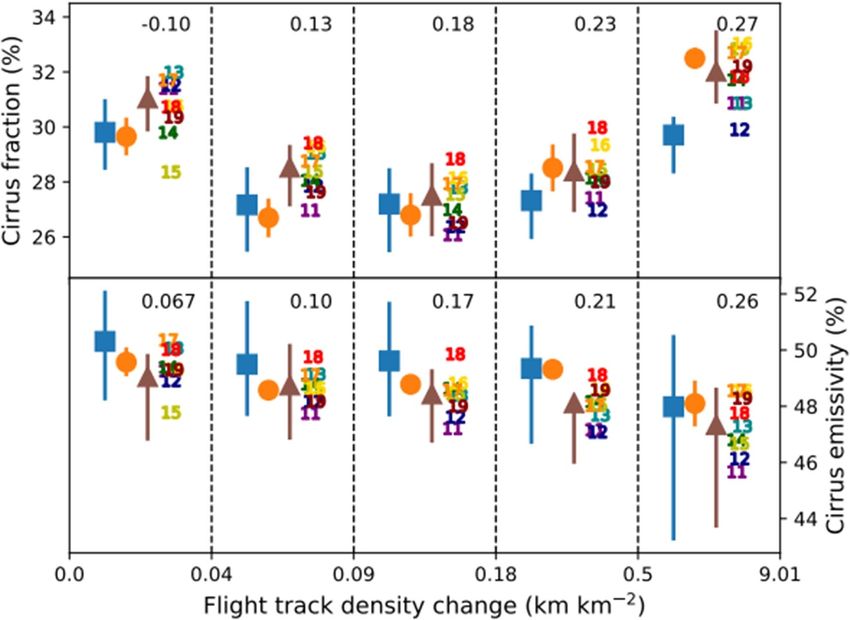
Figure 1. Cirrus fraction and emissivity as a function of flight track density change between 2020 and 2019 in the midlatitudes of
the Northern Hemisphere. Cirrus fraction (top) and emissivity (bottom) from daily level-3 (1◦ × 1◦ ) MODIS retrievals, both
expressed in percent, as a function of quintiles of the difference in flight track density, for grid-boxes containing cirrus. The mean
of the spatio-temporal distribution of the 1◦ × 1◦ grid-boxes in the region 27◦ to 68◦ N is shown. Both MODIS-Terra
(approximate overpass times 10.30 a.m. and 10.30 p.m.) and MODIS-Aqua (overpass times 1.30 a.m. and 1.30 p.m.) data are
considered. Blue squares—March–May 2020; orange circles—circulation analogues March–May 2011–2019; brown
triangles—climatology March–May 2011–2019. Also the March–May means for each year, averaged for all four satellite
overpasses, are provided, color coded from purple (2011 marked as 11) to dark red (2019 marked as 19). The numbers in the top
right for each quintile show the linear trends 2011–2019 (% yr−1 ), as absolute percent changes. The vertical bars show the range
spanned by the four satellite overpass times.
for 2020 and the climatology, showing the ability Both cirrus coverage and emissivity show a decrease
of the circulation analogues to capture circulation- with decreasing air traffic. The difference between
conditioned cirrus statistics. This shows that 2020 cir- areas affected by aviation and those not affected as
culation conditions are less conducive to cirrus form- diagnosed here includes all mechanisms, i.e. contrails,
ation than the climatological conditions at least in the contrail-induced cirrus, and near-field modifications
control quintile. However, the differences between of cirrus by the impact of aviation aerosol emis-
2020 and the circulation analogues are larger for cir- sions. This also includes a contrail buffering effect
rus emissivity (opacity) (figure 1) than for cirrus frac- through the depletion of naturally occurring cirrus
tion in the control quintile. This is because while in the presence of aircraft-induced cirrus [4]. Besides
cirrus occurrence is largely driven by large-scale met- aircraft, surface aerosol emissions were also reduced
eorological conditions, its optical properties are also a during the COVID-19 shutdown. To the extent that
strong function of microphysical processes that more aerosol emissions are related to CO2 emissions, sub-
closely relate to small to mesoscale vertical wind and stantial emission reductions would be expected [20].
to aerosol concentrations [19]. This larger emissiv- However, observations of column aerosol concentra-
ity in regions unaffected by air traffic change in 2020 tions were not found to differ systematically from
can be contrasted by a lack of positive anomaly in the the climatology even over regions strongly affected
regions with large change in flight track density. Note by emissions reductions [21, 22]. Furthermore there
there is some positive trend in emissivity in particular is no reason to expect surface emission changes to
in the upper quintiles (see below). project preferably on aircraft corridors after long-
We diagnose an average net effect in cirrus prop- range transport to the upper troposphere. There-
erties attributable to air traffic by computing the dif- fore we expect the observed changes to represent a
ference between 2020 and analogues relative to their substantial fraction of aircraft impacts on high-level
difference under the control conditions (figure 2). cloudiness.
3Environ. Res. Lett. 16 (2021) 064051 J Quaas et al
Figure 2. Cirrus fraction and emissivity decrease as flight track density change increases when computed for similar weather
conditions. Mean relative difference in cirrus fraction (blue squares) and cirrus emissivity (red circles) between March–May 2020
and March–May in analogue circulations 2011–2019, expressed as the deviation from zero aviation change (lowest quintile), as a
function of flight track density change 2019 minus 2020. The vertical bars show the full range spanned by the four satellite
overpasses. The labels on the top indicate the average change in flight track density within each quintile in absolute and in relative
numbers.
In the uppermost quintile of flight track dens- that the trends in the upper quintiles of flight track
ity difference, the cirrus cover was reduced by more density change are due to air traffic as the regions
than 9% relative to the cirrus cover in analogues, of large flight track density difference are also those
and the emissivity of these clouds was decreased by which have experienced an increase in air traffic.
almost 2%. The change in emissivity was not clearly For the fifth quintile area, the trend in cirrus cover
distinct from zero; it accounts for changes in cirrus implies an increase by 0.27% yr−1 × 9 yr = 2.4%
thickness where aircraft aerosol emissions impact cir- over the nine years analyzed, and at the same time, air
rus, and a shift in the distribution of emissivity due traffic increased by 5% yr−1 , i.e. by 48%. This implies
to aircraft-induced cirrus and contrails. Two factors that 2.4%/0.48 = 5% absolute or 16% of the aver-
have to be accounted for when estimating the cirrus age cirrus cover of 0.32 are attributable to air traffic.
cover response to all aircraft: (a) flight track dens- This trend analysis thus corroborates the quantit-
ity on average was only reduced by 70% in the fifth ative estimate from the COVID-19 period and the
quintile, and (b) there was an increase in air traffic two arguments together provide strong evidence for a
throughout the reference period. We approximate causal link between air traffic and cirrus coverage, as
this increase by accounting for a 5% growth rate per cirrus coverage qualitatively and quantitatively con-
year [5] between the middle of the 2011–2019 refer- sistently responds to the long-term increase as well as
ence period and the year 2019 for which we estimate to the rapid decrease in aviation activity. Similarly,
the cirrus change. This corresponds to 21% for four there is also a positive trend in emissivity which is
and a half years, implying that the 2019 air traffic is also present in the lowest quintiles but increases in
121% of what was observed on average during the ref- magnitude in the upper quintiles. These trends could
erence period. Together, this implies that 17% of the in principle also stem from other causes, including a
cirrus in 2019 in the region corresponding to the fifth trend attributable to global warming, natural variab-
quintile are due to air traffic (see also figure S4 for ility, or to a drift in satellite instrument calibration.
further explanation). However, the fact that the trends show a systematic-
This estimate is consistent with an independent ally different behavior for the quintiles in air traffic
estimate: The aircraft impact on cirrus can also be reduction hints at air traffic begin the cause for the
derived from the trend over the 2011–2019 period observed trends.
in the upper quintile (+0.27% per year, statistically There is little diurnal cycle in the response of cir-
significant at the 99% confidence level using a one- rus fraction (figure S3), changes are somewhat more
sided probability p of the Student t-distribution). For pronounced at late evening and morning. A possible
this quintile with the largest air traffic impact, the cir- explanation is in the diurnal cycle of air traffic, which
rus coverage was substantially lower in the early part is larger in the mornings and evenings than at early
of the period compared to the more recent one. The afternoon for intercontinental flights but also many
two quintiles with statistically significant trends are intra-continental ones.
the fourth (+0.23% per year) and the fifth, whereas The radiative forcing implied by the results shown
quintiles 1–3 do not show significant trends. We posit in figure 2 is computed using radiative transfer
4Environ. Res. Lett. 16 (2021) 064051 J Quaas et al
Figure 3. Radiative forcing (W m−2 ) due to aviation-induced cirrus in March–May 2019. Left: terrestrial (longwave) spectrum,
middle: solar (shortwave spectrum), right: net radiative forcing.
modeling (see supplementary material). The radiative and March–May mean is factored into the assess-
fluxes are computed for weather conditions sampled ment. Our results for March to May are thus com-
throughout March–May 2019, and the changes in parable to annual-mean results published in other
high cloud extent and opacity are estimated from the studies.
2019 flight track distributions, imposing the changes
where the flight track density was within the upper 3. Discussion
two quintiles of the track density changes in figure 2.
Note that although some of the cirrus clouds are Our estimate of the net RF of 61 ±39 mW m−2
too thin to be detected by MODIS [23, 24], they that is based on the observations-derived air-
are considered for their radiative impact, by chan- craft impact on cirrus is somewhat lower than
ging them in the computation in the radiative flux the estimate and 5%–95% confidence interval of
perturbation in the same way as those diagnosed in 50 (20–150) mW m−2 given for the year 2011 (i.e.
figure 2. The resulting geographical distribution in about 74 (30–222) mW m−2 for 2019 considering an
difference 2019 vs 2020 in cirrus coverage is shown in annual increase by 5%) by the Intergovernmental
figure S5. The results are shown in figure 3 in terms Panel on Climate Change in the fifth assessment
of radiative forcing. The forcing due to all aviation, report [28], and substantially lower than the model-
not just the change 2019–2020 is estimated using the based estimates of Bock and Burkhardt [6]. It is also
fraction of flights still active in 2020 and the trend smaller than, but consistent considering the uncer-
in aviation within the reference period (see supple- tainty ranges, with the estimate by Lee et al [3] that
mentary material and figure S4). The estimate fur- reviewed all available information including model-
ther accounts for a systematic underestimation of the ing. A large part of the difference appears to be due
forcing in climate model radiation codes [3] and a to our lower cirrus coverage attributable to air traffic,
small systematic difference between March–May and though Bock and Burkhardt also have a contribution
annual mean forcings (see supplementary material). from subvisible cirrus which the MODIS analysis may
The radiative forcing due to the aviation-induced cir- miss. The aviation impact derived from an analysis
rus for March–May of the year 2019 is estimated to of cirrus trends in each quintile yields an estimate of
be +227 mW m−2 in the terrestrial (longwave) spec- aviation-induced cirrus that is very similar to the one
trum in the global average, of which 165 mW m−2 are obtained from the COVID-related traffic reduction,
balanced by a cooling effect in the solar (shortwave) corroborating this result.
spectrum. The share of the shortwave forcing, that
offsets about 70% of the longwave forcing, is larger
than what was found in previous studies [6, 25, 26],
Data availability statement
partly owing to the increase in emissivity that also
The following data that support the findings of this
impacts the cirrus albedo. In particular over Europe,
study are openly available: MODIS satellite data,
the effects in the solar and terrestrial spectra nearly
ERA5 and NCEP reanalysis data (see acknowledge-
cancel to yield a net small forcing. The net forcing
ments for details). The following data that support
is substantially positive, however, over eastern North
the findings of this study are available upon request
America and East Asia. The net radiative forcing
from the authors: Flight track densities and circula-
in its global, March–May average, is estimated at
tion analogues.
+61 mW m−2 .
The data that support the findings of this study are
We estimate the uncertainty of this forcing
available upon reasonable request from the authors.
estimate (see supplementary material), which is dom-
inated by the uncertainty due to the weather variabil-
ity. The 2-σ range is assessed at ±64%. Model results Acknowledgments
by Chen and Gettelman [27] show that there is very
little annual cycle in the global forcing due to contrail J Q received support from the EU Horizon2020
cirrus, the difference of 9% between annual-mean projects ACACIA (GA no. 875036) and FORCES
5Environ. Res. Lett. 16 (2021) 064051 J Quaas et al
(GA no. 821205). O B and J Q further were supported [10] Travis D J, Carleton A M and Lauritsen R G 2004 Regional
by the EU Horizon2020 project CONSTRAIN (GA variations in U.S. diurnal temperature range for the 11–14
September 2001 aircraft groundings: evidence of jet contrail
no. 820829). E G was supported by a Royal Society
influence on climate J. Clim. 17 1123–34
University Research Fellowship (URF/R1/191602). [11] Dietmüller S, Ponater M, Sausen R, Hoinka K and Pechtl S
The MODIS cloud products MYD08_D3 from Aqua 2008 Contrails, natural clouds, and diurnal temperature
and MOD08_D3 from Terra were used in this range J. Clim. 21 5061–75
[12] Van Wijngaarden W A 2012 Examination of diurnal
study from the Atmosphere Archive and Distribu-
temperature range at coterminous U.S. stations during Sept.
tion System (LAADS) Distributed Active Archive 8–17, 2001 Theor. Appl. Climatol. 109 1–5
Center (DAAC), https://ladsweb.nascom.nasa.gov/. [13] Bier A, Burkhardt U and Bock L 2017 Synoptic control of
ERA5 data were obtained from the European contrail cirrus life cycles and their modification due to
reduced soot number emissions J. Geophys. Res. 122 11584–603
Centre for Medium-range Weather Forecasts
[14] Cattiaux J, Vautard R, Cassou C, Yiou P, Masson-Delmotte V
(ECMWF) archive, www.ecmwf.int/en/forecasts/ and Codron F 2010 Winter 2010 in Europe: a cold extreme in
datasets/reanalysis-datasets/era5. NCEP Reanalysis a warming climate Geophys. Res. Lett. 37 L20704
Derived data are provided by the NOAA/OAR/ESRL [15] Vautard R, Yiou P, Otto F, Stott P, Christidis N, Van
Oldenborgh G J and Schaller N 2016 Attribution of
PSL, Boulder, Colorado, USA, from their Web site
human-induced dynamical and thermodynamical
at https://psl.noaa.gov/. We would like to thank Jan contributions in extreme weather events Environ. Res. Lett.
Kretzschmar and Jonas Schaefer, Leipzig University, 11 114009
for support with the PRP analysis. Eulalie Boucher is [16] Burkhardt U, Bock L and Bier A 2018 Mitigating the contrail
cirrus climate impact by reducing aircraft soot number
acknowledged for the reconstruction of an air traffic
emissions npj Clim. Atmos. Sci. 1 37
distribution for 2019 and 2020 used in the initial [17] Bier A and Burkhardt U 2019 Variability in contrail ice
phase of the study. nucleation and its dependence on soot number emissions
J. Geophys. Res. 124 3384–400
[18] Platnick S et al 2017 The MODIS cloud optical and
ORCID iDs microphysical products: collection 6 updates and examples
from Terra and Aqua IEEE Trans. Geosci. Remote Sens.
55 502–25
Johannes Quaas https://orcid.org/0000-0001- [19] Krämer M et al 2021 A microphysics guide to cirrus—part II:
7057-194X climatologies of clouds and humidity from observations
Edward Gryspeerdt https://orcid.org/0000-0002- Atmos. Chem. Phys. 20 12569–608
3815-4756 [20] Le Quéré C et al 2020 Temporary reduction in daily global
CO2 emissions during the COVID-19 forced confinement
Robert Vautard https://orcid.org/0000-0001- Nat. Clim. Change 10 647–53
5544-9903 [21] Diamond M S and Wood R 2020 Limited regional aerosol
Olivier Boucher https://orcid.org/0000-0003- and cloud microphysical changes despite unprecedented
2328-5769 decline in nitrogen oxide pollution during the February 2020
COVID-19 shutdown in China Geophys. Res. Lett.
47 e2020GL088913
References [22] Le T, Wang Y, Liu L, Yang J, Yung Y L, Li G and Seinfeld J H
2020 Unexpected air pollution with marked emission
[1] Well E D 1919 Clouds formed by airplanes Sci. Am. 120 601 reductions during the COVID-19 outbreak in China Science
[2] Haywood J M, Allan R P, Bornemann J, Forster P, 369 702–6
Francis P N, Milton S, Rädel G, Rap A, Shine K P and [23] Holz R E, Ackerman S A, Nagle F W, Frey R, Dutcher S,
Thorpe R 2009 A case study of the radiative forcing of Kuehn R E, Vaughan M A and Baum B 2008 Global
persistent contrails evolving into contrail-induced cirrus moderate resolution imaging spectroradiometer (MODIS)
J. Geophys. Res. 114 D24201 cloud detection and height evaluation using CALIOP
[3] Lee D S et al 2021 The contribution of global aviation to J. Geophys. Res. 113 D00A19
anthropogenic climate forcing for 2000–2018 Atmos. [24] Kärcher B 2018 Formation and radiative forcing of contrail
Environ. 244 1–29 cirrus Nat. Commun. 9 1824
[4] Burkhardt U and Kärcher B 2011 Global radiative forcing [25] Duda D P et al 2019 Northern Hemisphere contrail
from contrail cirrus Nat. Clim. Change 1 54–8 properties derived from Terra and Aqua MODIS
[5] ICAO, International Civil Aviation Organization 2018 data for 2006 and 2012 Atmos. Chem. Phys. 19
Annual Report 2018, The World of Air Transport in 2018 5313–30
(www.icao.int/annual-report-2018/Documents/Annual. [26] Myhre G et al 2009 Intercomparison of radiative forcing
Report.2018_Air Transport Statistics.pdf) calculations of stratospheric water vapour and contrails
[6] Bock L and Burkhardt U 2016 Reassessing properties and Meteorol. Z 18 585–96
radiative forcing of contrail cirrus using a climate model [27] Chen C-C and Gettelman A 2013 Simulated radiative forcing
J. Geophys. Res. Atmos. 121 9717–36 from contrails and contrail cirrus Atmos. Chem. Phys.
[7] Boucher O 1999 Air traffic may increase cirrus cloudiness 13 12525–36
Nature 397 30–1 [28] Boucher O et al 2013 Clouds and aerosols Climate Change
[8] Tesche M, Achtert P, Glantz P and Noone K J 2016 Aviation 2013: The Physical Science Basis. Contribution of
effects on already-existing cirrus clouds Nat. Commun. Working Group I to the Fifth Assessment Report of the
7 12016 Intergovernmental Panel on Climate Change
[9] Stordal F, Myhre G, Stordal E J G, Rossow W B, Lee D S, ed T F Stocker, D Qin, G-K Plattner, M Tignor,
Arlander D W and Svendby T 2005 Is there a trend in cirrus S K Allen, J Boschung, A Nauels, Y Xia, V Bex and
cloud cover due to aircraft traffic? Atmos. Chem. Phys. P M Midgley (Cambridge: Cambridge University
5 2155–62 Press)
6You can also read