Assessing and Modeling Visitors' Evaluations of Park Road Conditions in Yosemite National Park
←
→
Page content transcription
If your browser does not render page correctly, please read the page content below
Assessing and Modeling Visitors’ Evaluations of
Park Road Conditions in Yosemite National Park
Dave D. White, Stacy Tschuor, and Bill Byrne

Introduction
Park visitors’ travel choices and behavior are longstanding concerns for the Na -
tional Park Service. Travel behaviors can affect natural and cultural resources and the quali-
ty of the visitor experience. Driving park roadways has been central to the American nation-
al park experience since the earliest days of park preservation. As historian David Louter
(2006) argued in his book Windshield Wilderness, ‘‘We cannot understand parks without
recognizing that cars have been central to shaping how people experience and interpret the
meaning of national parks, especially how they perceive them as wild places’’ (p. 164).
Youngs et al. (2008) concurred, adding, “We cannot understand national parks without
understanding transportation systems more broadly.” Understanding transportation in parks
is thus critical to both the recreational use and preservation mandates of the National Park
Service.
     Nowhere are these issues more prominent than in Yosemite National Park, which has
struggled with an appropriate balance between automobile access and park preservation
since the turn of the 20th century (Havlick 2002). Roads were first built into Yosemite Valley
in the 1870s and by 1913 the first cars entered the valley. During the 1930s, park roads were
improved, widened, and paved (Runte 1990). Meanwhile the popularity of auto tourism in
America expanded (Colten and Dilsaver 2005), sparked by the ‘‘See America First’’ cam-
paign (Shaffer 2001) and the increase in personal automobile ownership. Private automo-
biles have since become entrenched in park management and visitor culture, leading to what

                       The George Wright Forum, vol. 29, no. 3, pp. 308–321 (2012).
                          © 2012 The George Wright Society. All rights reserved.
                 (No copyright is claimed for previously published material reprinted herein.)
               ISSN 0732-4715. Please direct all permission requests to info@georgewright.org.

308                                                                                    The George Wright Forum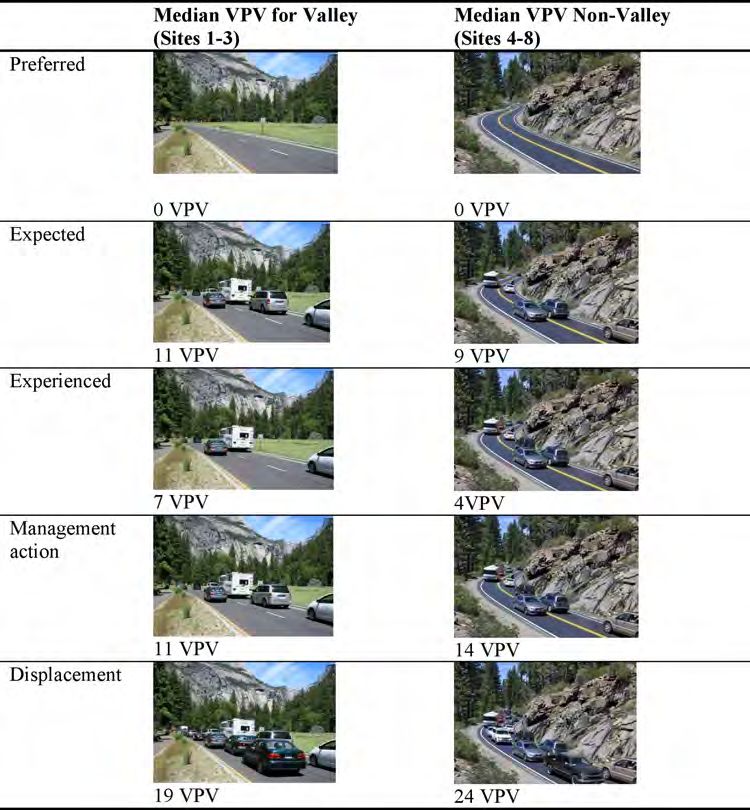
Transportation and Visitor Capacity Research and Planning at Yosemite National Park

Dilsaver and Wyckoff (1999) have called a “spiraling of interdependent development and
use’’ (p. 76). According to Youngs et al. (2008), this “has produced a cultural landscape in
portions of Yosemite Valley and other areas of the park that is dominated by roads and auto-
mobiles and fostered a widely shared and scripted visitor experience, best described as a
‘travel narrative.’” (p. 805). Many Yosemite visitors consider scenic driving to be an impor-
tant activity (NPS 2009) and they value the sense of freedom, convenience, and access driv-
ing provides (White 2007).
      There are, of course, also longstanding concerns about the impacts of an automobile-
dominated transportation system on visitors’ experiences and park resources. Issues include
perceived crowding, conflict, traffic congestion, air pollution, vegetation loss, degradation of
scenic views, and visitor displacement. To address these problems, Yosemite managers have
implemented strategies to improve the transportation system by adjusting traffic patterns,
removing cars from the eastern section of Yosemite Valley, initiating a free public bus service
in the valley (Greene 1987), and, during periods of extreme congestion, diverting inbound
vehicles away from the eastern portion of Yosemite Valley. Despite these efforts, the lingering
effects of geography, park design, visitors’ preferences for private automobiles, and intensive
use continue to challenge the best efforts of park managers.
      To deal with these ongoing challenges, Yosemite has in recent years undertaken a pro-
gram of coordinated research and planning aimed at an integrated transportation capacity
assessment (Meldrum and Degroot, this volume). This program has been informed by con-
temporary thinking on capacity and visitor-use management in national parks (e.g., Graefe
et al. 2011; Whitaker et al. 2011) and by an adaptive visitor-use management framework of
management objectives and associated indicators and standards of quality (NPS 1997; Man-
ning 2001). Generally, this approach includes: (1) crafting specific goals and objectives in
terms of desired conditions and empirically based indicators and standards; (2) monitoring
visitor-use levels and associated conditions of experiential quality; and (3) evaluating use lev-
els and experiential quality in comparison with visitor-informed standards of quality to
assess achievement of management objectives. This process requires research on current and
potential future conditions of visitor use and their relationship to the quality of visitors’
transportation experiences. The research that informs this management by objectives, indi-
cators, and standards of quality follows the conceptual models outlined by Meldrum and
DeGroot in the introduction to this special edition of The George Wright Forum. This effort
is also informed by long-standing traffic engineering research, modeling, and practice, which
have developed indicators and standards for the quality of transportation service, largely
based on measures of travel time and delay (TRB 2010).
      In this paper, we present research to monitor transportation and experiential conditions
on park roadways and to model elements of the relationship between use level and quality
within this system. First, we describe the formulation of indicators and visitor-based evalua-
tive standards to guide monitoring for visitors’ experiences on Yosemite roadways. This eval-
uative research is conducted with survey research methods. Second, we discuss descriptive
modeling of roadway conditions that develops relationships between roadway use levels and
indicators of quality. Additionally, this simulation modeling can be used to simulate different

Volume 29 • Number 3 (2012)                                                                         309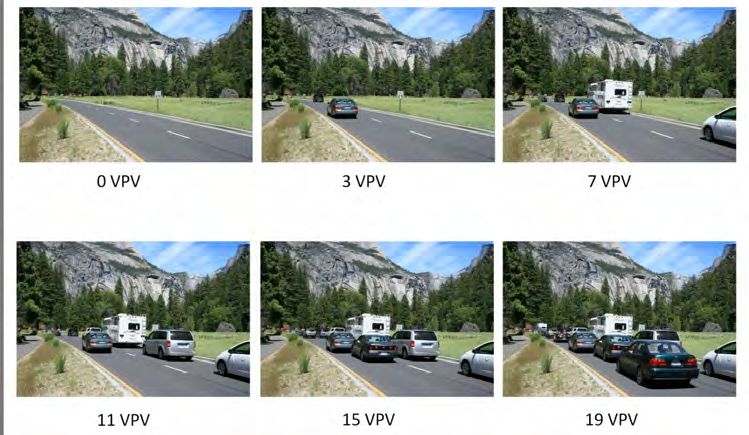
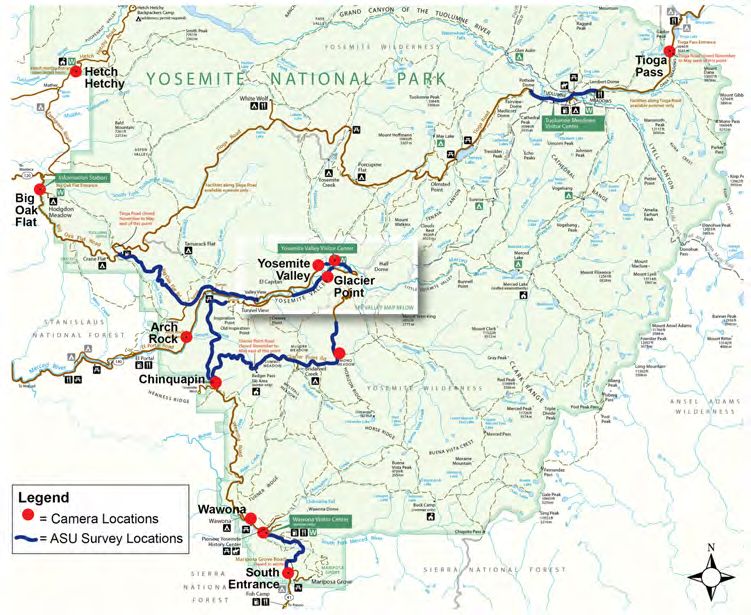
Transportation and Visitor Capacity Research and Planning at Yosemite National Park

conditions of use and quality to assess alternative transportation management scenarios.
Evaluative survey research and simulation modeling can be integrated to facilitate empirical-
ly based, visitor-informed, proactive management to assess the types and levels of visitor use
that can be accommodated under varying assumptions or potential management actions
while maintaining desired conditions. In the final section of the paper, we describe implica-
tions of this research for park planning as well as research on transportation experiences in
national parks.

Methods
Evaluative survey research. For the evaluative survey research component of this project, we
employed a cross-sectional design (Creswell 2009) with data collected via on-site, surveyor-
assisted questionnaires. To ensure the study findings were representative of visitors to the
park during the study period (July 2010), we employed a stratified random sampling strate-
gy with three-stage selection (Lohr 2009). First, we divided the park into eight geographic
zones based on segments of the transportation system (see Figure 1). Second, we randomly

Figure 1. Map of Yosemite National Park with survey sampling locations and modeling data col-
lection sites.

310                                                                                   The George Wright Forum
Transportation and Visitor Capacity Research and Planning at Yosemite National Park

selected sample dates within the sample period for each site, stratified by weekday/weekend.
Third, each sampling day was then partitioned into morning and afternoon sampling blocks,
and a block of time within each day was randomly selected. Surveyors followed a traffic con-
trol plan and flagged and pulled over motorists to administer the questionnaire at roadside
pullouts, scenic overlooks, and parking areas. The questionnaire scales and visual simulation
methods used in this study are well-established in the field and supported by peer-reviewed
scientific literature. Several previous studies have used similar methods and questions (see
Manning 2011 for a review). Specific examples include visitor surveys in Yosemite (White et
al. 2011) and at Acadia National Park (Hallo and Manning 2009). We obtained 1,054 com-
pleted questionnaires with an overall response rate of 64%. The survey has a margin of sam-
pling error of +/–3% at the 95% confidence interval. Results of a non-response bias analysis,
coupled with the high response rate, ensure that there are no systematic differences between
groups who did participate in the survey and those that refused, thus enhancing the gener-
alizability of the results.
     In a prior study, researchers used open-ended interviews to identify salient aspects of
visitors’ transportation experience by asking them to report on what added to or detracted
from the quality of their experience of driving cars on the park roadways. The findings
revealed that visitors value convenience, perceived freedom, access, personal control, and
opportunities to experience nature. Negative influences included feelings of stress, traffic
congestion, difficult route finding, crowding, and conflict (White 2007). A subsequent study
documented travel mode choices and travel patterns in Yosemite, identified the importance
and satisfaction of travel by various modes, examined visitors’ perceptions of the experien-
tial dimensions of traveling via car versus park shuttle bus, and identified visitors’ prefer-
ences regarding transportation management options (White et al. 2011). Based on these
studies, and in consultation with park officials, the team selected two key variables to serve
as indicators of quality for visitor experiences and to guide future monitoring and manage-
ment: vehicles per viewshed (VPV) and travel time.
     Vehicles per viewshed. To represent varying levels of congestion on park roadways real-
istically, we used a visual measurement approach to assess VPV (Manning et al. 1996; Man -
ning and Freimund 2004). We prepared two sets of photographs: one with a representative
Yosemite Valley roadway viewshed and another with a representative high-alpine roadway
viewshed. The images, which embody the VPV indicator of quality, showed a range of road-
way conditions varying from free-flow (0 VPV) to full roadway capacity (24 VPV). The pho-
tographs were prepared using digital editing software (see Figure 2).
     Respondents were shown the photographs in random order and asked to rate each pho-
tograph by indicating how acceptable it was based upon the number of vehicles shown using
a nine point scale ranging from –4 (“very unacceptable”) to +4 (“very acceptable”).
     Travel times. In addition to VPV, visitors were asked to evaluate the acceptability of trav-
el times on park roadways. Respondents were flagged and pulled over at the terminus of a
study road segment, and asked to report the amount of time it had taken to travel that seg-
ment. Then, they rated the acceptability of that travel time on a nine point scale ranging from
–4 (“very unacceptable”) to +4 (“very acceptable”).

Volume 29 • Number 3 (2012)                                                                         311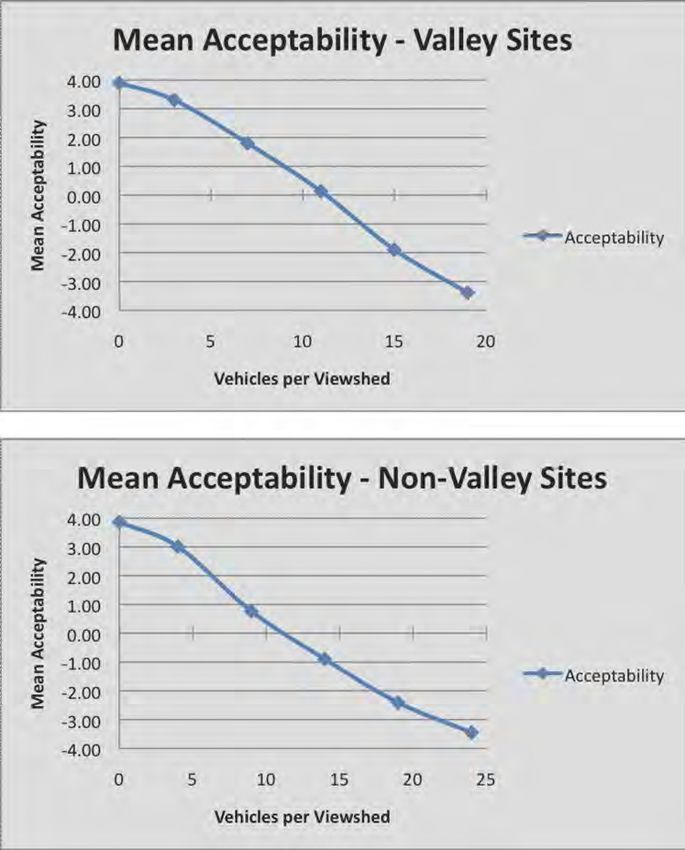
Transportation and Visitor Capacity Research and Planning at Yosemite National Park

Figure 2. Sample study photographs showing a range of vehicle use on park roadways.

     Standards of quality, benchmarks by which the achievement of management objectives
can be judged, are formulated from visitor evaluations of the VPV and travel time indicator
variables (Shelby and Heberlein 1986; Vaske et al. 1986). This approach posits that individ-
uals have standards for evaluating social and environmental conditions and that empirical
research can measure these standards and describe the distribution in groups. This informa-
tion can then be used to inform a range of potential management standards.

Descriptive modeling research
Coinciding with visitor surveys (July 2010), we also conducted a license plate study to
record and match vehicles traveling past 23 cameras placed at the entrance stations and key
locations within the park. We used a license plate recognition program to match plates cap-
tured at two or more cameras and constructed a database to identify matches for any given
route across camera locations. The final dataset included a total of 71,120 license plate data
points with approximately 15,100 license plates matches. Traffic counts from each license
plate data collection location showed that capture rates varied by location. Generally, capture
rates around 90% were achieved. The information generated by this license plate study, com-
bined with traffic counters deployed along the park’s road network, supplied counts of vehi-
cles arriving to the park and road segments of analytical interest.
     In previous work, traffic engineers developed a TransCAD travel demand model for
Yosemite Valley (Smith et al. 2003) and a VISSIM transportation simulation model for the
Yosemite Valley roadway network (Chase 2006). For the current project, engineers updated

312                                                                                   The George Wright Forum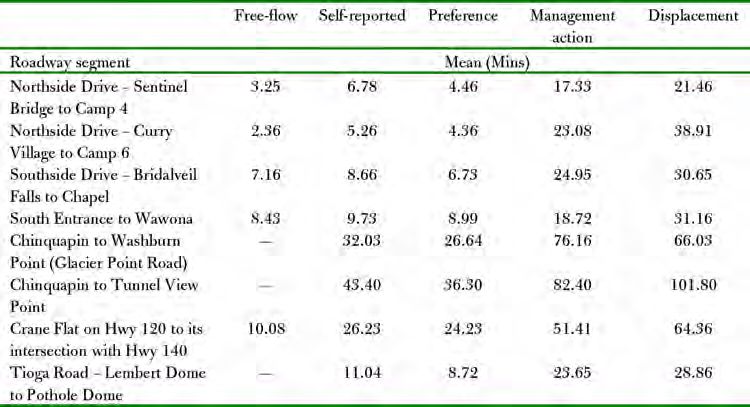
Transportation and Visitor Capacity Research and Planning at Yosemite National Park
and expanded these demand and simulation models to include all major roadways within the
park. Next, we used the license plate data and traffic counts collected in July 2010 to validate
the models. The travel demand and simulation models were developed to estimate volumes
and simulate vehicular traffic along the park roadways at different levels of visitor use and
under different traffic management strategies. These estimates of experiential conditions
along park roadways can be translated into indicators of quality, facilitating evaluation
against the standards of quality formulated from the survey research described above.
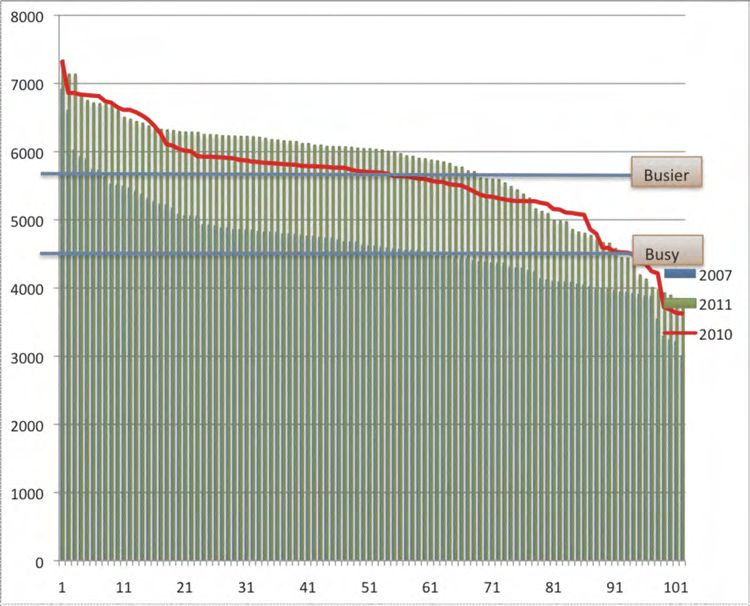
The evaluation of seasonal visitation in Yosemite focused on the 100 busiest days of the
summer peak use season. Figure 3 shows the number of vehicles per day entering eastern
Yosemite Valley, as recorded by permanent traffic counters located near the Yosemite Chapel
on Southside Drive. Data are presented for 2007, 2010, and 2011, with the days ordered
from the highest entering volume to the lowest entering volume for each 100-day peak sea-
son. In 2007, benchmark volumes were established, including the “busiest day,” (i.e., high-
est volume), a “busier day” (i.e., 7th highest volume) and a “busy day” (i.e., median volume).
The travel demand and simulation models generally follow the “busier day” traffic scenario
Figure 3. Vehicles per day entering Yosemite Valley: Summer 2007, 2010, and 2011.
Volume 29 • Number 3 (2012) 313Transportation and Visitor Capacity Research and Planning at Yosemite National Park
with traffic volumes in the 90th to 95th percentile of the summer season volumes. The park-
wide models were initially developed for a 2007 “busier day” traffic scenario and the current
project updated the models to calibrate to the data collection time period, which was the
fourth-highest visitation day of the 2010 summer season.
Survey findings and modeling results:
Visitors’ evaluations of transportation experience indicators of quality
Vehicles per viewshed. To explore the range of visitor evaluations of VPV conditions as
potential inputs for managerial standards, respondents were asked evaluate the series of VPV
photographs and to identify the photograph that represented: (a) the number of vehicles
they preferred to see; (b) the number of vehicles on the roadway that would be so unaccept-
able that they would no longer visit that area of the park; (c) the number of vehicles that the
National Park Service should allow on this roadway; and (d) the number of vehicles they typ-
ically saw on that day. The results for evaluation of each depicted VPV level are summarized
in the graph in Figure 4, which is constructed using the mean acceptability ratings of respon-
dents. Figure 5 summarizes visitors’ evaluations of the roadway conditions on multiple
dimensions. For instance, the findings show that:
• The preferred condition for valley and non-valley sites was 0 VPV. Thus, this is the opti-
mum condition, which received the highest acceptability by the aggregate sample.
• The range of acceptable conditions for valley sites is 0 to 11 VPV; for non-valley sites, 0
to 14 VPV. Thus, all of the conditions represented in this range meet some level of
acceptability by about half the respondents.
• The minimum acceptable condition for valley sites is approximately 11 VPV; for non-
valley sites, 14 VPV. At this point, about half the sample finds these conditions accept-
able.
In both sub-samples (valley and non-valley), visitors expected to encounter more vehi-
cles than they actually reported experiencing. It is noteworthy that valley respondents iden-
tified their expected condition (11 VPV) as the point at which NPS management should take
action. In both subsamples, respondents rated the photo with maximum congestion as the
point at which they would no longer visit that area of the park.
Travel times. Results of travel time indicator of quality evaluations suggest that, in aggre-
gate, acceptability ratings for six of the eight segments were above 3.0 on the scale, indicat-
ing that the respondents found the travel times to be acceptable to very acceptable. For
another site, Northside Drive–Curry Village to Camp 6, the mean rating was 2.88, still in the
acceptable range but lower than the other sites. The mean rating for Chinquapin to Tunnel
View Point was 0.86, near the unacceptable point of the scale. The results also demonstrat-
ed that the correlation between travel time and acceptability ratings was r= –.287 (pTransportation and Visitor Capacity Research and Planning at Yosemite National Park
Figure 4. Respondent acceptability ratings for a range of VPV on Yosemite roadways.
As with VPV, respondents were asked to identify (a) the amount of time they would pre-
fer it to take to travel that road segment; b) the amount of time that would be so unacceptable
that they would no longer visit that area of the park; and (c) the amount of time that the
National Park Service should allow. The results, shown in Table 1, provide managers with
Volume 29 • Number 3 (2012) 315Transportation and Visitor Capacity Research and Planning at Yosemite National Park Figure 5. Summary of visitors’ evaluations of VPV. information on current conditions as well as visitor-based evaluations of travel time across a range of dimensions. It is important to note that not all respondents were able to express a personal standard for travel time for the management action and displacement dimensions. Depending on the road segment and sub-sample, 1–7% of respondents answered “don’t know” on these items. Furthermore, across the entire sample for the acceptability dimension, 16% said no amount of time would be so unacceptable that they would no longer visit this area of the park; for the management action standard, 7% responded that no amount of time is so unacceptable as to restrict vehicles using the roadway; and 13% said the number of 316 The George Wright Forum
Transportation and Visitor Capacity Research and Planning at Yosemite National Park

Table 1. Summary of visitors’ evaluations of travel times.

vehicles using the roadway in this area should not be restricted at all. These respondents are
not included in the calculations for travel time standards.

Modeling transportation indicators—linking monitoring with evaluation
We then compared visitor-based evaluative standards of quality for the travel time indicator
derived from the survey study with traffic modeling results using traffic volume data from
both 2007 and 2010. This allowed us to evaluate multiple scenarios of varying use levels and
the potential effects on visitors’ experiences. Using travel demand and simulation models
developed in 2007, we simulated travel times for a representative roadway segment within
Yosemite Valley, Northside Drive from Sentinel Drive to Camp 4 (see Table 2). (Note that
this roadway segment was also one of the segments for the survey research.) Comparing
modeled travel times with the visitor-based evaluations for the Northside Drive segment, the
results show that travel time conditions on the “busy day” scenario (3.6 minutes) were with-
in standard for the visitor-based preference dimension (4.46 minutes). The visitor prefer-
ence standard, however, was not met under the “busier day” (7.0 minutes) and “busiest day”
(9.0 minutes) conditions. None of the simulated conditions exceeded the visitors’ standard
for management action (17.33 minutes).
     Traffic volumes entering Yosemite National Park, however, have increased since 2007.
For instance, the average daily volume of traffic entering Yosemite Valley for the 100-day
peak season has increased by about 24% overall. Traffic volume on the median day has
increased about 30% overall, with the median day having more than 6,000 vehicles entering
eastern Yosemite Valley in 2011. While the average and median traffic volumes have

Volume 29 • Number 3 (2012)                                                                         317
Transportation and Visitor Capacity Research and Planning at Yosemite National Park
Table 2. Simulation model results: Travel time on Northside Drive.
increased substantially, there has been relatively less of an increase in traffic on the maximum
day. This is likely reflective of the fact that the roadway system and parking areas in the East
Valley have a physical capacity which is being attained on the highest use days. In addition
to the constraints on traffic from the roadway system, park management takes action to redi-
rect traffic away from the eastern portion of the valley when congestion reaches severe levels.
Diverting traffic away from eastern part of the valley tends to limit the total number of vehi-
cles that can enter over the course of a busy day. Furthermore, observations at the park
entrance stations on very busy days indicate that when very long queues of vehicles form at
the entrances, some visitors turn around and depart without entering the park.
To evaluate the effects of the recent increase in traffic volume, we updated the simula-
tion models with 2010 traffic conditions for the roadway segment along Northside Drive
from Sentinel Drive to Camp 4 (see Table 2). As shown, the travel time on the roadway seg-
ment is 30% higher than the same day during the 2007 summer season, due to the general
increase in traffic volumes within the park. Comparing these travel times with the visitor-
based evaluations of travel time for the Northside Drive segment, the results show that the
visitor preference standard was not met, but the travel time remains well under the manage-
ment action standard. Future research will assess of the relationship between modeled VPV
conditions and visitor standards of quality.
The park is currently installing permanent traffic counters at the entrance stations and
other locations within the park to establish a traffic monitoring program. The program will
use the counters to measure real-time traffic volume data within key sections of the trans-
portation system. These counters can supply the data to facilitate ongoing application of the
conceptual models employed in this research to monitor use, estimate experiential condi-
tions, and evaluate their quality. The program will also provide a more complete and reliable
historical record of traffic volumes for enhanced analysis of trends and relationships among
volumes at various locations in the park. This real-time monitoring will inform park staff
whether management objectives are being achieved or if visitor-informed standards of qual-
ity may be violated by roadway use levels. The travel demand and simulation models can be
318 The George Wright ForumTransportation and Visitor Capacity Research and Planning at Yosemite National Park
used to proactively evaluate the impacts of different management alternatives on roadway
traffic volumes, travel time, and the associated impact on visitor-based evaluations.
Conclusion
In recent years, there has been a sharpening focus by researchers and planners on transporta-
tion experience in national parks (Hallo and Manning 2009; Holly et al. 2010; White 2007;
White et al. 2011; Youngs et al. 2008). Indeed, transportation management is now consid-
ered an essential aspect of capacity and visitor use management in national parks (Daigle
2008; Lawson et al. 2009). In recognizing that transportation and recreation are often syn-
onymous in parks, this paper illustrates a process of integrating traffic engineering modeling
with transportation experience indicators and standards of quality to evaluate roadway con-
ditions in terms of experiential quality.
In this study, visitors’ experiences of travel times and VPV along park roadways were
within the range of acceptable conditions. Modeling results indicate, however, that recent
visitation patterns threaten to push conditions outside of that acceptable range. Looking for-
ward, researchers and planners will develop and assess multiple scenarios of potential future
use levels and model the impact of alternative management actions on visitor experiences.
This fosters an anticipatory approach to management that allows for decisions to be made
that are robust against a wider range of future conditions.
References
Chase, I. 2006. East Yosemite Valley Transportation Modeling Simulation Model Assumptions
and Results. Technical Memorandum. N.p.: David Evans and Associates, Inc.
Colten, C.E., and L.M. Dilsaver. 2005. The hidden landscape of Yosemite National Park.
Journal of Cultural Geography 22(2): 27–50.
Dilsaver, L.M. and W. Wyckoff. 1999. Agency culture, cumulative causation and develop-
ment in Glacier National Park, Montana. Journal of Historical Geography 25(1): 75–92.
Creswell, J.W. 2009. Research Design: Qualitative, Quantitative, and Mixed Methods Ap -
proaches. 3rd ed. Thousand Oaks, CA: Sage.
Graefe, A.R., K. Cahill, and J. Bacon. 2011. Putting visitor capacity in perspective: A
response to the capacity work group. Journal of Park and Recreation Administra-
tion 29(1): 21–37.
Greene, L. 1987. Historic Resource Study: Yosemite; The Park and its Resources—A History
of Discovery, Management, and Physical Development of Yosemite National Park, Cali -
fornia, 3 vols. Washington, DC: National Park Service.
Hallo, J.C., and R. Manning. 2009. Transportation and recreation: A case study of visitors
driving for pleasure at Acadia National Park. Journal of Transport Geography 17(6)
491–499.
Havlick, D.G. 2002. No Place Distant: Roads and Motorized Recreation on America’s Public
Lands. Washington, DC: Island Press.
Volume 29 • Number 3 (2012) 319Transportation and Visitor Capacity Research and Planning at Yosemite National Park
Holly, F.M., J.C. Hallo, E.D. Baldwin, and F.P. Mainella. 2010. Incentives and disincentives
for day visitors to park and ride public transportation at Acadia National Park. Journal
of Park and Recreation Administration 28(2): 74–93.
Lawson, S., P. Newman, J. Choi, D. Pettebone, and B. Meldrum. 2009. The numbers game:
Integrated transportation and user capacity research in Yosemite National Park. Trans-
portation Research Record 2119: 83–91.
Lohr, S.L. 2009. Sampling: Design and Analysis. 2nd ed. Boston: Brooks/Cole.
Louter, D. 2006. Windshield Wilderness: Cars, Roads, and Nature in Washington’s National
Parks. Seattle: University of Washington Press.
Manning, R. 2001. Visitor experience and resource protection: A framework for managing
the carrying capacity of national parks. Journal of Park and Recreation Administration
19: 93–108.
Manning, R. 2011. Studies in Outdoor Recreation. 3rd ed. Corvallis: Oregon State University
Press.
Manning, R., and W. Freimund. 2004. Use of visual research methods to measure standards
of quality for parks and outdoor recreation. Journal of Leisure Research 36(4): 552–
579.
Manning, R., D. Lime, W. Freimund, and D. Pitt. 1996. Crowding norms at frontcountry
sites: A visual approach to setting standards of quality. Leisure Sciences 18(1): 39–59.
National Park Service. 1997. VERP: The Visitor Experience and Resource Protection (VERP)
Framework—A Handbook for Planners and Managers. Denver: National Park Service.
National Park Service. 2009. Yosemite National Park visitor study, Summer 2009 (no. 215).
Moscow, ID: National Park Service Park Studies Unit.
Runte, A. 1990. Yosemite: The Embattled Wilderness. Lincoln: University of Nebraska Press.
Shaffer, M.S. 2001. See America First: Tourism and National Identity, 1880–1940. Washing-
ton, DC: Smithsonian Institution Press.
Shelby, B., and T.A. Heberlein. 1986. Carrying Capacity in Recreation Settings. Corvallis:
Oregon State University Press.
Smith, S., G. Ritter, A. Seetharaman, and S. Peterson. 2003. Yosemite National Park Traffic
Information System Network Model. Washington, DC: National Park Service.
TRB [Transportation Research Board]. 2010. HCM 2010: Highway Capacity Manual.
Washington, DC: Transportation Research Board of the National Academies.
Vaske, J., A. Graefe, B. Shelby, and T. Heberlein. 1986. Backcountry encounter norms:
Theory, method, and empirical evidence. Journal of Leisure Research 18: 137– 153.
White, D.D. 2007. An interpretive study of Yosemite National Park visitors’ perspectives
toward alternative transportation in Yosemite Valley. Environmental Management
39(1): 50–62.
White, D.D., J.F. Aquino, M. Budruk, and A. Golub. Visitors’ experiences of traditional and
alternative transportation in Yosemite National Park. Journal of Park and Recreation
Administration 29(1): 38–57.
Whittaker, D., B. Shelby, R. Manning, D. Cole, and G. Haas. 2011. Capacity reconsidered:
Finding consensus and clarifying differences. Journal of Park and Recreation Admini-
stration 29(1): 1–20.
320 The George Wright ForumTransportation and Visitor Capacity Research and Planning at Yosemite National Park
Youngs, Y. L., White, D. D., and Wodrich, J. A. (2008). Transportation systems as cultural
landscapes in national parks: The case of Yosemite. Society and Natural Resources
21(9): 797–811.
Dave D. White, School of Community Resources and Development, Arizona State Univer-
sity, 411 North Central Avenue, Suite 550, Phoenix, AZ 85004; dave.white@ asu.edu
Stacy Tschuor, David Evans and Associates, 1331 17th Street, Suite 900, Denver, CO
80202; sst@deainc.com
Bill Byrne, IBI Group, 401 17th Street, #610, Denver, CO 80202; bill.byrne@ibigroup.com
Volume 29 • Number 3 (2012) 321You can also read