Short Report - The Knowledge Hub
←
→
Page content transcription
If your browser does not render page correctly, please read the page content below
Short Report
The First National TB Prevalence Survey | South Africa 2018

FOREWORD
South Africa (SA) is one of the 30 high burden tuberculosis (TB) countries contributing 87% of the estimated incident
TB cases worldwide, on its own SA accounts for 3% of cases globally. Among these 30 high burden TB countries,
the country is among the 14 countries with the highest burden of TB, TB/HIV and multi-drug resistant TB (MDR-TB).
The country’s TB epidemic is driven by a number of factors including low socio-economic status and a high HIV co-
infection burden. Additionally, delayed health-seeking behaviour among individuals with TB, as well as a high burden of
undiagnosed disease in communities also drive the TB epidemic.

In August 2017 we commenced the first ever national TB prevalence survey, a survey that used Xpert MTB/RIF Ultra
technology and liquid culture to test for TB among the adult population (≥ 15 years) in 110 clusters across South Africa.
The Survey was conducted in line with international guidelines in accordance with the World Health Organization
recommendations for conducting national TB prevalence surveys.

This report represents a milestone in the history of TB management and research. It provides a precise estimate of the
TB burden as well as health seeking behaviour of TB patients and those reporting TB symptoms.

The Survey confirms the estimated high burden of TB in SA, identifies existing gaps and provides recommendations
for improving TB management. We urge all stakeholders to work with the Government though the National TB
Programme to ensure that the findings of this report are used to inform strategies that will have a meaningful impact
towards ending TB in the country.

We take this opportunity to express our gratitude to the highly-competent team of Survey Investigators and local and
international technical experts. We thank the Survey Participants, volunteers and communities that offered their time
and support that enabled us to successfully conduct the Survey in the country. We thank the Global Fund to Fight AIDS,
TB and Malaria, the Bill and Melinda Gates Foundation and the United States Agency for International Development for
their financial support that helped make the Survey a reality.

Martie van der Walt                                                                                     Sizulu Moyo
Co-Principal Investigator                                                                      Co-Principal Investigator
South African Medical Research Council                                               Human Sciences Research Council

                                                                                                                        3
The First National TB Prevalence Survey | South Africa 2018

ACKNOWLEDGEMENTS
This survey would not have been possible without collaboration between the South African National Department of
Health TB Programme; the South African Medical Research Council; the Human Sciences Research Council; the National
Institute for Communicable Diseases; the World Health Organization, (South Africa Office and Geneva); the United
States Agency for International Development, the Global Fund to Fight AIDS, Tuberculosis and Malaria and the Bill and
Melinda Gates Foundation. We thank the World Health Organization technical team for critical support in the analysis
of the survey data, interpretation of the findings and writing of this report. Finally, we would also like to thank the entire
survey team (administrative staff, laboratory staff, the field teams), the provincial, district and local leaders within the
different spheres of government across the country, community leaders, communities and the people of South Africa
who participated without whom this survey would not have been possible.

                                                         FROM THE AMERICAN PEOPLE

4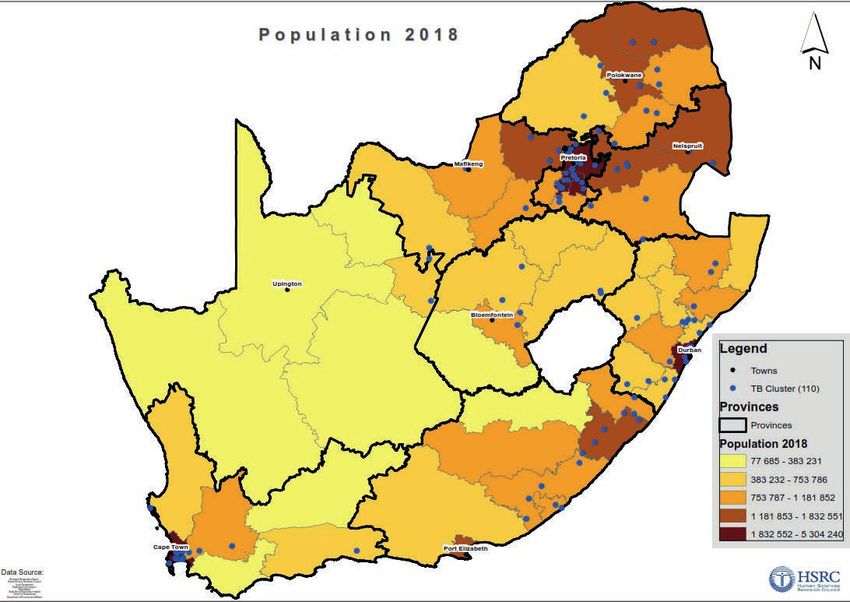
The First National TB Prevalence Survey | South Africa 2018

SURVEY INVESTIGATORS
National Department of Health                   South African Medical Research Council
Dr Yogan Pillay                                 Prof Martie van der Walt
Mr David Mametja                                Prof Samuel Manda
Dr Lindiwe Mvusi                                Ms Thuli Mthiyane
Mr Sicelo Dlamini
Mr Phumlani Ximiya
Mr Mbhekiseni Khumalo

Human Sciences Research Council                 National Institute for Communicable Diseases
Dr Sizulu Moyo                                  Prof Nazir Ismail
Prof Khangelani Zuma                            Dr Farzana Ismail
Dr Jeremiah Chikovore                           Ms Cecilia De Abreu
Dr Olanrewaju Oladimeji                         Prof Adrian Puren
Dr Inbarani Naidoo                              Ms Beverley Singh

World Health Organization
Dr Irwin Law
Dr Nkateko Mkhondo
Mr Phaleng Maribe
Dr Patrick Hazangwe
Dr Marina Tadolini
Dr Sismanidis Charalambous

                                                                                               5
The First National TB Prevalence Survey | South Africa 2018

1. INTRODUCTION
    South Africa is one of the 30 high burden tuberculosis (TB) countries that collectively contribute to 87%
    of the estimated incident cases worldwide, and the country accounts for 3% of cases globally. Adjusting for
    population size, South Africa is often ranked the highest in terms of incidence rate for TB. The high rates of TB
    have been fueled from the early 1990s by the HIV epidemic that negatively impacted TB control in the country.
    That pattern has now reversed since the aggressive scale up of antiretroviral treatment. Evidence of declines
    of TB incidence date back to 2008 and this has been consistent between laboratory confirmed pulmonary TB
    (PTB) incidence rates and notification data reported by the National Department of Health.

    In the 2019 Global TB report, the HIV co-infection rate among notified TB cases in South Africa was 59%,
    which highlights the continued importance of HIV to the TB epidemic. What stands out however in that
    report is the large difference in the modelled estimates of the burden of TB disease reported by the World
    Health Organization (WHO) compared with the number of notified TB cases who were started on treatment.
    While model estimates do have limitations, the gap is still large and would impact on efforts aimed at ending
    TB by 2035.

    Several efforts aimed at finding additional cases have been initiated. However, these have not provided much
    additional benefit and raised uncertainty around the accuracy of the modelled estimates which are based
    on reported TB notifications. Primary transmission of TB is a major driver of the epidemic and any missed
    cases are in fact missed opportunities with long term consequences. Thus, resolving the uncertainty of the
    true burden of TB disease through implementation of a national survey was needed. This would also assist in
    providing information about possible population groups that are being missed.

    Before the current survey, South Africa had never conducted a national TB prevalence survey and one was
    overdue. Since 2007, 33 surveys following standardized WHO methodologies have been conducted in 31
    countries. Importantly these surveys provide population level TB estimates at community level using an active
    case finding strategy as opposed to passive case finding that is used in routine practice. Furthermore, notification
    data only accounts for patients started on treatment, and previous studies have highlighted inaccuracies and
    under reporting within these data. The TB prevalence surveys conducted thus far in other countries have
    provided important insights to guide programmes to develop effective strategic plans aimed at Ending TB by
    2035. The prevalence survey data from these countries have also been incorporated into the global WHO TB
    models to improve the accuracy of the estimates reported annually.

    The aim of the First National TB Prevalence Survey was to enhance TB control in the country by informing the
    National TB programme (NTP) about the current epidemiological situation of TB disease and offering insight
    on ways in which TB control can be improved.

    The objectives were:

    i) To estimate the prevalence of bacteriologically confirmed pulmonary TB disease at a national level among
       the adult population (15 years and older) of the Republic of South Africa

    ii) To identify the extent to which people with pre-existing TB or with symptoms suggestive of pulmonary
        TB seek care and if so from which type of facility.

6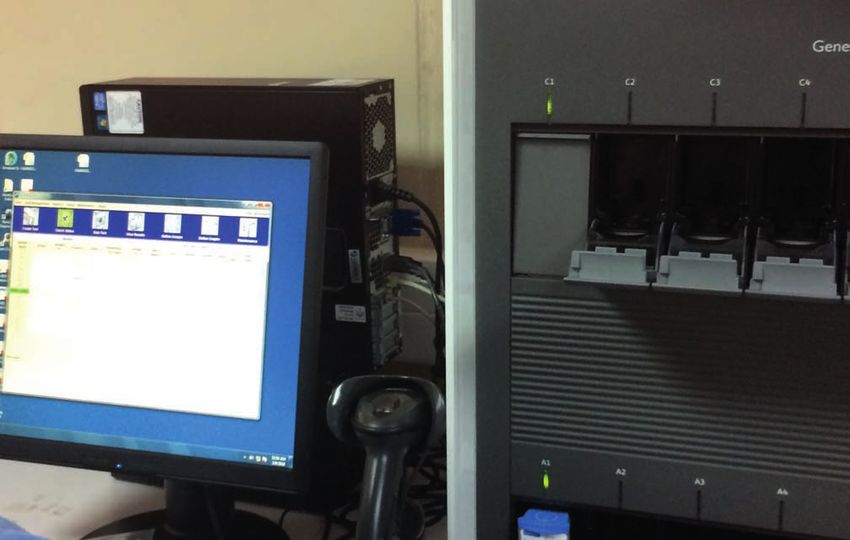
The First National TB Prevalence Survey | South Africa 2018

2. METHODOLOGY
    The survey followed the WHO handbook (Tuberculosis prevalence surveys: a handbook), for national TB
    prevalence surveys. Population proportionate cluster sampling (PPS) was performed and individuals aged 15
    years and older within the selected clusters were screened for symptoms suggestive of TB using a symptom
    screening questionnaire, and lung abnormalities suggestive of TB via digital chest X-ray (CXR). Those who
    screened positive by one or both modalities were eligible for sputum examination and were requested to
    submit two sputum samples, which were tested for TB using Xpert® MTB/RIF Ultra (Xpert Ultra) and liquid
    culture on the Bactec MGIT 960 (Becton Dickinson, USA) system. Prevalence estimates calculated accounted
    for sampling design and appropriate adjustments for participation and missing data.

    The survey was conducted on behalf of the South African National Department of Health (NDOH) by the
    South African Medical Research Council (SAMRC), the Human Sciences Research Council (HSRC) and the
    National Institute for Communicable Diseases (NICD).

2.1 Sampling
    The sample size was calculated based on historical data of smear-positive TB cases (350/100,000 adult
    population in 2013) and aimed for a relative precision of 20%. Sampling took into account the heterogeneous
    TB prevalence across the country with the nine provinces divided into three TB burden strata. Gauteng
    and Limpopo provinces comprised the low burden stratum; Free State, KwaZulu-Natal, and Mpumalanga
    provinces, the medium burden stratum; and Eastern Cape, Northern Cape, North West, and Western Cape
    provinces the high burden stratum. A selected fixed cluster size of 500 was used, with a resulting design effect
    of 1.44 (coefficient of variation k=0.5). Allowing for a participation rate of 85%, the required sample size was
    estimated at 54,873 individuals aged 15 years and above from 110 clusters. A stratified sampling design was
    applied to increase the precision and representativeness of the overall national prevalence estimate.

2.2 Inclusion and exclusion criteria
    Individuals meeting the criteria below were included in the survey:
    • persons aged 15 years and older
    • persons who had slept in the house for at least 10 nights in the prior two weeks
    • persons who could provide informed consent (assent and parental or guardian consent were required for
       those younger than 18 years).

    Individuals meeting the criteria below were excluded:
    • persons under the age of 15 years
    • those living in congregate settings, including prisons, hospitals, hotels, diplomatic compounds, schools,
       universities, dormitories and student hostels
    • persons who were visiting the area and had not slept in the house for at least 10 nights in the prior two
       weeks.

2.3 Survey operations
    The survey activities are summarized in Figure 1. The survey implementation consisted of four main stages: (i)
    stakeholder engagement at various levels and starting at provincial level; (ii) a pre-survey visit to each cluster
    for survey preparation, social mobilization in the community, and pre-survey listing activities; (iii) the core
    data collection of household census (enumeration of individuals in each household), screening and specimen
    collection procedures and laboratory testing; and (iv) review of results to identify survey TB cases to inform
    the data analysis. The NTP was responsible for treatment of all cases identified.

                                                                                                                     7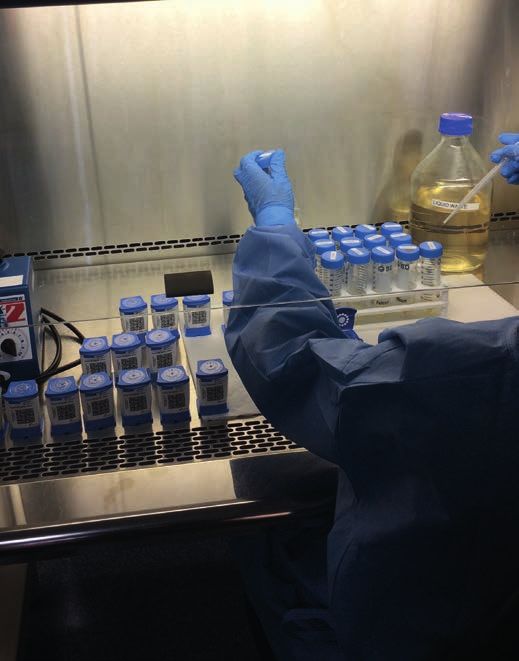
The First National TB Prevalence Survey | South Africa 2018
Stakeholder
engagement
Pre survey visit,
social mobilisation
Prelisting
activities Household census
Individual
questionnaire with TB
Data symptom screening
CXR screening
collection Specimen collection
Central Laboratory
CXR diagnosis
screening
Receiving,
Central data batching and
filing
management
Case management Editing
Panel discussion to Data entry
decide Cleaning
Survey cases Merging
Survey result Central Validation
Data analysis team
TB case information
TB Control and treatment
Programme recommendation
Figure 1: Survey flow diagram
In each cluster the provincial, district and local level stakeholders were consulted before work could begin. A
census of the target population in the cluster was conducted prior to the formal survey operations. A household
questionnaire was administered to the head of the household. The questionnaire listed all the household
members and collected their demographic information. Individuals eligible to participate were provided an
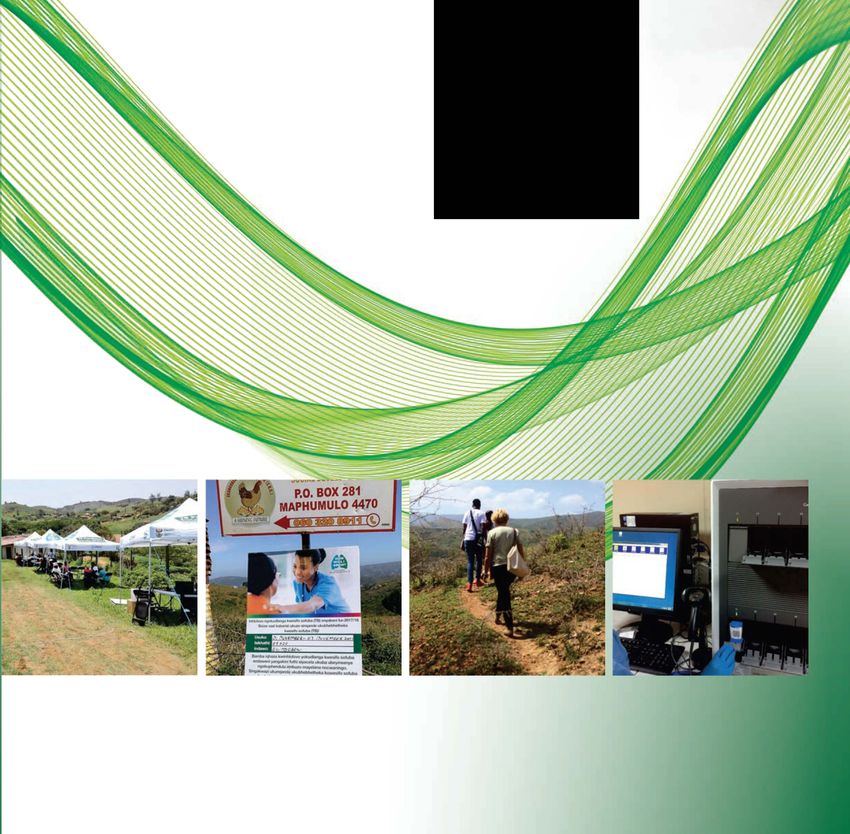
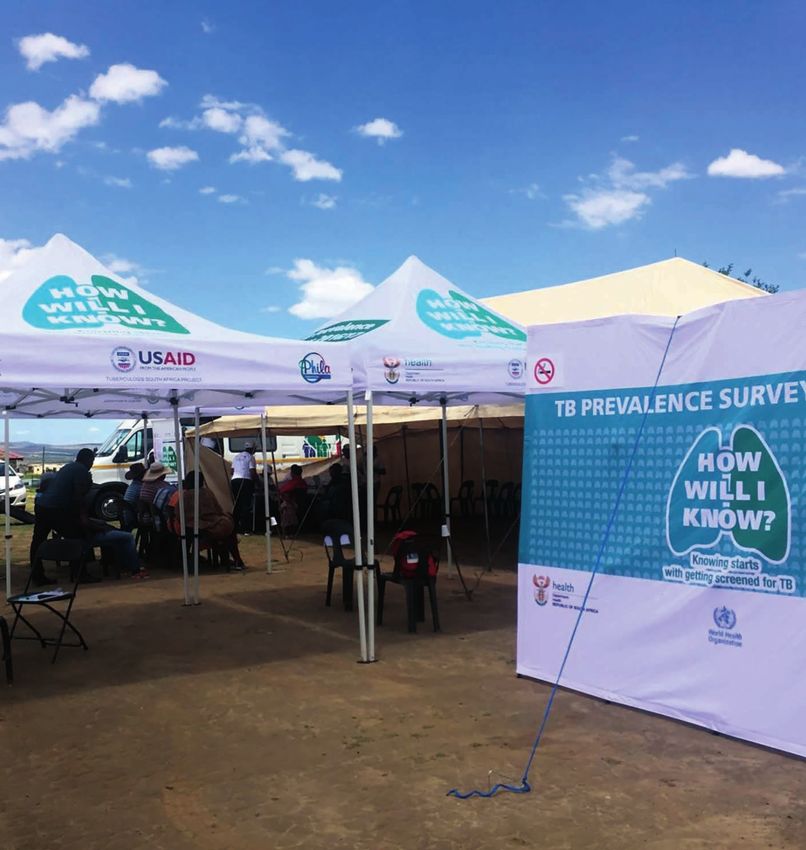
invitation slip to present themselves at the temporary survey site in the area. The site was capacitated to
provide facilities for participant interviews, specimen collection and CXR using a mobile CXR truck (Figure 2).
Participant interviews collected individual demographic information, information about current and past TB
treatment, and HIV status. Participants could decline to disclose their HIV status. A symptom screen was also
completed during the interview and those with any one or more of the following symptoms were eligible for
sputum examination: (i) cough of any duration, (ii) unexplained weight loss, (iii) drenching night sweats, or (iv)
unexplained fever. Those who reported these symptoms were asked about care seeking for the symptoms.
Additionally, all participants had a CXR taken and if any abnormalities suggestive of TB were observed, they
were also eligible for sputum examination. Participants who could not undergo a CXR for any reason (because
they declined to consent for the CXR, or were pregnant, or had disabilities that made it impossible to take
the CXR, or were bed ridden and not able to attend the screening site) were eligible for sputum examination
regardless of the symptom findings. CXRs were read in the field by medical officers (MOs) who were trained
to over-read so as to increase the sensitivity of screening and to avoid missing any potential TB cases.
Participants eligible for sputum examination were asked to produce two sputum samples, one on the spot
and the second one an hour later. All samples were couriered under cold chain conditions and tested at the
Centre for Tuberculosis (CTB) at the NICD. The first sample was tested with Xpert® MTB/RIF Ultra (Cepheid,
USA) and the second underwent liquid culture on the Bactec MGIT 960 (Becton Dickinson, USA) with further
speciation to confirm the presence of Mycobacterium tuberculosis complex in positive cultures.
8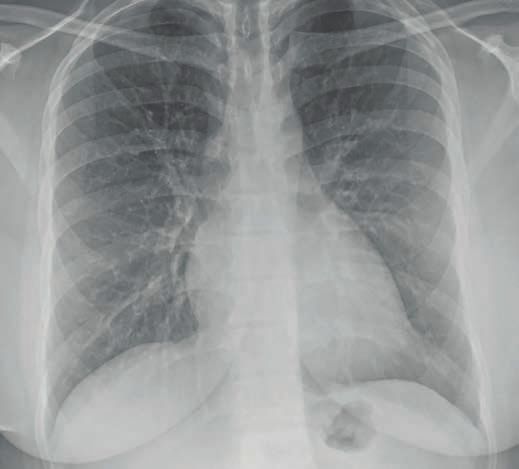
The First National TB Prevalence Survey | South Africa 2018

    Participants who were eligible for sputum exami-nation were also asked to have a dried blood spot (DBS)
    sample taken for HIV testing. HIV testing was performed by the Centre for HIV and STIs (CHIVSTI) at the
    NICD using two assays, (i) the Genscreen Ultra HIV Ag/Ab (BioRad, Hercules, California, USA), which was
    used as the primary screen, and (ii) the Murex HIV Ag/Ab Combination (Diasorin, Saluggia, Italy), which served
    as the confirmatory assay for those that tested positive on the Genscreen. All samples that were positive on
    the confirmatory assay were reported as positive. If the results of the two assays were discordant the screen
    assay was repeated. If the results were still discordant then the Genscreen HIV-1 Western Blot (BioRad) assay
    was performed to confirm the final test result.

2.4 Central CXR reading
    All field CXRs that were reported to have abnormalities suggestive of TB by MOs in the field were also
    reviewed by a central radiologist. The radiologist also reread 20% of all CXRs that were reported as normal
    by the MOs. An external CXR reading panel also read the CXRs of participants who had Xpert Ultra positive
    and / or culture positive results.

2.5 Case definition
    Due to concerns related to possible false-positive results from Xpert Ultra in low pre-test probability settings
    such as surveys, the final definition of a survey TB case aimed to be conservative but robust. The final case
    definition was derived following input from the WHO technical support team as well as several workshops
    they held on the topic. A TB case in this survey was defined as any Mycobacterium tuberculosis complex
    culture positive case irrespective of Xpert Ultra results assuming there was no cross-contamination. When the
    culture was not positive for Mycobacterium tuberculosis complex (this included negative cultures, contaminated
    cultures, and cases where culture was not done because there was no sample), additional survey TB cases were
    defined as follows: (i) Xpert Ultra results were positive (trace results were re-classified as negative), (ii) the
    participant did not have a history of a previous TB episode (i.e. no history of TB past or current), and (iii) the
    CXR findings were suggestive of active TB as confirmed by an external CXR reading panel.

    The final HIV status for this survey was determined using the DBS result where this was available, and by self-
    reported status where there was no DBS result. HIV status was classified as unknown where there was no
    self-reported status and no DBS result.

    Figure 2: Survey Field team and participants: a survey site with tents and mobile X-ray equipment
    in a rural area.

                                                                                                                     9
The First National TB Prevalence Survey | South Africa 2018

 2.6 Linking survey participants to care
     All Xpert Ultra and culture positive results were
     sent to the TB programme through the district TB
     coordinator in which the cluster was located. The
     coordinators were responsible for ensuring that
     the participants with these positive results were
     traced and started on TB treatment.

     Participants who gave a blood sample for HIV
     received a barcoded voucher that they presented
     at the clinic if they wanted their HIV results. The
     barcoded voucher was given to the participant
     at the time of DBS sample collection. When the
     participant presented at the clinic for HIV results,
     the clinic followed the national HIV testing and
     screening guidelines to test the participant. The
     clinics followed the national HIV testing and
     screening guidelines before release of these results
     to participants. Participants who were found to
     have acute and/or other medical concerns on
     screening or on CXR were referred to their local
     clinic for further evaluation and management.

 2.7 Ethical considerations
     The protocol was approved by the SAMRC research ethics committee (Reference EC001 2/2012). All
     participants gave informed consent for participation. Participants aged under 18 years signed an assent form
     and their legal guardian gave the informed consent for their participation. Participants were provided with
     reimbursements for their time spent on the survey. The reimbursements included food and household grocery
     items or mobile phone credit (i.e. airtime) to the value of R50 (approximately USD5 at the time) and were
     introduced from cluster 10 onwards.

 2.8 Data management and analysis
     All field records were captured on tablets and entered into a RedCap application specially designed for the
     survey. Staff were trained on how to use the application, which had built-in validity checks to ensure data
     accuracy and completeness. The application was also made available to the laboratory staff and the central
     radiologist to enter laboratory results and central CXR readings against the unique identifier allocated to each
     participant. The data manager worked closely with the field data staff in each team to review the data regularly
     for consistency and completeness, and also liaised closely with the laboratory staff, the radiologist and the case
     management team. To inform data analysis, the case management team reviewed the data of all participants
     with laboratory positive results, and decided on the survey cases with the input from the external CXR panel.

     Data analysis was conducted using STATA Version 15.0 (College Station,Texas, USA). Frequency and percentage
     distributions were generated to describe the survey data. Prevalence was estimated based on the number
     of TB cases detected as defined above among participants. Three methods were considered to estimate the
     prevalence of bacteriologically confirmed tuberculosis: (1) cluster-level analysis, (2) individual-level analysis, and
     (3) estimation with inverse probability weighting (IPW), and with multiple value imputation (MI). The latter,
     which accounted for missing data and non-participation, was the most robust option to derive the estimates.
     This is the option that is recommended by WHO and generally used in other TB prevalence surveys. The
     imputation model included the following variables: age group, CXR panel reading, cough of more than two
     weeks, HIV status, sex, TB burden strata, and race.

10
The First National TB Prevalence Survey | South Africa 2018
3. RESULTS
3.1 Overview of sampling and participation
Survey activities were completed in 110 clusters across South Africa, as shown in Figure 3 based on PPS
sampling. The first cluster was enrolled in August 2017 in Kwa-Zulu Natal Province and the last cluster was
completed in July 2019 in the Western Cape Province.
Figure 3: National TB prevalence survey: location and distribution of survey clusters
A total of 68,771 people were enumerated across the 110 clusters. Figure 4 shows a comparison of the
national population (National census, 2011) and the population enumerated in the survey at household level.
There were some differences between the populations including (i) a lower percentage of children aged 0-14
years (both males and females) enumerated compared to the national population (6.9% compared to 10.9%
among those 0-4 years, 21.7% compared to 30.1% overall for 10-14 years), (ii) higher proportions of females
in the survey population when compared to the national population (19.5% compared to 17.8% in those aged
15- 24 years, and 11.0% compared to 9.4% in those aged 45-54 years), and (iii) a higher proportion of older
males enumerated compared to the national population, 6.3% compared to 4.1%.
11The First National TB Prevalence Survey | South Africa 2018
65+
55-64 Male Female
45-54
Age group (years) 35-44
25-34
15-24
10-14
5-9The First National TB Prevalence Survey | South Africa 2018
Participation was low for both sexes with that of men consistently lower than for women in all age categories
(Figure 6). Participation was lowest among the youth but improved with increasing age.The lowest participation
rate was observed in men aged 25-34 years while the highest was among females aged 55-64 years.
Figure 6: Participation by age and sex compared to the eligible population as enumerated at household level
3.3 Characteristics of survey participants
Among the 68,771 enumerated people, 53,250 (77.4%) met the survey inclusion criteria and 35,191 (66.1%)
participated (Figure 7), median age 37 years (IQR 25-55), and 13,388 (38.0%) were males. Approximately a
quarter of participants 25.8% (9,066) were positive on screening based on symptoms and/or CXRs; median
age 49 years (IQR 33-63); and 3,849 (42.5%) were males. Among these 82.9% had a valid Xpert Ultra and
80.6% had a valid culture result available (Figure 7), and 7,292 (80.4%) had both a valid Xpert Ultra and culture
result.
Screening for TB by symptoms and CXR findings
Among the 9,066 participants who were eligible for sputum examination, 19.1% (1,733) had both symptoms
and abnormal CXR findings suggestive of TB as read by MOs in the field. The majority of participants screened
positive by only one modality; 39.3% (3,566) screening positive by CXR findings only and 37.9% (3,435) by
symptoms only, and in 3.7% (332) CXRs were not done (Figure 8).
Total population enumerated at
• 68,771
the household level
Individuals eligible to participate
• 53,250 (77.4% of enumerated)
at household level
Eligible individuals who
• 35,191 (66.1% all eligible = participation rate)
participated
Participants screened positive
• 9,066 (25.8% of participants) eligible for sputum
(symptoms and/or abnormal
collection
CXR)
Valid Xpert Ultra result • 7,521 (82.9% of screened positive)
Valid culture result • 7,305 (80.6% of screened positive)
Figure 7: Summary of the enumerated population and survey participants
13The First National TB Prevalence Survey | South Africa 2018
3.7%
19.1%
39.3%
37.9%
Abnormal CXR only Symptoms only Symptoms & Abnormal CXR *CXR not done
Figure 8: Eligibility for sputum examination by symptoms and CXR findings, N = 9,066
*CXR was not done because the participant declined to consent, or was pregnant, or had disabilities that made it
impossible to take the CXR, or was bedridden and not able to attend the screening site.
3.4 Culture and Xpert Ultra Results
Among the 9,066 participants eligible for sputum examination there were 220 with culture positive results and
223 with Xpert Ultra positive results (Table 1). Among the 223 participants with Xpert Ultra positive results,
144 also had positive culture results, while 66 had negative culture results, 9 had contaminated samples and 4
did not have a culture result.
Table 1: Culture and Xpert Ultra results among participants eligible for sputum examination, N = 9,066
Xpert Ultra results
Culture results Not Total
Xpert Ultra Xpert Ultra
Invalid done/
positive negative*
Rejected
Culture positive 144 74 0 2 220
Culture negative 66 6,460 11 49 6,586
Culture contaminated 9 383 0 4 396
Non-tuberculous mycobacteria 0 145 0 0 145
Not done/Rejected/ Sputum not
4 224 1 1,490 1,719
collected
Total 223 7,286 12 1,545 9,066
* 71 trace Xpert Ultra cases were found, and were regarded as negative
3.5 TB survey cases
A total of 234 cases met the survey TB case definition (Figure 9). These comprised of 220 culture positive
cases, of which 144 were Xpert Ultra positive, 74 were Xpert Ultra negative and two were not tested by
Xpert Ultra. An additional 14 cases that were classified as TB survey cases were Xpert Ultra positive, culture
was not positive for Mycobacterium tuberculosis complex as per the survey definition, did not have a history of
TB, and had CXR findings that were suggestive of active TB as confirmed by the external CXR reading panel.
14The First National TB Prevalence Survey | South Africa 2018
Xpert Ultra
Culture Total
Positive Negative/Not Done
Positive 144 76 220
Not Positive 79
220 + 14
History of TB: Past or current No history of TB: Past or current = 234 cases
Not a case n = 49 Possible cases n = 30
Panel CXR reading
CXR not suggestive of active TB CXR suggestive of active TB
Not a case n = 16 A case n = 14
Figure 9: Survey TB cases by culture and Xpert Ultra, N = 234.
Trace Xpert Ultra results were regarded as negative.
Symptoms and CXR findings among survey TB cases
Among the 234 survey cases more than half (135; 57.7%) had CXR abnormalities only without reported
symptoms; 82 (35.0%) were symptomatic with CXR abnormalities, 16 (6.8%) reported symptoms only and
one (0.4%) case did not report symptoms and had not undergone CXR (Figure 10). CXR abnormalities among
survey cases were confirmed by an external CXR reading panel.
0.4%
6.8%
35.0%
57.7%
Abnormal CXR only Symptoms & Abnormal CXR Symptoms only *CXR not done
Figure 10 Symptoms and/or abnormal CXR among survey cases, N = 234
*CXR was not done because the participant declined to consent, or was pregnant, or had disabilities
that made it impossible to take the CXR, or was bedridden and not able to attend the screening site.
15The First National TB Prevalence Survey | South Africa 2018
3.6 HIV status among survey participants
Table 2: HIV status among survey participants, N = 35,191
Participants with a HIV prevalence among
known participants with a known HIV
HIV status status
Known
HIV HIV % HIV
Category Total HIV %
Negative Positive Positive
status
All participants 35,191 26,877 76.4 22,289 4,588 17.1
All Screen positive participants 9,066 7,061 77.9 5,414 1,647 23.3
Screen positive participants by
5,168 4,173 80.7 3,156 1,017 24.4
symptoms only
Screen positive participants by
3,566 2,641 74.1 2,060 581 22.0
CXR only
Survey cases 234 191 81.6 136 55 28.8
*Programme cases 178 162 91.0 68 94 58.0
HIV status determined by a DBS result and in its absence the self-reported status. HIV status unknown: no DBS result and no self-reported
status. *Programme cases: individuals already on treatment through the NTP prior to enrolment into the survey.
HIV status was known for 76.4% (26,877) of participants (Table 2). HIV testing on DBS was done on 2,189
(24.1%) of the screen positive participants. Among those with a known HIV status, there was a sequential
increase in the percentage of participants with HIV starting with all participants (17.1%), followed by screen
positive participants (23.3%), then survey cases (28.8%) and finally programme cases (58.0%) enrolled into
the survey. Programme cases were individuals who were already on treatment through the NTP prior to
enrolment into the survey. The percentage of participants with HIV among programme cases was very similar
to the notification data (59%).
The percentage of participants with HIV increased as the number of symptoms increased reaching 45.4%
among those who reported 4 symptoms (Table 3). Of the 107 survey cases who did not report any symptoms,
and had a known HIV status, 83 (77.6%) were HIV negative.
Table 3: HIV infection stratified by number of symptoms among participants identified as survey
cases with a known HIV status, N = 191
TB survey cases with a known HIV status
Number of TB HIV % HIV
HIV Positive Total
Symptoms Negative co-infection
0 24 83 107 22.4
1 10 24 34 29.4
2 10 14 24 41.7
3 6 9 15 40.0
4 5 6 11 45.4
Total 55 136 191 28.8
Symptoms included cough, fever, night sweats and unexplained weight loss
16The First National TB Prevalence Survey | South Africa 2018
3.7 Estimated prevalence of bacteriologically confirmed pulmonary TB
Table 4: Estimated prevalence of bacteriologically confirmed pulmonary TB (≥15 years), by sex and by age
group, South Africa, 2018 (Method: IPW+MI)
Prevalence per 100,000 population 95% CI
Sex
Male 1,094 835 – 1,352
Female 675 494 - 855
Age group (years)
15-24 432 232 - 632
25-34 902 583 – 1,221
35-44 1,107 703 – 1,511
45-54 1,063 682 – 1,443
55-64 845 505 – 1,186
≥65 1,104 680 – 1,528
The estimated prevalence of pulmonary TB in males 15 years and older was more than 1,000 per 100,000
population and was approximately 1.6 times that of women. Prevalence peaked in those aged 35-44 years and
in those aged 65 years and older and was lowest among those aged 15-24 years (Table 4).
The survey estimated the prevalence of bacteriologically confirmed pulmonary TB in South Africa at 852
(95% CI 679-1,026) per 100,000 population among individuals 15 years and older. Using this survey estimate,
the prevalence of TB for all forms of TB and ages in South Africa were calculated adjusting for individuals
less than 15 years (29%), a rate ratio of child to adult TB (0.6) and the proportion of notified cases that are
extra-pulmonary TB (9.7%). This was performed by the WHO using standard methods. The estimated
prevalence of TB (all ages, all forms) in South Africa in 2018 was 737 (95% CI 580-890) per
100,000 population.
17The First National TB Prevalence Survey | South Africa 2018
3.8 Estimated number of TB cases in the community
Figure 11 shows the estimated number of TB cases in the community for 2018 using the point estimate data
from Table 4 and stratified by age. The highest estimated number of cases was among those aged 25-34 years.
Although the estimated number of cases in those aged 65 years and older was lower than some of the other
age groups, the prevalence was above 1%.
120000 1200
Estimated number of bacteriologically
Prevalence per 100 000 population
100000 95361 1000
88918
confirmed TB cases
80000 800
59989
60000 600
42496
40000 400
32351 33929
20000 200
0 0
15-24 25-34 35-44 45-54 55-64 65+
Age group (years)
Figure 11: Comparison of the estimated number of bacteriologically confirmed TB cases (blue bar) with
prevalence (red line) by age group (≥15years), South Africa, 2018
3.9 The Prevalence to Notification (P:N) ratio
The ratio of the bacteriologically confirmed pulmonary TB cases (Figure 9) to the case notification rate (2018)
(prevalence to notification, P:N ratio) is shown in Table 5. Across all age groups and in both males and females
more cases were estimated than were notified. The largest gap was in those aged 15-24 years and the elderly
65 years and older where the P: N ratios were 2.91 and 2.88 respectively. The ratios for males and females
were 1.89 and 1.70 respectively.
Table 5: Ratio of prevalence to notification for
pulmonary TB, ≥15 years, South Africa, 2018
Category P:N ratio
Total 1.75
Male 1.89
Female 1.70
15-24 years 2.91
25-34 years 1.61
35-44 years 1.55
45-54 years 1.66
55-64 years 1.63
≥65 years 2.88
18The First National TB Prevalence Survey | South Africa 2018
3.10 Health care seeking among participants with symptoms of TB
Among the 5,168 survey participants who reported at least one TB symptom, the majority 3,442 (66.6%) did
not report seeking care for the symptoms at the time of their participation in the survey. Among these, more
males (71.3%) than females (63.4%) did not seek care (Table 6).
The percentage of symptomatic participants who did not seek care was highest in younger participants and
decreased with increasing age starting at 82.3% in those aged 15-24 years, then 62.9% in those 45-54 years old
and 54.8% in those 65 years and older. Fifty-six percent (56.4%) of HIV positive participants had not sought
care for their symptoms compared to 68.6% of those who were HIV negative.
Table 6: Number and percentage of symptomatic participants who had not sought care, N = 3,442
Category Number of Number of % of participants that
symptomatic participants that did did not seek care
participants not seek care
Male 2,104 1,500 71.3
Female 3,064 1,942 63.4
15-24 years 678 558 82.3
25-34 years 869 688 79.2
35-44 years 850 573 67.4
45-54 years 859 540 62.9
55-64 years 897 526 58.6
≥65 years 1,016 557 54.8
HIV negative 3,156 2,164 68.6
HIV positive 1,017 574 56.4
Among the 3,442 participants with symptoms who had not sought care, the majority 2,071 (60.2%), indicated
that they were planning to seek care. A further 917 (26.6%) felt their symptoms were not serious enough for
them to seek care, 223 (6.5%) reported not having sufficient money to travel a health facility, and 189 (5.5%)
reported that the health care facility was too far away for them to attend (Figure 12a).
Among the 1,726 participants with symptoms who had a sought care, more that 90% had attended a
government facility, with the majority attending a community clinic (1,497; 86.7%) and 139 (8.1%) seeking care
from the private sector (Figure 12b).
19The First National TB Prevalence Survey | South Africa 2018
care
seeking care Missing
Missing 1.2
1.2
Stillto
Still toseek
seekcare
care 60.2
60.2
not seeking
Symptomsregarded
Symptoms regardedas
asnot
notserious
serious 26.6
26.6
for not
Nomoney
No moneyto
totravel
travelto
tohealth
healthfacility
facility 6.5
6.5
Reason for
Reason
Healthfacility
Health facilitytoo
toofar
far 5.5
5.5
00 10
10 20
20 30
30 40
40 50
50 60
60 70
70 80
80 90 100
90 100
Percent(%)
Percent(%)
*Multiplereasons
*Multiple reasonsallowed
allowed
Figure 12a: Reasons for not seeking care by symptomatic participants, N = 3,442
Communityclinic
Community clinic 86.7
86.7
sought
was sought
PrivateClinic/hospital
Private Clinic/hospital 8.1
8.1
care was
where care
Place where
Provincial/Districthospital
Provincial/District hospital 4.5
4.5
Place
Other
Other 0.8
0.8
00 10
10 20
20 30
30 40
40 50
50 60
60 70
70 80
80 90
90 100
100
Percent(%)
Percent(%)
Figure 12b: Place where care was sought by symptomatic participants, N = 1,726
Of the 234 participants identified as TB cases in the survey 41 (17.5%) who were symptomatic had sought
care for their symptoms before the survey: 31 attended a community clinic, 4 attended a government hospital
and 6 attended a private sector facility. Among these 41 participants 8 (19.5%) were on treatment for TB at
the time of enrolment into the survey.
20The First National TB Prevalence Survey | South Africa 2018
4. DISCUSSION AND PROGRAMMATIC
IMPLICATIONS
4.1 South Africa has a high TB burden including many people with undetected TB
in the community
The prevalence of TB (all forms, all ages) in South Africa in 2018 was 737 (95% CI 580-890) per 100,000
population. Restricted to pulmonary TB and based on the survey findings, prevalence was lowest in the youth
(15-24 years), and peaked in those aged 35-44 years and the elderly aged 65 years and older where it exceeded
1%; (1,107/100,000 (95% CI 703–1,511), and 1,104/100,000 (95% CI 680–1,528), respectively. TB prevalence
was higher in males than in females. The estimated number of TB cases was more than the cases notified in
the same year which is an important finding implying risk for ongoing transmission. The largest prevalence to
notification gap was in the youth aged 15-24 years and in those 65 years and older. To effectively deal with the
TB epidemic this gap needs to be closed. The three important findings identified from this survey related to
these issues are that:
i) Men often have TB and are undetected or not reported to the NTP
The TB burden was higher among males, with a prevalence almost 1.6 times that of females. This finding
is consistent with findings from other TB prevalence surveys in Africa and Asia. The disproportionately
high TB prevalence of TB among men has previously been associated with delays in seeking care and
access barriers. Similar concerns have been noted in the HIV programme and joining efforts to provide
male friendly health services are needed.
ii) Sub-clinical TB is underestimated as a contribution to the TB burden
An important finding in this survey was a very high proportion (57.8%) of TB cases in participants who
did not report any TB symptoms at the time of the survey and yet had bacteriological confirmation of
TB. A review of surveys in Asia reported a range between 40% and 79% of TB cases without symptoms,
hence this finding is not new, but it partly explains the gap in undetected TB. Sub-clinical TB is an emerging
area that requires further research both in terms of tools to detect it and appropriate treatment and
management regimens. Individuals with sub-clinical TB, though not “overtly suffering” from TB when
they present, represent a phase in the continuum of TB disease and may in time develop symptoms
and present to care. They do however have the propensity to infect others even at this early stage and
efforts to address this issue will be important if the long term goals to “End TB” are to be realized.
iii) TB in HIV-negative individuals is also common
The percentage of survey cases with HIV (28.8%) was half that reported for those participants on
treatment in the programme (58.0%). This finding is also consistent with information reported in
the literature of a higher burden of HIV negative TB when active case finding efforts are undertaken.
Interestingly, among TB cases who did not report symptoms, the majority were HIV negative (78%).Thus,
the higher than expected prevalence of TB in this survey was in part driven by undetected TB among
HIV negative individuals. It is however important to note that HIV positive TB cases were more likely to
be symptomatic. These individuals therefore would have a greater likelihood of being detected through
the programme as the current screening approach is based on symptoms. In addition more than two-
thirds of HIV negative symptomatic participants had not sought care for their symptoms. Thus, a strategy
to detect HIV negative cases earlier is needed and should include both patient as well as healthcare
provider education.
21The First National TB Prevalence Survey | South Africa 2018
4.2 Care seeking for individuals with TB symptoms is delayed
Care seeking among participants with symptoms suggestive of TB was delayed with almost two-thirds having
not sought care at the time of their participation in the survey, and 60.2% of these reporting that they were still
planning to seek care. A further 26.6% regarded the symptoms as not serious and thus did not seek care. In-
depth qualitative research is needed to better understand the reasons for delayed care seeking so as to inform
interventions to address this gap. In addition, interventions to increase knowledge of TB and awareness of TB
symptoms and their importance are still needed. Approximately a fifth (19.5%) of symptomatic participants
who were survey TB cases who had sought care for their symptoms had been diagnosed and started on
treatment. There should thus also be heightened vigilance in assessing TB symptoms among those who attend
health facilities in order to promote early diagnosis.
22The First National TB Prevalence Survey | South Africa 2018
5. STRENGTHS AND LIMITATIONS
The survey was a nationally representative population-based survey that has for the first time provided a
national estimate of the true burden of TB in South Africa. This was made possible by close collaboration of
major public institutions in the country working with the Department of Health. The prevalence estimates
derived followed WHO standardized methodology ensuring the robustness of estimates and allowing
comparisons to be made with other countries and regions. Additionally, important issues were uncovered
that will help future strategies to be formulated to effectively address the TB epidemic.
As with other national surveys of this scale there were a number of limitations that may have impacted the
prevalence estimates. A major limitation was the performance of Xper t Ultra in active case finding activities.
Given the specificity of Xper t Ultra [98% (95% CI 97-99%)], the rate of false-positive results for TB disease
is high in low prevalent settings like the general community as was targeted by this survey (This is unlike
in individuals who attend routine care). A history of TB can reduce specificity even further. Therefore, the
survey case definition was amended to ensure that a positive culture result or a CXR suggestive of active
TB was used to confirm Xpert Ultra positive results in those with no history of TB treatment. The analysis
thus used a conservative approach. The par ticipation rate of 66.1% was below the target level of 85%
and missing data which occurred due to various reasons probably impacted the estimates calculated. The
well established methodologies of multiple imputation with inverse probability weighting were used to
account for these limitations allowing robust estimates to be derived. The HIV status for many par ticipants
was based on self-repor t (24.1% of those eligible for sputum examination were tested for HIV on DBS), and
interpretation of the descriptive analysis should be viewed with this potential limitation in mind.
6. CONCLUSIONS
The First National Tuberculosis Prevalence Survey, South Africa, 2018, identified a high TB burden, higher
in males than in females and high prevalence of TB among individuals aged 35-44 years and the elderly 65
years and older. The largest prevalence to notification gap was in the youth aged 15-24 years and in those
65 years and older. A higher propor tion of TB was detected among HIV-negative individuals, with most
repor ting no symptoms. HIV positive par ticipants identified as TB cases had more symptoms and hence they
are more likely to be detected and treated in contrast to those who are HIV negative who are less likely to
repor t symptoms and potentially contribute to ongoing transmission of TB. Sub-clinical TB has emerged as
another area that requires fur ther research and will be impor tant for long term control effor ts. Although TB
symptoms at first may be perceived to be benign leading to delays in heath seeking, this perception needs to
be corrected as TB remains the number one infectious disease cause of mor tality in South Africa. In addition,
a high index of suspicion, evaluation and follow-up of people presenting with TB-related symptoms by health
care providers is needed to improve case detection.
23The First National TB Prevalence Survey | South Africa 2018
Knowing starts
with getting screened for TB
24The First National TB Prevalence Survey | South Africa 2018
NOTES
25The First National TB Prevalence Survey | South Africa 2018 NOTES 26
You can also read