The prevalence of polycystic ovarian syndrome in Chinese women: a meta-analysis
←
→
Page content transcription
If your browser does not render page correctly, please read the page content below
Original Article
The prevalence of polycystic ovarian syndrome in Chinese women:
a meta-analysis
Qiao Wu, Jing Gao, Dingxi Bai, Zhi Yang, Qing Liao
School of Nursing, Chengdu University of Traditional Chinese Medicine, Chengdu, China
Contributions: (I) Study conception and design: All authors; (II) Administrative support: J Gao; (III) Provision of study materials or patients: Q Wu,
Z Yang; (IV) Collection and assembly of data: Q Wu, Z Yang, Q Liao; (V) Data analysis and interpretation: Q Wu, D Bai, Z Yang; (VI) Manuscript
writing: All authors; (VII) Final approval of the manuscript: All authors.
Correspondence to: Jing Gao. School of Nursing, Chengdu University of Traditional Chinese Medicine, 1166, Liutai Avenue, Wenjiang, Chengdu
611137, China. Email: 729012934@qq.com.
Background: To estimate the prevalence of polycystic ovarian syndrome (PCOS) in Chinese women
comprehensively and to provide references to prevent PCOS.
Methods: China National Knowledge Infrastructure, Wanfang Data, China Science and Technology
Journal Database, Chinese Biology Medicine, PubMed, Embase, Web of Science, CENTRAL, CINAHL
were searched to collect studies on the prevalence of PCOS from database inception from March 31,
2020. Two reviewers independently screened literature according to the inclusion and exclusion criteria
of the articles, extracted data, and tested the risk of bias of the included studies. Then Stata 15.1 software
performed a meta-analysis. Begg’s and Egger’s method were used to assess the risk of publication bias.
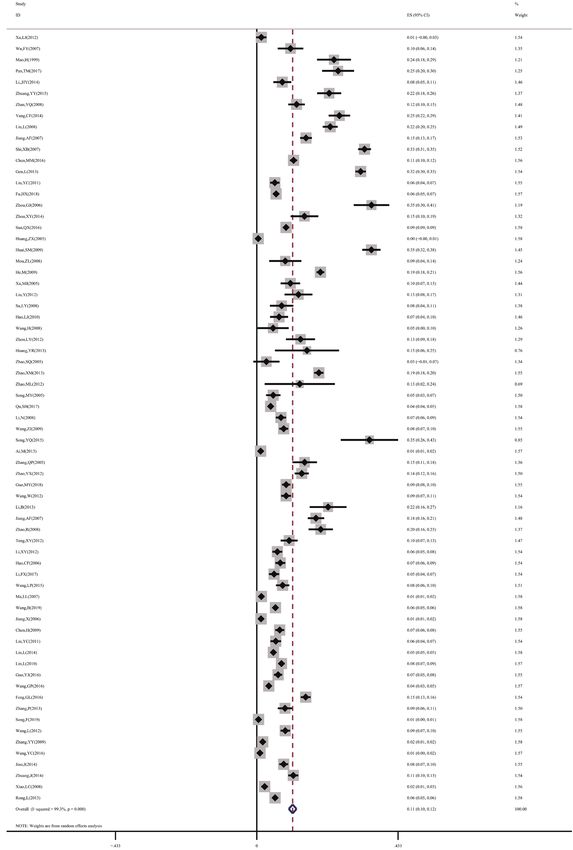
Results: A total of 69 studies were involved, including 154,599 participants, 12,845 patients developed
PCOS. The prevalence of PCOS was 10.01% (95% CI: 8.31% to 11.89%). Subgroup analysis showed
that the prevalence of PCOS in different regions was as follows: 13.35% in the west, 7.82% in the east,
14.24% in the middle, and 8.68% in the north-east. Subgroup analysis by occupation/status: the prevalence
rates of workers, students, medical staff, cadres, farmers, staff, and service staff were respectively 10.37%,
16.37%, 13.97%, 6.05%, 7.05%, 8.05%, 9.05%. For individuals aged 10 to 20, between 21 and 30, 31 to
40, and above 40, the prevalence rate was 10.26%, 17.23%, 9.13%, 2.22%, respectively. The prevalence
rates of PCOS 1995 to 2000 were 21.04%, from 2001 to 2005, was 5.86%, from 2006 to 2010 was 10.78%,
from 2011 to 2015 was 11.44%, and during 2016 to 2020 was 5.79%. Hospital-based community-based
and school-based studies were 13.41%, 5.95%, 3.01%. According to the subgroup analysis of the surveyed
population, the prevalence of PCOS in the general population and infertility patients were 6.05% and
13.69%, respectively
Conclusions: The prevalence rate of PCOS is high in Chinese women, and the prevalence of PCOS varies
with different regions, occupation/identity, age, time of publication, diagnostic criteria, survey time, and
prevalence of the surveyed population.
Keywords: Chinese woman; polycystic ovarian syndrome (PCOS); prevalence; meta-analysis
Submitted Aug 25, 2020. Accepted for publication Dec 29, 2020.
doi: 10.21037/apm-20-1893
View this article at: http://dx.doi.org/10.21037/apm-20-1893
© Annals of Palliative Medicine. All rights reserved. Ann Palliat Med 2021;10(1):74-87 | http://dx.doi.org/10.21037/apm-20-1893Annals of Palliative Medicine, Vol 10, No 1 January 2021 75
Introduction Web of Science were searched to collect studies on the
prevalence of PCOS in Chinese women from setting up
Polycystic ovarian syndrome (PCOS) is the most common
a database to May 31, 2020. To increase the sensitivity,
gynecological, endocrine system disease among women
we use a combination of subject heading terms and free
aged 18 to 44 (1). Its key characteristics are persistent
text words to retrieve documents. The subject headings
anovulation, hyperandrogenism, and insulin resistance.
include: “polycystic ovarian syndrome” and “prevalence” or
The main manifestations are menstrual disorders and
“incidence” or “epidemiology” and “China” or “Chinese.”
reproductive dysfunction (2-4), one of the leading causes of
The free words include: “The People’s Republic of China”
females in anovulatory infertility (5,6). The World Health
or “Mainland China” “Formosa” and “Stein-Leventhal
Organization estimates PCOS has affected over 116 million
Syndrome” or “Sclerocystic Ovarian Degeneration” or
women worldwide as of 2010 (7). The incidence of long-
“Sclerocystic Ovary” and “occurrence” or “outbreaks” or
term complications, including cardio-cerebrovascular
“prevalence” or “endemics” or “incidence”.
diseases, hypertension, lipid metabolism disorders, and
endometrial cancer in patients with PCOS, is 2 to 6 times
ordinary people (2). At present, the etiology of PCOS is Inclusion and exclusion criteria
still unclear. Most scholars believe it may be related to
The inclusion criteria are: (I) type of study: prospective or
the abnormal regulation function of the hypothalamic-
retrospective studies on the prevalence of PCOS in Chinese
pituitary-ovarian axis, hyperinsulinemia and insulin
women published at home and abroad; (II) study population:
resistance, abnormal adrenal endocrine function, heredity,
Chinese women with a definite diagnosis of PCOS; (III)
and other aspects (8,9). For decades, because of the
outcome indicators and the prevalence of PCOS.
differences in diagnostic criteria, sampling methods, and
The criteria for exclusion were: (I) studies with
the gradual maturity of diagnosis and treatment techniques,
incomplete information and data that cannot be extracted;
the prevalence rates were retrieved by domestic and foreign
(II) studies reported or published repeatedly in the same
scholars in the epidemiological investigations on PCOS vary
research population, excluding those of lower quality; (III)
greatly. Previous studies have reported that the prevalence
studies not in Chinese or English; (IV) study where only
rate of PCOS among women of childbearing age in various
the abstract is visible, and the full text cannot be obtained
countries is between 5% and 10% (10). In recent years,
by contacting the author; (V) studies with low quality (the
large-scale investigations of PCOS have been carried out
AHRQ score is below 3).
in different regions of China (11-13). However, due to the
lack of a comprehensive data collection and analysis system,
there is still no data on the exact frequency, distribution Data extraction
pattern and trend of PCOS nationwide. This study used
Two investigators (Q Wu, Z Yang) independently screened
the research method of meta-analysis to review the latest
the literature, extracted data, and cross-checked. If the two
evidence systematically from the regional population survey
researchers have inconsistent conclusions, then through
of PCOS to understand the prevalence of PCOS in different
discussion to resolve differences. If the differences cannot
regions and different populations fully, thus contributing
be resolved, the third party will perform judgments and
to its control and management. We present the following
arbitration. First, read the title and abstract, and after
article in accordance with the PRISMA reporting checklist
excluding irrelevant studies, read the full text further to
(available at http://dx.doi.org/10.21037/apm-20-1893).
determine whether it will be included. The content of the
data extraction includes the first author, publication year,
Methods study design, research area, age, number of PCOS cases and
sample size, occupation, education background, diagnostic
Search strategy
criteria.
This study will be conducted according to PRISMA
guidelines. Eight databases including China National
Statistical analysis
Knowledge Infrastructure, Wanfang Data, China Science
and Technology Journal Database, Chinese Biology STATA (version 15.1; Stata Corporation) software
Medicine, PubMed, Embase, The Cochrane Library and was used to conduct statistical analysis and the point
© Annals of Palliative Medicine. All rights reserved. Ann Palliat Med 2021;10(1):74-87 | http://dx.doi.org/10.21037/apm-20-189376 Wu et al. The prevalence of PCOS in Chinese women: a meta-analysis
Records identified through Addtional records identified
database searching (n=5,576) through other sources (n=0)
Record after duplicates remove (n=3,816)
Records screened (n=1,167)
Records excluded (n=954)
Full- text articles assessed for eligibility
(n=213)
Full-text excluded (n=144)
Studies included in qualitative (n=69)
Studies included in quantitative
synthesis (meta-analysis) (n=69)
Figure 1 The flow diagram of this meta-analysis.
prevalence rates were first transformed into arcsine square- is judged as “1”, “no” or “no.” “Clear” is “0” points. The
root transformed proportions (14). The heterogeneity score ranges from 0 to 11 points, 0 to 3 are low quality, 4 to
between the included studies was determined by the Q 7 are medium quality, and 8 to 11 are of high quality. The
test (P value) and I2. If I20.1 of the Q test, literature quality evaluation was conducted independently
it is considered the homogeneity between the studies is by two researchers (Qiao Wu and Qin Liao), and the
satisfactory, the fixed-effect model is used for meta-analysis. results were cross-checked. If the conclusions of the two
On the contrary (P≤0.1 or I2≥50%), it is considered there researchers were inconsistent, a consensus was reached
is evident heterogeneity among studies, and the random through discussion.
effects model is used for combined calculation. A subgroup
analysis was performed to explore the possible sources of
heterogeneity among studies. Also, the subgroup analysis Results
was conducted according to different regions, occupation/ Study selection and participants characteristics
identity, age, publication time, diagnostic criteria, survey
time, and survey population. Begg’s test and Egger’s test The literature screening process and results are shown
were used for conducting a publication bias assessment. It is in Figure 1. A total of 5,576 papers were obtained from
considered statistically significant when PAnnals of Palliative Medicine, Vol 10, No 1 January 2021 77
on PCOS prevalence in Chinese women (65 in Chinese Funnel chart and Begg’s method and Egger funnel figure
and 4 in English). A total of 154,599 patients were enrolled, asymmetric inspections method analysis were performed.
including 12,845 patients with PCOS. The literature The results show Begg’s rank correlation test income =0.81,
includes 23 provinces (cities, autonomous regions, and P=0.41, and Z suggests no publication bias, and P=0.01
particular administrative regions), including 15 Midwestern Egger regression analysis income. Further, the funnel
Sectional Figure Skating Championships, 33 in the Eastern chart shows apparent asymmetry, suggesting a potential
Region, 16 in the central region, and 4 in the northeast. publication bias, language bias, the small-scale flawed
Among them, three were of low quality, and 57 were of method in the study designed to estimate highly. Therefore,
medium quality, and five were of high quality. The primary the effect of publication bias on the results was tested by the
characteristics of the included studies are shown in Table 1. shear compensation method. The results showed that the
estimated value of the combined effect size did not change
significantly, suggesting that publication bias had little
Pooled prevalence rates of PCOS
impact on the results, and the meta-analysis results were
Sixty-nine articles, including 154,112 subjects and 12,845 relatively stable (Figures 3,4).
patients, were included. The prevalence rate of PCOS
reported in each study ranged from 0.45% to 35.14%.
Discussion
A heterogeneity test was performed on the included 69
articles, and there was significant heterogeneity among the PCOS is the most common endocrine disease in women of
articles (I2=99.6%, P78 Wu et al. The prevalence of PCOS in Chinese women: a meta-analysis
Table 1 The basic characteristics of the included studies
Publication Sample Sample Case Prevalence Quality
No. First author Province Study design Age
year source size (n) (%) score
1 Xu et al. (16) 2012 Guangdong Cross-sectional 20–45 Hospital 215 3 1.39 4
2 Wu et al. (17) 2007 Guangdong Cross-sectional 23–37 Hospital 232 24 10.34 5
3 Mao et al. (18) 1999 Hubei Cross-sectional 20–40 Hospital 258 61 23.64 4
4 Pan et al. (19) 2017 Jiangsu Cross-sectional 18–41 Hospital 301 75 24.91 5
5 Li et al. (20) 2014 Hunan Cross-sectional 10–24 Hospital 371 29 7.82 5
6 Zhuang et al. (21) 2015 Jiangsu Cross-sectional 28.96±3.55 Hospital 487 108 22.18 4
7 Zhan et al. (22) 2008 Guangxi Cross-sectional 26±3.00 Hospital 640 78 12.18 5
8 Yang et al. (23) 2014 Hunan Cross-sectional 20–43 Hospital 672 170 25.30 6
9 Liu et al. (24) 2008 Jilin Cross-sectional 27±3.00 Hospital 1,280 288 22.50 4
10 Jiang et al. (25) 2007 Shandong Cross-sectional 29.96±2.28 Hospital 1,525 230 15.08 4
11 Shi et al. (26) 2007 Hunan Cross-sectional 21–47 Hospital 2,200 726 33.00 5
12 Chen et al. (27) 2016 Hubei Cross-sectional 21–43 Hospital 3,147 355 11.28 4
13 Geng et al. (28) 2013 Henan Cross-sectional 21–43 Hospital 3,200 1,018 31.8 6
14 Liu et al. (29) 2011 Anhui Cross-sectional 18–45 Community 995 55 5.76 8
15 Fu et al. (30) 2018 Hubei Cross-sectional 17–24 Hospital 2,296 136 5.92 6
16 Zhou et al. (31) 2006 Chongqing Cross-sectional 22–38 Hospital 296 104 35.13 5
17 Zhou (32) 2014 Guangxi Cross-sectional 22–40 Hospital 267 39 14.60 3
18 Sun et al. (13) 2016 Hebei Cross-sectional – Hospital 16,343 1,467 8.98 4
19 Huang et al. (33) 2003 Guangdong Cross-sectional 32.2±3.32 Hospital 447 2 0.40 5
20 Huai et al. (34) 2009 Xinjiang Cross-sectional 21–65 Hospital 1,128 396 35.11 6
21 Mo et al. (35) 2008 Guangxi Cross-sectional 23–43 Hospital 126 11 8.73 4
22 He et al. (36) 2009 Shanxi Cross-sectional – Hospital 4,519 881 19.50 4
23 Xu et al. (37) 2005 Shanghai Cross-sectional 22–45 Hospital 398 41 10.30 3
24 Liu et al. (38) 2012 Sichuan Cross-sectional 23–41 Hospital 235 30 12.76 5
25 Su et al. (39) 2008 Yunnan Cross-sectional 21–36 Hospital 210 16 7.62 3
26 Hao et al. (40) 2010 Chongqing Cross-sectional 21–39 Hospital 322 22 6.83 4
27 Wang (41) 2008 Shandong Cross-sectional 23–38 Hospital 80 4 5.00 4
28 Zhou (42) 2012 Zhejiang Cross-sectional 22–45 Hospital 224 30 13.39 5
29 Huang et al. (43) 2013 Guangdong Cross-sectional 22–35 Hospital 52 8 15.38 5
30 Zhao et al. (44) 2005 Zhejiang Cross-sectional 24–36 Hospital 68 2 2.94 4
31 Zhao et al. (45) 2013 Guangdong Cross-sectional 30±7.00 Community 2,988 568 19.01 6
32 Zhao (46) 2012 Jiangsu Cross-sectional 18–42 Hospital 38 5 13.16 5
33 Song et al. (47) 2005 Hunan Cross-sectional 31.14±3.86 Hospital 377 19 5.04 3
34 Qu et al. (48) 2017 Guangdong Cross-sectional 24.27±3.13 Community 7,294 310 4.25 4
35 Li (49) 2008 Jiangsu Cross-sectional 18–38 Hospital 1,080 80 7.41 4
Table 1 (continued)
© Annals of Palliative Medicine. All rights reserved. Ann Palliat Med 2021;10(1):74-87 | http://dx.doi.org/10.21037/apm-20-1893Annals of Palliative Medicine, Vol 10, No 1 January 2021 79
Table 1 (continued)
Publication Sample Sample Case Prevalence Quality
No. First author Province Study design Age
year source size (n) (%) score
36 Wang (50) 2009 Liaoning Cross-sectional 19–45 Community 1,600 132 8.25 8
37 Song (51) 2015 Hunan Cross-sectional 19–45 Hospital 113 39 34.51 7
38 Ai et al. (52) 2013 Jiangsu Cross-sectional 16–22 School 1,006 12 1.192 6
39 Zhang et al. (53) 2005 Zhejiang Cross-sectional 18–22 School 341 50 14.662 4
40 Zhao et al. (54) 2012 Qinghai Cross-sectional 22–38 Hospital 980 135 13.77 6
41 Guo et al. (55) 2018 Hebei Cross-sectional 26–30 Hospital 2,000 180 9.00 3
42 Wang et al. (56) 2012 Hunan Cross-sectional 21–39 Hospital 1,368 123 8.99 7
43 Li (57) 2013 Guangxi Cross-sectional 22–38 Hospital 206 45 21.84 6
44 Jiang et al. (58) 2007 Shandong Cross-sectional – Hospital 910 165 18.13 4
45 Zhao et al. (59) 2008 Guangxi Cross-sectional 19–43 Hospital 439 86 21.86 3
46 Teng et al. (60) 2012 Shanghai Cross-sectional 18–45 Hospital 514 51 9.92 6
47 Li et al. (61) 2012 Guangdong Cross-sectional 19–44 Community 1,000 63 6.30 5
48 Hao et al. (62) 2006 Shandong Cross-sectional 19–48 Community 1,125 81 7.20 7
49 Li et al. (63) 2017 Guangdong Cross-sectional 18–42 Community 792 42 5.30 7
50 Wang et al. (64) 2015 Guangdong Cross-sectional 20–45 Community 669 53 7.92 6
51 Ma et al. (65) 2007 Liaoning Cross-sectional – Hospital 5,313 75 1.41 7
52 Wang (66) 2019 Jiangsu Cross-sectional 20–49 Community 9,320 533 5.71 8
53 Jiang (67) 2006 Jiangsu Cross-sectional 12–20 School 2,154 28 12.99 6
54 Chen (68) 2009 Tianjin Cross-sectional 20–45 Community 1,337 94 7.03 7
55 Lin et al. (69) 2011 Guangdong Cross-sectional 20–45 Community 791 46 5.81 7
56 Lin et al. (12) 2014 Xinjiang Cross-sectional 18–45 Community 21,892 1,116 5.09 6
57 Lin et al. (70) 2010 Xinjiang Cross-sectional 18–45 Community 2,867 217 7.57 7
58 Guo et al. (71) 2016 Shandong Cross-sectional – Community 1,500 98 6.53 8
59 Wang et al. (72) 2016 Ningxia Cross-sectional 12–18 Community 1,843 68 3.41 5
60 Feng et al. (73) 2016 Henan Cross-sectional 17–23 School 2,182 327 14.98 4
61 Zhang et al. (74) 2013 Shanghai Cross-sectional 18–45 Hospital 625 54 8.64 6
62 Song et al. (75) 2019 Hainan Cross-sectional 19–24 School 10,000 53 0.53 4
63 Wang (76) 2012 Hunan Cross-sectional 19–45 Community 1,488 130 8.74 6
64 Zhang (77) 2009 Hunan Cross-sectional 14–20 Community 4,831 88 1.82 7
65 Wang et al. (78) 2016 Guangdong Cross-sectional 25–40 Community 511 5 0.10 4
66 Jiao et al. (79) 2014 Liaoning Cross-sectional 19–45 Community 1,600 132 8.25 6
67 Zhuang et al. (80) 2014 Sichuan Cross-sectional 12–44 Community 1,645 184 11.19 7
68 Xiao et al. (81) 2008 Guangdong Cross-sectional 20–45 Hospital 915 22 2.40 6
69 Rong et al. (11) 2013 Heilongjiang et al. Cross-sectional 19–45 Community 15,924 894 5.61 8
“–” not reported.
© Annals of Palliative Medicine. All rights reserved. Ann Palliat Med 2021;10(1):74-87 | http://dx.doi.org/10.21037/apm-20-189380 Wu et al. The prevalence of PCOS in Chinese women: a meta-analysis Figure 2 Forest plots of the total prevalence of polycystic ovary syndrome in Chinese women. © Annals of Palliative Medicine. All rights reserved. Ann Palliat Med 2021;10(1):74-87 | http://dx.doi.org/10.21037/apm-20-1893
Annals of Palliative Medicine, Vol 10, No 1 January 2021                                                                                         81

 Table 2 Subgroup analysis of the prevalence of polycystic ovary syndrome in Chinese women

                                     No. of         Heterogeneity test results                                      Publication bias (P valve)
 Category                                                                            Prevalence (95% CI), %
                                    studies             2
                                                        I (%)       P valve                                          Begg            Egger
 Area
   Western                             15               98.4          0.00             13.35 (9.19–18.10)             0.89            0.53
   Eastern                             33               99.1          0.00              7.82 (5.84–10.05)             0.71            0.39
   Central                             16               99.5          0.00             14.24 (8.87–20.63)             0.23            0.77
   Northeast                            4               100.0         0.00              8.68 (1.92–19.67)             1.36            0.06
 Occupation/identity
   Worker                               5               98.8          0.05             10.37 (6.71–14.77)             1.22            0.06
   Student                              6               99.0          0.00             16.37 (2.55–38.75)             0.24            0.56
   Medical staff                        4               74.3          0.00             13.97 (8.79–20.11)             1.70            0.01
   Cadre                                5               98.7          0.01              6.05 (4.93–7.29)              0.73            0.59
   Farmer                               4               71.4          0.00              7.05 (3.75–9.51)              1.02            0.36
   Clerk                                3               53.0          0.00              8.05 (7.50–13.28)             0.00            0.65
   Service                              2                7.5          0.00              9.05 (6.41–14.38)             0.00              –
 Age
   10–20                                7               98.4          0.00             10.26 (5.24–16.74)             0.60            0.08
   21–30                                9               98.2          0.00             17.23 (8.43–28.35)             0.94            0.07
   31–40                                8               93.5          0.00              9.13 (4.65–14.87)             0.87            0.00
   >40                                  3               76.6          0.03              2.22 (0.82–4.26)              1.04            0.19
 Publication time
   1995–2000                            2                0.0          0.00             21.04 (17.91–24.39)            0.00              –
   2001–2005                            5               96.1          0.01              5.86 (1.51–12.84)             1.04            0.14
   2006–2010                           23               99.8          0.00             10.78 (6.79–15.56)             0.79            0.06
   2011–2015                           27               98.7          0.00             11.44 (8.71–14.4)              0.96            0.05
   2016–2020                           12               99.6          0.00              5.79 (3.46–8.65)              0.75            0.80
 Diagnostic criteria
   ESHRE/ASMR-2003                     32               99.7          0.00              8.01 (6.14–10.14)             0.78            0.30
   NIH-1990                             2               87.3          0.00              5.67 (3.13–8.96)              0.00              –
   AES-2006                             3               95.6          0.00              5.06 (2.09–9.25)              1.04            0.34
 Source of population
   Hospital                            43               99.2          0.00             13.41 (10.62–16.48)            0.21            0.14
   Community                           22               99.7          0.00              5.95 (5.04–6.91)              0.42            0.36
   School                               4               99.5          0.00              3.01 (0.06–10.14)             0.34            0.48
 NIH-1990 (Diagnostic criteria developed by the United States Health Organization/United States Organization for Child Health and
 Human Development (NIH/NICHD) in 1990): (I) oligoovulation, (II) signs of androgen excess (clinical or biochemical), (III) exclusion of
 other disorders that can cause menstrual irregularity and hyperandrogenism. ESHRE/ASMR-2003 [Diagnostic criteria developed by
 the European Society of Human Reproduction and Embryology (ESHRE) and the American Society for Reproductive Medicine (ASRM)
 in 2003]: (I) oligoovulation and/or anovulation, (II) excess androgen activity, (III) polycystic ovaries (by gynecologic ultrasound) AES-
 2006 (Diagnostic criteria developed by the American Androgen Excess Society in 2006): (I) excess androgen activity, (II) oligoovulation/
 anovulation and/or polycystic ovaries, (III) exclusion of other entities that would cause excess androgen activity.

© Annals of Palliative Medicine. All rights reserved.                   Ann Palliat Med 2021;10(1):74-87 | http://dx.doi.org/10.21037/apm-20-1893
82 Wu et al. The prevalence of PCOS in Chinese women: a meta-analysis
Begg’s funnel plot with pseudo 95% confidence limits Women in the central and western regions are more
1.5 likely to be in backward agricultural areas than women
in the eastern regions and are more likely to be exposed
to environmental toxins, including pesticides and smog.
1
Studies have shown that environmental toxins have a
tpda
significant impact on human health. Pollutants, including
.5
smoke, lead, pesticides, and mercury, may damage women’s
reproductive health and may trigger or aggravate PCOS
and its related symptoms (90).
0 In terms of the difference in the prevalence of PCOS
0 .05 .1 .15 between different occupations/identities: PCOS has the
s.e. of: tpda
highest prevalence among students. The reasons may
Figure 3 The funnel plot diagram of Beggar rank correlation be because of: (I) students have prolonged mental work
analysis hours and high intensity, and their bodies are under long-
term stress. Catecholamine increased secretion causes the
body’s endocrine function disorder, sympathetic nerve
Filled funnel plot with pseudo 95% confidence limits
1.5
excitability, and hypothalamus-pituitary-adrenal cortex
hormone secretion increases, thereby reducing immune
function. These factors may accelerate the occurrence of
1 PCOS (91). (II) Students often have lousy living habits,
theta, filled
including reversed work and rest and irregular eating and
less exercise and exercise, and these are all predisposing
.5 factors for PCOS (92). As a group of people with higher
socioeconomic status, cadres have better medical and
health conditions and pay more attention to their health
0 conditions, have a relatively healthier lifestyle, and reduce
0 .05 .1 .15
s.e. of: theta, filled the chance of PCOS.
The results of a subgroup analysis with age in this study
Figure 4 The funnel diagram of the shear compensation method.
showed that the prevalence rate was 10.26% for 10 to
20 years old, 17.23% for women aged 21 to 30, and 9.13%
prevalence rate of female PCOS, the prevalence rate of for women aged 31 to 40, >40 years old. The prevalence
of PCOS in women was 2.22%. This result shows that the
female PCOS in eastern regions is significantly lower
prevalence of PCOS decreased significantly with age from
than that in central and western regions, which might be
21 to 30 years old, suggesting that age may be related to
because of the following reasons: (I) compared with the
PCOS. The reason might be because of the prosperous
eastern region, the economic status of the central and
childbearing period for women of childbearing age between
western regions is slightly lagging. The socioeconomic
20 and 29 years old, female reproductive endocrine function
status of women is low. Relevant studies have shown that
reaches its peak state, the ovarian endocrine function is
low socioeconomic status is related to increased exposure
vigorous, and women’s ovarian endocrine function enters
to environmental BPA (86), and this synthetic compound a state of gradual decline around 40 years old (93). The
may be related to PCOS (87). Relevant animal studies prevalence of PCOS, which is closely related to endocrine
have shown (88) that there is an association between the function, also decreases with the gradual weakening of
development of PCOS symptoms and exposure to BPA ovarian endocrine function.
during the newborn period. Simultaneously, women in the In terms of publication time, from 2001 to 2015, the
central and western regions are insufficient preventive and prevalence of female PCOS has shown an upward trend.
health care conditions because of the lagging economic The reason may be that with the development of economy
status (89), which delays the treatment of PCOS. (II) It and medical and health conditions, increased patients
is related to the living environment between regions. with PCOS-related symptoms tend to go to the hospital
© Annals of Palliative Medicine. All rights reserved. Ann Palliat Med 2021;10(1):74-87 | http://dx.doi.org/10.21037/apm-20-1893Annals of Palliative Medicine, Vol 10, No 1 January 2021 83
for treatment. Also, with the improvement of diagnosis Conclusions
and treatment methods, and the gradual improvement of
To sum up, PCOS has a high prevalence rate in Chinese
PCOS diagnostic criteria, the diagnosis rate of PCOS has
women, a significant public health problem in China.
increased. The prevalence of PCOS has declined since
Therefore, medical and health departments should pay
2016. The decline might be related to the changes in the
more attention to this situation. According to the research
age structure of the population in the country. The number
results, the disease has a high prevalence rate in the central
of women of childbearing age in this study’s country has
region, students, and women aged 21 to 30. Therefore,
shown a decreasing trend year by year. According to the
more targeted screening measures should be adopted for
2018 Government Work Report, there were 4 million fewer
people with the characteristics of this population, and
women of childbearing age-aged 15 to 49 in 2017 than in
tertiary prevention of PCOS should be actively carried out,
2016, with nearly 6 million fewer women of childbearing
to make an early diagnosis and early treatment, and reduce
age-aged 20 to 29 during their fertile years.
Comparing the prevalence of women using the diagnostic relevant medical and health resources.
criteria of the National Institutes of Health in 1990, the
Rotterdam criteria in 2003 and the PCOS diagnostic criteria Acknowledgments
developed by the American Androgen Association in 2006,
the prevalence of PCOS diagnosed using the Rotterdam Funding: None.
criteria in 2003 is significant It is higher than the other two is
like the results of researchers including Anahita Jalilian (10). Footnote
However, some studies believe the Rotterdam criteria
may include some women with mild phenotypes into the Reporting Checklist: The authors have completed the
diagnosis, increasing the incidence of PCOS (94). In terms of PRISMA reporting checklist. Available at http://dx.doi.
the prevalence of PCOS in different survey sites, the survey org/10.21037/apm-20-1893
conducted in the hospital has a higher prevalence rate, while
the survey conducted in the school has a lower prevalence Conflicts of Interest: All authors have completed the ICMJE
rate. The reason might be because of the differences in the uniform disclosure form (available at http://dx.doi.
subjects of the survey. Most surveys conducted in the hospital org/10.21037/apm-20-1893). The authors have no conflicts
were women who had symptoms related to PCOS and went of interest to declare.
to the hospital for treatment. The cases were concentrated.
The low prevalence of the survey conducted in schools Ethical Statement: The authors are accountable for all
may be related to insufficient self-health care, awareness aspects of the work in ensuring that questions related
of students, insufficient relevant knowledge of PCOS, and to the accuracy or integrity of any part of the work are
insufficient school medical and health conditions. When appropriately investigated and resolved.
students have PCOS-related symptoms, including irregular
menstruation and acne, they are often overlooked and miss Open Access Statement: This is an Open Access article
the diagnosis and treatment of the disease. distributed in accordance with the Creative Commons
This study also has certain limitations. Firstly, it is Attribution-NonCommercial-NoDerivs 4.0 International
limited by the characteristics of single rate meta-analysis, License (CC BY-NC-ND 4.0), which permits the non-
and the heterogeneity between the literature is considerable. commercial replication and distribution of the article with
Secondly, significant heterogeneity exists among different the strict proviso that no changes or edits are made and the
studies. Although inclusion and exclusion criteria are original work is properly cited (including links to both the
strictly limited and subgroup analysis is conducted, the formal publication through the relevant DOI and the license).
results cannot fully explain the source of heterogeneity, and See: https://creativecommons.org/licenses/by-nc-nd/4.0/.
unknown sources of heterogeneity may cause certain bias.
Finally, only 69 studies covering 23 provinces in China
References
were included in this study. The results were not enough
to reflect the prevalence and characteristics of PCOS in all 1. Nandi A, Chen Z, Patel R, et al. Polycystic ovary
Chinese women. syndrome. Endocrinol Metab Clin North Am
© Annals of Palliative Medicine. All rights reserved. Ann Palliat Med 2021;10(1):74-87 | http://dx.doi.org/10.21037/apm-20-189384 Wu et al. The prevalence of PCOS in Chinese women: a meta-analysis
2014;43:123-47. 16. Xu L, Li L, Zheng X, et al. Clinical Analysis of
2. Kauffman RP, Baker TE, Baker VM, et al. Endocrine Laparoscopy Diagnosis and Treatment in 215 Cases of
and metabolic differences among phenotypic expressions Pelvic Diseases for Female Infertility. Journal Of Modern
of polycystic ovary syndrome according to the 2003 Clinical Medicine 2012;38:105-7.
Rotterdam consensus criteria. Am J Obstet Gynecol 17. Wu F, Huang D. Analysis of 232 cases of female infertility
2008;198:670.e1-7; discussion 670.e7-10. treated by laparoscopy. Journal of Guangdong Medical
3. Teede H, Deeks A, Moran L. Polycystic ovary syndrome: College 2007;25:310-1.
a complex condition with psychological, reproductive and 18. Mao H. Analysis of 258 cases of infertility diagnosed
metabolic manifestations that impacts on health across the by laparoscopy. Acta Academiae Medicinae Hubei
lifespan. BMC Med 2010;8:41. 1999;20:3-5.
4. Ho CW, Chen HH, Hsieh MC, et al. Hashimoto’s 19. Pan T, Cao S. Analysis of infertility factors in 301
thyroiditis might increase polycystic ovary syndrome and couples. Journal of Practical Gynecologic Endocrinology
associated comorbidities risks in Asia. Ann Transl Med 2017;4:105-6.
2020;8:684. 20. Li H, Zhou Y, Wu Y. Analysis of 371 cases of
5. Azziz R, Woods KS, Reyna R, et al. The prevalence and adolescent gynecological diseases. Medical information
features of the polycystic ovary syndrome in an unselected 2014;27:138-9.
population. J Clin Endocrinol Metab 2004;89:2745-9. 21. Zhuang Y, Xia F, Zhou W, et al. Analysis of Thyroid
6. Giviziez CR, Sanchez EG, Approbato MS, et al. Obesity Function of 487 Infertile Women. Chinese Journal of
and anovulatory infertility: A review. JBRA Assist Reprod Hemorheology 2015;25:74-7.
2016;20:240-5. 22. Zhan Y. The Etiological Factor Analysis of 640 Cases
7. Vos T, Flaxman AD, Naghavi M, et al. Years lived with Barrenness. Heilongjiang Medicine 2008;32:292-3.
disability (YLDs) for 1160 sequelae of 289 diseases and 23. Yang C, Zuo Q. Etiology analysis of endocrine sterility
injuries 1990-2010: a systematic analysis for the Global in 672 female patients. Contemporary Medicine
Burden of Disease Study 2010. Lancet 2012;380:2163-96. 2014;20:28-30.
8. De Leo V, Musacchio MC, Cappelli V, et al. Genetic, 24. Liu L, Li Y, Tai S. The Etiological Factor Analysis of
hormonal and metabolic aspects of PCOS: an update. 1280 Cases with Female Infertility. China Modern Doctor
Reprod Biol Endocrinol 2016;14:38. 2008;46:71-2.
9. Puurunen J, Piltonen T, Morin-Papunen L, et al. 25. Jiang A, Reng C, Li Y. Etiology analysis of 1525 cases of
Unfavorable hormonal, metabolic, and inflammatory infertility. Journal of Practical Obstetrics and Gynecology
alterations persist after menopause in women with PCOS. 2007;23:705-6.
J Clin Endocrinol Metab 2011;96:1827-34. 26. Shi X, Fang X. Etiology analysis of 2200 infertility
10. Jalilian A, Kiani F, Sayehmiri F, et al. Prevalence of patients. Medical Clinical Research 2007;24:1316-7.
polycystic ovary syndrome and its associated complications 27. Chen M, Xu W. Etiology analysis of infertility in 3147
in Iranian women: A meta-analysis. Iran J Reprod Med patients with ART assisted pregnancy treatment. Journal
2015;13:591-604. of Reproductive Medicine 2016;25:360-3.
11. Li R, Zhang Q, Yang D, et al. Prevalence of polycystic 28. Geng L, Guo Y, Yang Y. Analysis of clinical etiology of
ovary syndrome in women in China: a large community- 3200 cases of infertility. Journal of Henan Medical College
based study. Hum Reprod 2013;28:2562-9. for Staff and Workers 2013;25:141-3.
12. Lin L, Yang J, Ding Y. Prevalence of polycystic ovary 29. Liu Y, Wei Z, Xu Y, et al. Characteristics of polycystic
syndrome of Uygur and Han population in Xinjiang of ovary syndrome in women of reproductive age in
China. Journal of Hainan Medical College 2014;20:680-3. Anhui province. Journal of Reproductive Medicine
13. Sun Q, Sui L, Xu Y. Adverse pregnancy outcome analysis 2011;20:178-82.
of 507 cases with polycystic ovary syndrome. Chinese 30. Fu H, Zhu H, Kang M. Study on Different Criteria for
Journal of Primary Medicine 2016;23:298-300. Diagnosis Polycystic Ovary Syndrome Among Female
14. DerSimonian R, Laird NJ. Meta-analysis in clinical trials College Students. Labeled Immunoassays and Clinical
Control Clin Trials 1986;7:177-88. Medicine 2018;25:894-7.
15. Rostom A, Dubé C, Cranney A, et al. Celiac disease. Evid 31. Zhou G. Analysis of 296 cases of sterility with TV
Rep Technol Assess (Summ) 2004;(104):1-6. laparoscopic surgery. Chinese Journal Of Misdiagnostics
© Annals of Palliative Medicine. All rights reserved. Ann Palliat Med 2021;10(1):74-87 | http://dx.doi.org/10.21037/apm-20-1893Annals of Palliative Medicine, Vol 10, No 1 January 2021 85
2006;6:548. Industry 2012;000:144.
32. Zhou X. The results of laparoscopy in 267 infertility 47. Song M, Zhou C, Ma W. An Analysis of 377 Infertile
patients were analyzed. Contemporary Medicine Forum Patients Examined by Combined Laparoscopy
2014:178-9. and Hysteroscopy. Practical Preventive Medicine
33. Huang Z, Liao S, Xu K, et al. Clinical Application of 2005;12:401-2.
Laparoscopic Surgery in Gynecology. Medical Journal 48. Qu S, Xu J, Huang X, et al. An epidemiological survey
Wuhan University 2003;24:291-2. of infertility among couples of childbearing age at first
34. Huai S. Investigation and analysis of changes of endocrine marriage in Yangjiang district, Guangdong Province.
diseases in gynecological outpatient department. Xinjiang: Guangdong Medical Journal 2017;38:1586-8.
Xinjiang Medical University; 2009. 49. Li N. Diagnosis and treatment of 1080 cases of secondary
35. Mo X. The value of laparoscopy in the diagnosis and amenorrhea. Journal of Qiqihar Medical College
treatment of female infertility. Acta Medicinae Sinica 2008;29:820-1.
2008;21:279-81. 50. Wang Z. An epidemiological survey of polycystic ovary
36. He M, Gao B, Zhao W, et al. Clinical analysis of syndrome in Han women of childbearing age in Liaoning
laparoscopy in 4519 cases with female infertility. Province. Shenyang: China Medical University; 2009.
Chinese Journal of Practical Gynecology and Obstetrics 51. Song Y. Investigation and analysis of changes of endocrine
2009;25:691-3. diseases in outpatient department. Mother and Child
37. Xu M, Hu N, Cui Y, et al. Analysis of 398 female patients World 2015;000:145.
with infertility under laparoscopy. Chinese Journal of 52. Ai M, Lu Y, Wang A. A survey of menstrual and adolescent
Endoscopy 2005;11:155-7. polycystic ovary syndrome among female students in
38. Liu Y, Fu J, Tang B. Clinical Study of Laparoscopic a college. Maternal & Child Health Care of China
Diagnosis and Treatment in 235 Cases with Female 2013;28:3327-30.
Infertility. Journal of Modern Clinical Medicine 53. Zhang Q, Yu Q, Shen C, et al. Analysis report and
2012;38:202-4. countermeasure of 341 cases of female college students
39. Su L, Wang M, Ma Y, et al. Clinical analysis of laparoscopy with B-ultrasonography in abdomen. Chinese Journal of
in diagnosis and treatment of infertility. Chinese Journal of Modern Obstetrics and Gynecology 2005;2:478-9.
Birth Health And Heredity 2008;16:103. 54. Zhao Y. Analysis of 980 cases of related factors and
40. Hao L, Lin Y, Sun W, et al. Retrospective analysis of causes for female infertility. Modern Preventive Medicine
laparoscopic diagnosis and treatment in female infertility. 2012;39:3528-9.
Chinese Journal of Family Planning 2010;18:620-2. 55. Guo M, Jiang C, Zhang H. Study on the prevalence
41. Wang H. Analysis of 80 cases of female infertility treated and clinical characteristics of polycystic ovary syndrome
by laparoscopy. Shandong Medical Journal 2008;48:73-4. in infertile women. Journal of Practical Gynecologic
42. Zhou L. Analysis of 238 cases of female infertility treated Endocrinology 2018;5:26.
by laparoscopy. Chinese Journal of Rural Medicine and 56. Wang W, Liao S, Sun W. Study on the prevalence and
Pharmacy 2012;19:19-20. clinical characteristics of polycystic ovary syndrome
43. Huang Y, Dai Z. Application value of laparoscopy in in infertile women. Compilation of papers of the 11th
diagnosis and treatment of female infertility. International National Conference on Endocrinology of The Chinese
Medicine and Health Guidance News 2013;19:2536-7. Medical Association; 2012.
44. Zhao S, Ding H. Clinical analysis of 68 cases of pelvic 57. Li B. Etiology screening and analysis of female infertility.
infertility treated by laparoscopy. Modern Journal of Guide of China Medicine 2013;11:597-8.
Integrated Traditional Chinese and Western Medicine 58. Jiang A, Reng C, Liu F, et al. Analysis of Etiological Factor
2005;14:289-90. of Female Primary Infertile. Acta Academiae Medicinae
45. Zhao X, Ni R, Huang J, et al. Study on the facial and body Weifang 2007;29:59-60.
terminal hair growth in women in Guangdong by using 59. Zhao R, Wu Y, Mo W, et al. Analysis of etiological factor
modified Ferriman-Gallwey scoring system. Zhonghua Fu for 439 cases of female primary infertility. China Practical
Chan Ke Za Zhi 2013;48:427-31. Medical 2008;3:52-3.
46. Zhao M. The value of combined application of uterine and 60. Teng X, Zhang P, Liu W, et al. An epidemiological
laparoscopy in the treatment of infertility. China Health study on polycystic ovary syndrome among nurses of
© Annals of Palliative Medicine. All rights reserved. Ann Palliat Med 2021;10(1):74-87 | http://dx.doi.org/10.21037/apm-20-189386 Wu et al. The prevalence of PCOS in Chinese women: a meta-analysis
childbearing age in Yan Chai Hospital. Proceedings of the 73. Feng G, Wang J, Zhai H. A Survey on Factors Affecting
16th National Academic Conference of Chinese Diabetes Future Fertility of Female College Students. Health
Association; 2012. Medicine Research and Practice 2016;13:32-4.
61. Li X, Liang X, He Y. Investigation on prevalence and 74. Zhang P, Teng X, Wang H, et al. The prevalence of
clinical characteristics of women at childbearing age with polyocystic ovary syndrome in nurses of reproductive
polycystic ovary syndrome in Ronggui area. Maternal & age. Chinese Journal of Endocrinology and Metabolism
Child Health Care of China 2012;27:3776-8. 2013;29:206-10.
62. Hao C. Correlation study on PCOS incidence and clinical 75. Song F, Chen Y, Li S, et al. A clinical study on the
characteristics of Han women of childbearing age in screening of polycystic ovary syndrome (PCOS)
Shandong province. Shandong: Shandong University; among college students in Hainan province by BMI
2006. and circumference method. World Latest Medicine
63. Li W, Hu H, Ma Z, et al. An epidemiological study on Information 2019;54:72-3.
polycystic ovary syndrome in women of childbearing age 76. Wang L. Investigation and preliminary analysis of the
in Shaoguan area. Heilongjiang Medicine 2016:646-8. related factors of polycystic ovary syndrome in women
64. Wang L, Wei W, Wang G, et al. Prevalence of polycystic of childbearing age in Changsha city. Changsha: Central
ovary syndrome and clinical characters of high estradiol South University, 2012.
level in general Han ethnic women in Shenzhen city. 77. Zhang Y. A survey on the prevalence rate and related
Qingdao Medical Journal 2015;47:417-9. factors of PCOS in 5000 adolescent females in Changsha.
65. Ma L, Xiao Y, Meng P, et al. The analysis of disease Changsha: Hunan University of Chinese Medicine, 2009.
pattern of gynecological outpatients at a hospital in 78. Wang Y, Zhao J, Yang W, et al. Epidemiological
Shenyang city. Chinese Journal of Health Management investigation and analysis on the sterility in flight
2007;1:39-41. attendants. Journal Of Civil Aviation Medicine
66. Wang B. Epidemiological investigation and TCM 2016;26:247-9.
syndrome analysis of Infertility in Suzhou area. Nanjing: 79. Jiao J, Fang Y, Wang T, et al. Epidemiologic investigation
Nanjing University of Traditional Chinese Medicine; of polycystic ovarian syndrome (PCOS) in Han ethnic
2019. women of reproductive age in Liaoning Province, China.
67. Jiang X. Investigation on the incidence of polycystic ovary Clin Exp Obstet Gynecol 2014;41:304-9.
syndrome among female middle school students in Suzhou 80. Zhuang J, Liu Y, Xu L, et al. Prevalence of the polycystic
city and analysis of related factors. Suzhou: The First ovary syndrome in female residents of Chengdu, China.
Affiliated Hospital of Suzhou University; 2006. Gynecologic and obstetric investigation 2014;77:217-23.
68. Chen H. An epidemiological study on clinical 81. Chen X, Yang D, Mo Y, et al. Prevalence of polycystic
characteristics and related factors of polycystic ovary ovary syndrome in unselected women from southern
syndrome in women of childbearing age in Tianjin. China. Eur J Obstet Gynecol Reprod Biol 2008;139:59-64.
Tianjin: Tianjin Medical University; 2009. 82. Sirmans SM, Pate KA. Epidemiology, diagnosis, and
69. Lin Y, Ni R, Yang X. Investigation on the incidence of management of polycystic ovary syndrome. Clin Epidemiol
polycystic ovary syndrome in women of childbearing age in 2013;6:1-13.
Xinhe District. Chinese Community Doctors 2011;13:317. 83. Rotterdam ESHRE/ASRM-Sponsored PCOS consensus
70. Lin L, Mi N, Ding Y. Clinical characteristics of Han workshop group. Revised 2003 consensus on diagnostic
and Uygur child-bearing patients with polycystic ovary criteria and long-term health risks related to polycystic
syndrome in Xinjiang. Journla of Chinese Practical ovary syndrome (PCOS). Hum Reprod 2004;19:41-7.
Diagnosis and Therapy 2010;24:1154-7. 84. Patel S. Polycystic ovary syndrome (PCOS), an
71. Guo Y, Gong A, Li R. Clinical analysis of related factors inflammatory, systemic, lifestyle endocrinopathy. J Steroid
of polycystic ovary syndrome in Yi'nan county and its Biochem Mol Biol 2018;182:27-36.
adjacent counties. Journal of Shandong Medical College 85. Ding T, Hardiman PJ, Petersen I, et al. The prevalence of
2016;38:66-9. polycystic ovary syndrome in reproductive-aged women of
72. Wang G, Shi N. Investigation and analysis of adolescent different ethnicity: a systematic review and meta-analysis.
polycystic ovary syndrome in Yinchuan city. China Health Oncotarget 2017;8:96351-8.
Care & Nutrition 2016;26:56-7. 86. Nelson JW, Scammell MK, Hatch EE, et al. Social
© Annals of Palliative Medicine. All rights reserved. Ann Palliat Med 2021;10(1):74-87 | http://dx.doi.org/10.21037/apm-20-1893Annals of Palliative Medicine, Vol 10, No 1 January 2021 87
disparities in exposures to bisphenol A and polyfluoroalkyl impaired glucose tolerance in polycystic ovary syndrome:
chemicals: a cross-sectional study within NHANES 2003- a prospective, controlled study in 254 affected women. J
2006. Environ Health 2012;11:10. Clin Endocrinol Metab 1999;84:165-9.
87. Yang Q, Zhao Y, Qiu X, et al. Association of serum 91. Ma L, Meng P, Duan Y, et al. Study on the related factors
levels of typical organic pollutants with polycystic ovary of polycystic ovary syndrome. Medicine of Shenyang Army
syndrome (PCOS): a case-control study. Hum Reprod 2009;22:64-6.
2015;30:1964-73. 92. Goodarzi MO, Dumesic DA, Chazenbalk G, et al.
88. Fernández M, Bourguignon N, Lux-Lantos V, et al. Polycystic ovary syndrome: etiology, pathogenesis and
Neonatal exposure to bisphenol a and reproductive diagnosis. Nat Rev Endocrinol 2011;7:219-31.
and endocrine alterations resembling the polycystic 93. Lin Y, Li L, Xu R. The Relationship between Changes
ovarian syndrome in adult rats. Environ Health Perspect in Sex Hormone Level and Physiology and Disease of
2010;118:1217-22. Women in Different Age Groups. Henan Journal of
89. Kirby JB, Kaneda T. Neighborhood socioeconomic Preventive Medicine 2010;21:179-81.
disadvantage and access to health care. J Health Soc Behav 94. Bani Mohammad M, Majdi Seghinsara A. Polycystic ovary
2005;46:15-31. syndrome (PCOS), diagnostic criteria, and AMH. Asian
90. Legro RS, Kunselman AR, Dodson WC, et al. Prevalence Pac J Cancer Prev 2017;18:17-21.
and predictors of risk for type 2 diabetes mellitus and
Cite this article as: Wu Q, Gao J, Bai D, Yang Z, Liao Q.
The prevalence of polycystic ovarian syndrome in Chinese
women: a meta-analysis. Ann Palliat Med 2021;10(1):74-87. doi:
10.21037/apm-20-1893
© Annals of Palliative Medicine. All rights reserved. Ann Palliat Med 2021;10(1):74-87 | http://dx.doi.org/10.21037/apm-20-1893You can also read