National and regional trends in the prevalence of polycystic ovary syndrome since 1990 within Europe: the modeled estimates from the Global Burden ...
←
→
Page content transcription
If your browser does not render page correctly, please read the page content below
Clinical research
                                                                                                                                           Obstetrics and Gynecology

National and regional trends in the prevalence
of polycystic ovary syndrome since 1990 within Europe:
the modeled estimates from the Global Burden
of Disease Study 2016

Tomasz Miazgowski1, Ira Martopullo2, Justyna Widecka3, Bartosz Miazgowski4,5, Agnieszka Brodowska6

 Department of Hypertension and Internal Diseases, Pomeranian Medical University,
1
                                                                                                                        Corresponding author:
 Szczecin, Poland                                                                                                       Prof. Tomasz Miazgowski
2
 Institute for Health Metrics and Evaluation, University of Washington, Seattle, WA, USA                                Department of Hypertension
3
 SPS ZOZ Zdroje, Szczecin, Poland                                                                                       and Internal Diseases
4
 Doctoral Study, Pomeranian Medical University, Szczecin, Poland                                                        Pomeranian Medical
5
 Center for Innovation in Medical Education, Pomeranian Medical University, Szczecin,                                   University
 Poland                                                                                                                 1 Unii Lubelskiej St
6
 Department of Gynecology, Endocrinology and Gynecologic Oncology, Pomeranian                                           71-252 Szczecin, Poland
 Medical University, Szczecin, Poland                                                                                   Phone: +48 602398723
                                                                                                                        E-mail: miazgowski@interia.pl
Submitted: 7 October 2018; Accepted: 10 February 2019;
Online publication: 6 August 2019

Arch Med Sci 2021; 17 (2): 343–351
DOI: https://doi.org/10.5114/aoms.2019.87112
Copyright © 2019 Termedia & Banach

Abstract
Introduction: The exact prevalence of polycystic ovary syndrome (PCOS) is dif-
ficult to assess due to the clinical heterogeneity of this condition, the lack
of a universal definition as well as the lack of studies comparing differences
within and between ethnic groups across geographical regions.
Material and methods: Using a modeling approach, we analyzed the data from
Global Burden of Disease Study 2016 and extracted the national and region-
al estimates on PCOS prevalence since 1990 in females aged 15–49 years by
country and three major European regions: Western, Central, and Eastern.
Results: The average prevalence of PCOS in Europe was 276.4 cases per 100,000
(95% uncertainty interval (UI): 207.8–363.2). The estimates varied markedly
across countries and regions, with the highest rates per 100,000 in the Czech
Republic (460.6) and the lowest in Sweden (34.10); other Nordic countries,
Germany, and the UK had relatively low rates as well. The rates in Central
and Eastern Europe were more than three times higher than those in Western
countries. They were comparable among Eastern countries, ranging from 406.4
in Lithuania to 443.1 in Russia. Within Central Europe, PCOS prevalence was
lowest in Turkey and Albania, while in the majority of the remaining countries,
the prevalence ranged between 420 and 440 per 100,000. Between 1990 and
2016, the rates across European regions were relatively stable.
Conclusions: We found highly variable national and regional prevalence of
PCOS among European females. Our estimates encourage the search at the
population level for new environmental and genetic determinants of PCOS.

Key words: gynecological conditions, polycystic ovary syndrome, women’s
health.

Introduction
   Polycystic ovary syndrome (PCOS) is one of the most common endo-
crine disorders in women of reproductive age. Although the exact causes
of PCOS are poorly understood, it is generally believed that the genetic

Creative Commons licenses: This is an Open Access article distributed under the terms of the Creative Commons
Attribution-NonCommercial-ShareAlike 4.0 International (CC BY -NC -SA 4.0). License (http://creativecommons.org/licenses/by-nc-sa/4.0/).
Tomasz Miazgowski, Ira Martopullo, Justyna Widecka, Bartosz Miazgowski, Agnieszka Brodowska
background [1] exacerbated by lifestyle and envi- for the conditions studied. Using the standard
ronmental factors [2, 3] may indicate an individ- GBD results tool [17], from the GBD 2016 estimates
ual’s predisposition to the development of this we obtained the estimates for prevalence rates of
disorder. PCOS predominantly affects overweight/ PCOS for European females aged 15–49 years be-
obese women and is frequently associated with tween 1990 and 2016. This tool provides access
metabolic syndrome and increased risk for infer- to a complete set of age and gender-specific es-
tility, cardiovascular disease, and endometrial can- timates of burden across a wide range of causes.
cer [4]. The exact worldwide PCOS prevalence is We analyzed the prevalence rates by country and
difficult to assess in epidemiological studies due three major European regions: Western (WE), Cen-
to the clinical heterogeneity of this condition, the tral (CE), and Eastern (EE). The WE region includ-
possible influence of age and ethnicity, the lack of ed Andorra, Austria, Belgium, Denmark, Finland,
a universal definition for PCOS, as well as the lack France, Germany, Greece, Iceland, Italy, Ireland,
of studies comparing differences within and be- Luxembourg, Malta, the Netherlands, Norway, Por-
tween ethnic groups across geographical regions. tugal, Spain, Sweden, Switzerland, and the United
Currently, three groups have recommended the Kingdom; CE included Albania, Bosnia and Her-
diagnostic criteria for PCOS [5–7]. Although there zegovina, Bulgaria, Croatia, the Czech Republic,
are certain consistencies among these criteria, Hungary, North Macedonia, Montenegro, Poland,
some important differences exist which make the Romania, Serbia, Slovakia, Slovenia, and Turkey;
comparison of epidemiological studies on PCOS and EE included Belarus, Estonia, Kazakhstan,
difficult [8]. Indeed, various studies have reported Latvia, Lithuania, Moldova, Russia, and Ukraine.
a worldwide prevalence of PCOS that ranges wide- The GBD Study uses the International Classification
ly from 2% to 26% [9] depending on population, of Diseases (ICD-10 and ICD-9) in the extraction of
sample size, body mass index, and the diagnostic hospital and claims data that are mapped to the
criteria. In the majority of European countries, the 2016 GBD causes of death and non-fatal disease se-
rates of PCOS are unknown. In some Western Eu- quelae. PCOS was mapped to codes E28.2 (ICD-10)
ropean countries the rates of PCOS determined in and 256.4 (ICD-9) [18]. Prevalence was expressed
limited samples have ranged from 2.3% to 28% as the number of prevalent cases per 100,000 and
[10–14]. These data suggest possible geo-epidemi- the percent of total prevalent cases along with the
ologic determinants for this condition. 95% uncertainty interval (UI), which captures un-
The aim of the study was to provide the mod- certainty from sampling, non-sampling error from
eled estimates for trends in PCOS prevalence the study designs or diagnostic methods, model
since 1990 in Europe. For this purpose, we ana- parameter uncertainty, and uncertainty regarding
lyzed the data from the Global Burden of Disease, model specification. The UIs were generated by
Injuries and Risk Factors (GBD) Study 2016 [15] taking 1,000 draws from the posterior distribution
and extracted the national and regional estimates of each estimate, with upper and lower bounds
on PCOS prevalence in European females aged determined by the 2.5th and 97.5th values of the
15–49 years. draws as described elsewhere [19]. Rates of PCOS
were analyzed for the following years: 1990, 1995,
Material and methods 2000, 2005, 2010, 2015, and 2016. The frequency
The GBD Study, funded by the Bill & Melinda distribution of PCOS rates was analyzed in the
Gates Foundation, is the largest systematic ap- following 5-year age bands: 15–19, 20–24, 25–29,
proach to describe the global distribution of a wide 30–34, 35–39, 40–44, and 45–49 years.
spectrum of major diseases, injuries, and health We used country-year estimates in our analy-
risk factors. This approach was designed to opti- ses and calculated the Socio-demographic Index
mize the comparability of data collected by varying (SDI) for each geography-year unit. The SDI, de-
methods and sources or based on different case veloped by GBD researchers [17], is a summary
definitions as well as to find a consistent set of measure that identifies where countries or other
estimates between data for prevalence, incidence, geographic areas sit on the spectrum of develop-
and other measures. The GBD Study uses the ment. Expressed on a scale of 0 to 1, the SDI is
health data collected from vital records, registries, a composite average of the rankings of the in-
censuses, health surveys, demographic surveil- comes per capita, average educational attainment
lances, scientific research, administrative reports, in the population older than 15 years, and fertility
and many other sources. They are then fed into al- rates of all areas in the GBD Study. All GBD 2016
gorithms that generate disease burden estimates. locations were assigned to SDI quintiles (Low SDI,
In the GBD Study, data for non-fatal outcomes for Low-middle SDI, Middle SDI, High-middle SDI, and
a disease are analyzed using the Bayesian me- High SDI) based on their calculated SDI value in
ta-regression tool DisMod-MR 2.1 [16], which en- the year 2016 (Table I) [15, 17]. Spearman’s rank
sures consistency of epidemiological parameters correlation was used to test the association be-
344 Arch Med Sci 2, February / 2021National and regional trends in the prevalence of polycystic ovary syndrome since 1990 within Europe:
the modeled estimates from the Global Burden of Disease Study 2016
tween PCOS prevalence and SDI. Differences in Table I. Socio-demographic Index quintile cutoffs
the prevalence rates of PCOS between European SDI quintile Lower bound Upper bound
countries with high, high-middle and middle SDIs
Low 0 0.450402989
were calculated using one-way ANOVA.
The study utilized existing data from the GBD Low-middle 0.450402989 0.637800918
2016 Study and did not require ethical approval. Middle 0.637800918 0.747342101
The GBD 2016 Study complies with the Guidelines High-middle 0.747342101 0.849027407
for Accurate and Transparent Health Estimates High 0.849027407 1.0
Reporting (GATHER) recommendations [20] and SDI – Socio-demographic Index.
additional information on modeling strategy, data
sources, and visualization tools are available at
some individual countries, the rates were highly
www.healthdata.org.
variable (Table III). Taking all European countries
Results into consideration, the largest increases in PCOS
prevalence from 1990 to 2016 were observed in
Polycystic ovary syndrome prevalence in 2016 Turkey (11.4%), the Czech Republic (9.6%), and Bul-
The estimates for 2016 PCOS prevalence in garia (6.9%); in some other countries, in contrast,
42 European countries and three European regions the rates decreased, especially in Sweden (–9.6%),
are shown in Table II. In all Europe, the average the Netherlands (–6.2%), Germany (–5.8%), and
prevalence was 276.4 cases per 100,000 (95% UI: Austria (–5.8%). This is illustrative of regional pat-
207.8–363.2). The prevalence varied markedly terns of PCOS prevalence within Europe.
across both European countries and regions, with In the period 1990–2006, there were large de-
the highest rates in the Czech Republic (460.6 per creases in the rates in Moldova (12.5%; 95% UI:
100,000; 95% UI: 346.2–602.1) and the lowest in from –15.2 to –10.1), Russia (12.3%; 95% UI: from
Sweden (34.1 per 100,000; 95% UI: 24.59–45.77); –13.7 to –11.1), and Poland (9.3%; 95% UI: from
relatively low rates were also seen in other Nor- –12.2 to –6.1). Interestingly, the same countries
dic countries (Finland, Norway, Iceland, and Den- had the largest increases in rates in the next
mark), Germany, and the UK. In general, the rates decade (from 2006–2016), by 15.8%, 14.9% and
in CE and EE were more than three times higher 14.6%, respectively. Similar changes from a de-
than those in WE. They were relatively compara- creasing to an increasing trend between 1990–
ble among EE countries, ranging from 406.4 per 2006 and 2006–2016 were also observed in Alba-
100,000 (0.41%) in Lithuania to 443.1 per 100,000 nia, Belarus, Bosnia and Herzegovina, Estonia and
(0.45%) in Russia. Within CE, PCOS prevalence was Ukraine. On the other hand, throughout the last
lowest in Turkey and Albania (258.5 and 373.9 per decades, the rates of PCOS in the Czech Republic
100,000, respectively), while in the majority of have increased.
the remaining countries, the prevalence ranged
between 420 and 440 per 100,000, except for Frequency distribution of polycystic ovary
the Czech Republic, which had the highest rates syndrome prevalence by age
in all Europe. In WE, beside the Nordic countries,
There were large age-dependent differences in
low rates of PCOS were also seen in Germany, the
the prevalence of PCOS (Figure 3). Overall, across
Netherlands and Andorra (between 115 and 120
all three European regions, the prevalence showed
cases per 100,000), while in Austria the prevalence
a stepwise increase with age with the highest
was nearly two times higher (211.7 per 100,000).
In the majority of WE countries (France, Ireland, rates in women aged 35–39 and 40–44 years.
Luxembourg, Malta, Portugal, and Switzerland), the The prevalence of PCOS was almost the same in EE
rates were established at approximately 120–130 and CE from age 20 years and above. Interesting-
cases per 100,000 (Figure 1). ly, in the youngest age group (15–19 years), quite
a few females developed this condition (97.83 per
Trends in polycystic ovary syndrome 100,000; 95% UI: 60.78–153.6). In this age group, in
prevalence between 1990 and 2016 the period 1990–2016 the number of PCOS preva-
lent cases increased in EE by 0.73% (95% UI: from
Between 1990 and 2016, the prevalence of –0.18 to 1.83) and CE by 1.87% (95% UI: 0.42–3.68),
PCOS across the whole of Europe and in three Eu- while it decreased in WE (by 1.30%; 95% UI: from
ropean regions was relatively stable (Figure 2). In –4.65 to 2.64).
comparison to 1990, in 2016 the mean rates in WE
decreased slightly (by 3.26%; 95% UI: from –5.66 Polycystic ovary syndrome prevalence by SDI
to –0.30), but in the same period they increased in
CE and EE (by 3.34%; 95% UI: 1.72–5.19 and 1.6%; The estimates for 2016 SDI in European coun-
95% UI: 0.5–2.81, respectively). However, among tries are shown in Table IV. Within WE, all countries,
Arch Med Sci 2, February / 2021345Tomasz Miazgowski, Ira Martopullo, Justyna Widecka, Bartosz Miazgowski, Agnieszka Brodowska
Table II. Prevalence of polycystic ovary syndrome in 2016 by European country and region for women aged 15–49 years
Country Prevalent cases Lower Upper Percent of total Lower Upper
per 100,000 bound bound prevalent cases bound bound
Albania 373.94 280.2 498.4 0.38 0.29 0.51
Andorra 119.88 90.26 158.6 0.12 0.09 0.16
Austria 211.74 167.5 266.2 0.22 0.17 0.27
Belarus 430.96 325.2 561.7 0.44 0.33 0.58
Belgium 131.70 95.97 172.5 0.13 0.10 0.18
Bosnia and Herzegovina 420.45 315.8 553.1 0.43 0.32 0.56
Bulgaria 435.76 329.3 571.4 0.44 0.37 0.58
Croatia 415.90 312.2 546.1 0.43 0.32 0.56
Czech Republic 460.60 346.2 602.1 0.47 0.35 0.62
Denmark 117.43 88.24 157.5 0.12 0.09 0.16
Estonia 432.44 326.2 567.4 0.44 0.34 0.56
Finland 121.62 91.37 162.2 0.12 0.09 0.17
France 120.68 90.61 160.1 0.12 0.09 0.16
Germany 114.96 87.70 147.7 0.12 0.84 0.15
Greece 136.07 100.1 177.9 0.14 0.10 0.18
Hungary 428.72 322.5 561.4 0.44 0.30 0.57
Iceland 120.65 90.51 161.6 0.12 0.09 0.16
Ireland 127.61 96.13 168.0 0.13 0.10 0.17
Italy 138.11 106.8 178.9 0.14 0.11 0.18
Kazakhstan 417.23 311.2 546.9 0.42 0.31 0.53
Latvia 427.92 321.8 563.2 0.41 0.31 0.54
Lithuania 406.38 304.8 535.4 0.41 0.31 0.54
Luxembourg 123.65 92.91 163.8 0.12 0.09 0.17
North Macedonia 411.45 309.4 543.2 0.42 0.32 0.56
Malta 123.51 92.99 164.1 0.13 0.09 0.17
Moldova 435.78 325.8 578.6 0.44 0.33 0.59
Montenegro 410.91 309.2 542.4 0.42 0.32 0.56
Netherlands 117.50 88.29 156.3 0.12 0.09 0.16
Norway 106.55 80.62 137.9 0.11 0.08 0.14
Poland 447.22 336.3 588.9 0.46 0.34 0.6
Portugal 126.00 94.98 165.7 0.13 0.10 0.17
Romania 409.06 307.1 534.8 0.42 0.31 0.55
Russia 443.14 333.9 583.2 0.45 0.34 0.59
Serbia 409.00 308.6 536.5 0.42 0.32 0.55
Slovakia 437.15 328.6 573.7 0.45 0.34 0.59
Slovenia 402.66 302.6 528.0 0.41 0.31 0.54
Spain 132.35 97.34 178.6 0.13 0.10 0.18
Sweden 34.10 24.59 45.77 0.04 0.03 0.05
Switzerland 121.31 91.03 160.7 0.12 0.09 0.16
Turkey 258.52 195.3 333.2 0.26 0.20 0.34
Ukraine 428.91 321.5 565.7 0.44 0.33 0.57
United Kingdom 117.40 87.36 155.3 0.12 0.09 0.16
All countries 276.35 207.8 363.2 0.28 0.23 0.37
Western Europe 123.42 93.04 162.3 0.13 0.13 0.17
Central Europe 408.68 307.4 536.7 0.42 0.32 0.55
Eastern Europe 427.79 321.3 562.8 0.43 0.33 0.56
346 Arch Med Sci 2, February / 2021National and regional trends in the prevalence of polycystic ovary syndrome since 1990 within Europe:
the modeled estimates from the Global Burden of Disease Study 2016
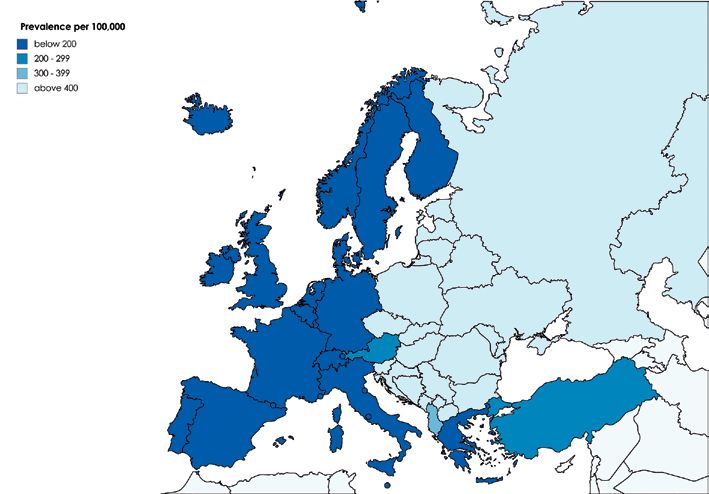
Figure 1. Estimates for polycystic ovary syndrome prevalence in Europe (2016)
A B
180 600
160
500
140
120 400
100
300
80
60 200
40
100
20
0 0
1990 1995 2000 2005 2010 2015 1990 1995 2000 2005 2010 2015
C
600
500
400
300
200
100
0
Figure 2. Trends in prevalence between 1990 and 2015
1990 1995 2000 2005 2010 2015 in Western (A), Eastern (B) and Central (C) Europe
except Portugal and Spain, were assigned to the tries, a moderate, negative correlation (R = –0.539,
highest SDI quintile. Among CE, SDIs were highly p = 0.0002) between SDI and PCOS prevalence
variable, ranging from a high (Croatia, Czech Repub- was found. There was also a significant difference
lic, Poland, Slovakia, and Slovenia) to middle SDI (p = 0.002) in the PCOS prevalence between countries
(Albania and Bosnia and Herzegovina). Likewise, with high, high-middle, and middle SDIs (Figure 4).
within EE, some countries were assign https:// This is illustrative of a connection between SDI and
doi.org/10.5114/aoms.2019.87112 ed to a high, the prevalence of PCOS across the various countries
high- middle, or middle SDIs. For all European coun- and regions of Europe reported in the GBD Study.
Arch Med Sci 2, February / 2021347Tomasz Miazgowski, Ira Martopullo, Justyna Widecka, Bartosz Miazgowski, Agnieszka Brodowska
Table III. Changes in polycystic ovary syndrome 900
prevalence in women aged 15–49 years between 800
1990 and 2016 by country and region
700
Country Percent Lower Upper 600
change bound bound 500
Albania –3.18 –5.05 –1.07 400
Andorra –2.79 –4.52 –0.40 300
Austria –5.79 –15.68 5.95 200
100
Belarus 1.12 –0.43 2.93
0
Belgium –3.46 –4.15 –2.53 15–19 20–24 25–29 30–34 35–40 40–44 45–49
Age [years]
Bosnia and Herzegovina 1.14 –0.92 3.52
Western Europe Eastern Europe Central Europe
Bulgaria 6.94 5.51 8.72
Croatia –0.98 –2.48 0.85 Figure 3. Frequency distribution of polycystic ovary
syndrome prevalence by age
Czech Republic 9.61 7.71 11.80
Denmark –2.79 –3.90 –1.99
Estonia 2.76 1.54 4.05 Discussion
Finland –4.96 –6.49 –3.74 In this study, we report for the first time the
France –4.75 –5.54 –3.77 national and regional modeled PCOS prevalence
Germany –5.84 –6.91 –4.52
rates in European females of reproductive age.
In 2016, there were great differences in PCOS prev-
Greece 1.10 –1.61 4.62
alence rates across Europe, with the lowest rates
Hungary 4.60 3.00 6.58 in Sweden and the highest in the Czech Republic
Iceland –2.59 –3.43 –1.41 (34.1 and 460.6 per 100,000, respectively). Aside
Ireland 5.55 2.35 9.63 from the differences between individual countries,
Italy –4.42 –14.48 7.96 there were also interregional differences. Although
Kazakhstan 0.42 –1.75 3.27 in CE and EE the rates were comparable, they were
more than three times higher than in WE. In addi-
Latvia 5.69 3.09 8.86
tion, within each of the three European regions,
Lithuania –0.59 –3.27 2.51
PCOS prevalence also differed. Between the years
Luxembourg –2.89 –3.95 –1.49 1990 and 2016, there were similar interregion-
North Macedonia 0.18 –1.31 1.88 al variations in prevalence, although throughout
Malta –5.67 –6.69 –4.62 this period, the overall trends in WE, EE and CE
Moldova 1.30 0.35 2.37 were relatively stable, with only a slight tendency
to decrease (WE) or increase (EE and CE). These
Montenegro 1.21 –0.76 3.68
differences by country and region suggest a possi-
Netherlands –6.20 7.12 –4.94
ble influence of environmental or genetic factors.
Norway –2.74 –3.22 –2.17 Among environmental factors, low childhood so-
Poland 3.94 11.17 7.27 cioeconomic status (SES) has been shown to be
Portugal 4.27 0.72 8.96 associated with negative overall health behaviors
Romania 0.63 –2.18 3.96 that can lead to weight gain [20], changes in hor-
Russia 0.79 –0.31 2.15
monal milieu, or increased genetic susceptibility
to PCOS symptoms [2, 21]. Low SES may also re-
Serbia –3.47 –4.63 –2.37
duce access to health care, thereby leading to de-
Slovakia 5.82 3.71 7.91 creased management and treatment of the condi-
Slovenia 3.85 0.71 7.52 tion [2]. Another potential pathway linking SES to
Spain 5.35 0.60 11.20 the risk of PCOS may be the association between
Sweden –9.62 –18.5 3.53 low SES-related intrauterine nutritional restriction
Switzerland –2.17 –2.87 –1.22 and the tendency towards small-for-gestation-
al age at delivery, which some researchers have
Turkey 11.35 6.68 16.65
proposed as one of the initiating factors for fetal
Ukraine 3.75 2.55 5.00
programming toward the development of thrifty
United Kingdom –3.90 –4.52 –3.21 PCOS phenotype [2, 22–25] and PCOS-associat-
All countries 0.06 –1.73 2.95 ed metabolic abnormalities in adulthood [26–28],
Western Europe –3.26 –5.56 –0.30 similar to human in utero exposure to androgen
Central Europe 3.34 1.72 5.15 access or experimental neonatal exposure to es-
trogen valerate [29]. However, the association of
Eastern Europe 1.60 0.50 2.81
low SES with the risk of PCOS seems to be more
348 Arch Med Sci 2, February / 2021National and regional trends in the prevalence of polycystic ovary syndrome since 1990 within Europe:
the modeled estimates from the Global Burden of Disease Study 2016
Table IV. Socio-demographic Index (SDI) 2016 in 600
European countries
500
Prevalence per 100,000
Country SDI 2016 SDI level
400
Andorra 0.915 High
300
Austria 0.892 High
Belgium 0.899 High 200
Denmark 0.925 High 100
Finland 0.907 High
0
High SDI High-middle SDI Middle SDI
France 0.869 High
Figure 4. Polycystic ovary syndrome prevalence in
Germany 0.889 High Europe by Socio-demographic Index (SDI) level
Greece 0.853 High
Iceland 0.921 High ally attained a high level of education [22]. Our
Ireland 0.885 High study has demonstrated a moderate negative
Italy 0.867 High association between PCOS prevalence and SDI,
Luxembourg 0.936 High suggesting that with higher income per capita,
Malta 0.856 High
higher educational attainment and a lower total
fertility rate, the rates of PCOS decrease. Howev-
Netherlands 0.918 High
er, although during the period 1990–2016 there
Norway 0.922 High were obvious differences in income and to a lesser
Portugal 0.796 High-middle extent in education and occupation between WE,
Spain 0.848 High-middle EE and CE, it seems unlikely that SES alone can
Sweden 0.872 High explain the threefold difference in PCOS preva-
Switzerland 0.901 High
lence between WE and the two other regions, and
the higher intraregional variations (for example,
UK 0.863 High
a six-fold difference between Austria and Swe-
Albania 0.725 Middle den) observed in our study. It cannot be excluded
Bosnia and Herzegovina 0.773 Middle that differences in the education of general prac-
Bulgaria 0.846 High-middle titioners in reimbursement of diagnosis and care
Croatia 0.850 High expenses for this condition might also play a role.
Czech Republic 0.881 High Additionally, during this period CE and EE have
had more pronounced changes in education and
Hungary 0.848 High-middle
employment as well as SES, while PCOS preva-
North Macedonia 0.793 High-middle
lence remained stable in both the whole of Europe
Montenegro 0.815 High-middle and the three European regions, thus suggesting
Poland 0.872 High a role of genetic determinants in this disorder. The
Romania 0.838 High-middle growing list of candidate genes that have been
Serbia 0.771 High-middle implicated in PCOS pathogenesis have revealed
relatively homogeneous genetic underpinnings for
Slovakia 0.880 High
this syndrome despite its heterogeneous clinical
Slovenia 0.881 High
manifestation [30, 31]. In addition, genome-wide
Turkey 0.762 High-middle association studies (GWASs) identified and rep-
Belarus 0.826 High-middle licated several loci which contained promising
Estonia 0.887 High candidates for PCOS risk genes [32–36], strongly
Kazakhstan 0.757 High-middle suggesting shared common genetic susceptibil-
ity factors for PCOS [37–39]. However, it seems
Latvia 0.853 High
unlikely that differences in the PCOS prevalence
Lithuania 0.876 High
found in our study could be explained solely by
Moldova 0.703 Middle the different distribution across Europe of allelic
Russia 0.832 High-middle variants associated with the odds for PCOS iden-
Ukraine 0.793 High-middle tified by GWASs, such as the difference in rates
between Sweden and other Nordic countries, or
complex, as some studies have demonstrated the highly variable overall trends during the past
that low childhood SES (measured by low paren- three decades observed in some countries. Fur-
tal education) increased the risk of PCOS but that ther genetic and epigenetic studies are needed to
this risk was limited only to those who person- elucidate the findings from this study.
Arch Med Sci 2, February / 2021349Tomasz Miazgowski, Ira Martopullo, Justyna Widecka, Bartosz Miazgowski, Agnieszka Brodowska
We found that PCOS prevalence in Europe had no role in the design, analysis or decision to
steeply increased with age, with the highest rates submit the manuscript for publication.
in women aged 35–39 years and 40–44 years
across all countries and regions. This finding Conflict of interest
might reflect the increase in the rates of obesity The authors declare no conflict of interest.
and overweight/obesity-associated insulin resis-
tance, which have been regarded as risk factors
for PCOS [2, 8, 10, 39, 40]. However, in the young- References
est age group, 15–19 years, quite a few adoles- 1. Jones MR, Goodarzi MO. Genetic determinants of poly-
cent females also had PCOS (97.83 per 100,000; cystic ovary syndrome: progress and future directions.
95% UI: 60.78–153.6). Hence, this age group is an Fertil Steril 2016; 106: 25-32.
important target for early detection and treat- 2. Merkin SS, Phy JL, Sites CK, Yang D. Environmental de-
terminants of polycystic ovary syndrome. Fertil Steril
ment of PCOS, especially in EE and CE, in which
2016; 106: 16-24.
the number of cases has continuously increased. 3. Kulhan M, Kulhan N, Nayki U, et al. Assessment of the
When interpreting our results, some limita- relationship between serum vitamin (A, B12, C, D, folate)
tions should be considered. Aside from the GBD and zinc levels and polycystic ovary syndrome. Arch
2016 study overall limitations that were discussed Med Sci Civil Dis 2017; 2: e62-9.
elsewhere [15], PCOS, which is a heterogeneous 4. Hardiman P, Pillay OC, Atiomo W. Polycystic ovary syn-
drome and endometrial carcinoma. Lancet 2003; 361:
disorder and is furthermore diagnosed by various
1810-2.
criteria, was mapped to the same single ICD code. 5. Zawadski JK, Dunaif A. Diagnostic criteria for polycys-
This can be a source of misclassification both for tic ovary syndrome. In: Givens JHF, Merriman G (eds).
this condition and its components. Second, the The Polycystic Ovary Syndrome. Blackwell Scientific,
term “prevalence” used in this study refers to Cambridge 1992; 377-84.
modeled estimates for an area in the defined time, 6. Rotterdam ESHRE/ASRM-Sponsored PCOS Consensus
and not to measured events; hence, the cross-sec- Workshop Group. Revised 2003 consensus on diagnos-
tic criteria and long-term health risks related to polycys-
tional studies performed on samples of Europe-
tic ovary syndrome. Fertil Steril 2004; 81: 19-25.
an females may provide different rates. The GBD 7. Azziz R, Carmina E, Dewailly D, et al. Positions state-
Study, in contrast to pooled analyses of the results ment: criteria for defining polycystic ovary syndrome as
from epidemiological studies, uses available data a predominantly hyperandrogenic syndrome: an Andro-
from many sources, and provides trends in mea- gen Excess Society guideline. J Clin Endocrinol Metab
sures over time based on state-of-the-art model- 2006; 91: 4237-45.
8. Sirmans SM, Pate KA. Epidemiology, diagnosis, and
ing methods. Such an approach may be especial-
management of polycystic ovary syndrome. Clin Epide-
ly useful in quantifying the sequelae of a broad miol 2013; 6: 1-13.
spectrum of conditions, such as PCOS, the rates 9. Jalilian A, Kiani F, Sayehmiri F, Sayehmiri K, Khodaee Z,
of which are difficult to estimate in cross-sectional Akbari M. Prevalence of polycystic ovary syndrome and
studies, for example due to inconsistent definition. its associated complications in Iranian women: a meta-
In conclusion, we found highly variable national analysis. Iran J Reprod Med 2015; 13: 591-604.
10. Alvarez-Blasco F, Botella-Carretero JI, San Millán JL, Escobar-
and regional prevalence rates for PCOS in Europe,
Morreale HF. Prevalence and characteristics of the poly-
which seem to be partially associated with dif- cystic ovary syndrome in overweight and obese women.
ferences in SDI across countries and regions. The Arch Intern Med 2006; 166: 2081-6.
negative association between SDI and PCOS prev- 11. Asuncion M, Calvo RM, San Millán JL, Sancho J, Avila S,
alence indicates that socio-demographic devel- Escobar-Morreale HF. A prospective study of the prev-
opment status has an impact on women’s health alence of the polycystic ovary syndrome in unselected
Caucasian women from Spain. J Clin Endocrinol Metab
within Europe. Between 1990 and 2016, the rates
2000; 85: 2434-8.
in WE, EE and CE countries were relatively stable, 12. Diamanti-Kandarakis E, Kouli CR, Bergiele AT, et al. A sur-
but they showed marked differences between in- vey of the polycystic ovary syndrome in the Greek island
dividual countries, thus suggesting that geograph- of Lesbos: hormonal and metabolic profile. J Clin Endocri-
ically unequal health and economic burdens are nol Metab 1999; 84: 4006-11.
caused by this disorder in Europe. Our estimates 13. Ding T, Baio G, Hardiman PJ, Petersen I, Sammon C. Diag
encourage the search at the population level for nosis and management of polycystic ovary syndrome in
the UK (2004–2014): a retrospective cohort study. BMJ
new environmental and genetic determinants of Open 2016; 6: e012461.
PCOS, as well as a more nuanced engagement 14. Conway G, Dewailly D, Diamanti-Kandarakis E, et al.
with diagnosis, treatment, and care. European survey of diagnosis and management of the
polycystic ovary syndrome: results of the ESE PCOS
Acknowledgments Special Interest Group’s Questionnaire. Eur J Endocrinol
2014; 171: 489-98.
The GBD Study is supported by the Bill & Me- 15. GBD 2016 Disease and Injury Incidence and Prevalence
linda Gates Foundation. The funding organization Collaborators. Global, regional, and national incidence,
350 Arch Med Sci 2, February / 2021National and regional trends in the prevalence of polycystic ovary syndrome since 1990 within Europe:
the modeled estimates from the Global Burden of Disease Study 2016
prevalence, and years lived with disability for 328 dis- syndrome on chromosome 2p16.3, 2p21 and 9q33.3. Nat
eases and injuries for 195 countries, 1990–2016: a sys- Genet 2011; 43: 55-9.
tematic analysis for the Global Burden of Disease Study 33. Shi Y, Zhao H, Cao Y, et al. Genome-wide association
2016. Lancet 2017; 390: 1211-59. study identifies eight new risk loci for polycystic ovary
16. Flaxman AD, Vos T, Murray CJL (eds.). An integrative me- syndrome. Nat Genet 2012; 44: 1020-5.
taregression framework for descriptive epidemiology. 34. Hayes MG, Urbanek M, Ehrmann DA, et al. Genome-wide
1st edn. University of Washington Press, Seattle 2015. association of polycystic ovary syndrome implicates al-
17. Global Burden of Disease Collaborative Network. Global terations in gonadotropin secretion in European ances-
Burden of Disease Study 2016 (GBD 2016) Results. Seat- try populations. Nat Commun 2015; 6: 7502.
tle, United States: Institute for Health Metrics and Eval- 35. Day FR, Hinds DA, Tung JY, et al. Causal mechanisms and
uation (IHME), 2017. Available from http://ghdx.health balancing selection inferred from genetic associations
data.org/gbd-results-tool. with polycystic ovary syndrome. Nat Commun 2015; 6:
18. Institute for Health Metrics and Evaluation (IHME). 8464.
Global Burden of Disease Collaborative Network. Global 36. Lee H, Oh JY, Sung YA, et al. Genome-wide association
Burden of Disease Study 2016 (GBD 2016): Causes of study identified new susceptibility loci for polycystic
death and nonfatal causes mapped to ICD codes. IHME, ovary syndrome. Hum Reprod 2015; 30: 723-31.
Seattle 2017. 37. Louwers YV, Stolk L, Uitterlinden AG, Laven JS. Cross-eth-
19. Institute for Health Metrics and Evaluation (IHME). Re- nic meta-analysis of genetic variants for polycystic
thinking development and health: Findings from the ovary syndrome. J Clin Endocrinol Metab 2013; 98:
Global Burden of Disease Study. IHME, Seattle 2016. E2006-E2012.
20. Stevens, GA, Alkema, L, Black, RE, et al. Guidelines for 38. Casarini L, Brigante G. The polycystic ovary syndrome
accurate and transparent health estimates reporting: evolutionary paradox: a genome-wide association stud-
the GATHER statement. Lancet 2016; 388: e19-23. ies-based, in silico, evolutionary explanation. J Clin Endo-
21. Wang Y, Beydoun MA. The obesity epidemic in the Unit- crinol Metab 2014; 99: E2412-20.
ed States – gender, age, socioeconomic, racial/ethnic, 39. Lucidi RS. Polycystic ovarian syndrome. Medscape 28 Aug
and geographic characteristics: a systematic review and 2017. Available at: https://emedicine.medscape.com/ar-
meta-regression analysis. Epidemiol Rev 2007; 29: 6-28. ticle/256806-overview#a3
22. Merkin SS, Azziz R, Seeman T, et al. Socioeconomic sta- 40. Zaki M, El-Bassyouni H, El-Gammal M, Kamal S. Indica-
tus and polycystic ovary syndrome. J Womens Health tors of the metabolic syndrome in obese adolescents.
(Larchmt) 2011; 20: 413-9. Arch Med Sci 2015; 11: 92-8.
23. de Melo AS, Dias SV, Cavalli Rde C, et al. Pathogenesis
of polycystic ovary syndrome: multifactorial assessment
from the foetal stage to menopause. Reproduction
2015; 150: 11-24.
24. Melo AS, Vieira CS, Barbieri MA, et al. High prevalence
of polycystic ovary syndrome in women born small for
gestational age. Hum Reprod 2010; 25: 2124-31.
25. Gur EB, Karadeniz M, Turan GA. Fetal programming of
polycystic ovary syndrome. World J Diabetes 2015; 6:
936-42.
26. Xita N, Tsatsoulis A. Fetal programming of polycystic ova-
ry syndrome by androgen excess: evidence from exper-
imental, clinical, and genetic association studies. J Clin
Endocrinol Metab 2006; 91: 1660-6.
27. Marciniak A, Patro-Małysza J, Kimber-Trojnar Ż, Marci
niak B, Oleszczuk J, Leszczyńska-Gorzelak B. Fetal pro-
gramming of the metabolic syndrome. Taiwan J Obstet
Gynecol 2017; 56: 133-8.
28. Andrea SB, Hooker ER, Messer LC, Tandy T, Boone-Hei-
nonen J. Does the association between early life growth
and later obesity differ by race/ethnicity or socioeco-
nomic status? A systematic review. Ann Epidemiol 2017;
27: 583-92.
29. Martinez-Pinto J, Piquer B, Tiszavari M, Lara HE. Neo-
natal exposure to estradiol valerate reprograms the rat
ovary androgen receptor and anti-Müllerian hormone to
a polycystic ovary phenotype. Reprod Toxicol 2018; 75:
127-35.
30. Urbanek M, Sam S, Legro RS, Dunaif A. Identification
of a polycystic ovary syndrome susceptibility variant in
fibrillin-3 and association with a metabolic phenotype.
J Clin Endocrinol Metab 2007; 92: 4191-8.
31. Vink JM, Sadrzadeh S, Lambalk CB, Boomsma DI. Herita-
bility of polycystic ovary syndrome in a Dutch twin-fam-
ily study. J Clin Endocrinol Metab 2006; 91: 2100-4.
32. Chen ZJ, Zhao H, He L, et al. Genome-wide association
study identifies susceptibility loci for polycystic ovary
Arch Med Sci 2, February / 2021351You can also read