Performance of individual dietary diversity score to identify malnutrition among patients living with HIV in Ethiopia
←
→
Page content transcription
If your browser does not render page correctly, please read the page content below
www.nature.com/scientificreports
OPEN Performance of individual
dietary diversity score to identify
malnutrition among patients living
with HIV in Ethiopia
Foziya Mohammed Hussien1*, Wondwosen Mebratu1, Aragaw Yimer Ahmed2,
Tefera Chane Mekonnen1, Anissa Mohammed Hassen1, Zinet Abegaz Asfaw1,
Hamid Yimam Hassen3 & Kalkidan Hassen Abate4
There is a lack of uniformity in developing and validating indicators of nutritional status among
People Living with Human Immunodeficiency Virus (PLHIV). Experiences from low and middle-
income countries are scant, and differences in methodological and analytical approaches affect the
comparability and generalizability of findings. Therefore, this study investigated the performance of
individual diversity score (IDDS) as a proxy indicator of nutritional status among PLHIV. We conducted
a facility-based cross-sectional study among 423 PLHIV who were under Antiretroviral Treatment
(ART) at clinics in Bahir-Dar, Ethiopia. We collected data on sociodemographic, dietary, clinical, and
anthropometric measures. Dietary intake was assessed using 24-Hour dietary recall. Body Mass
Index (BMI) was calculated to assess the nutritional status of study subjects. The receiver operating
characteristic (ROC) curve analysis was used to assess the ability of the IDDS and Minimum Dietary
Diversity for Women (MDD-W) to detect poor nutritional status. Furthermore, sensitivity, specificity,
Predictive Values (PPs), and Likelihood Ratios (LRs) were calculated at different cut-off points. IDDS
showed good reliability with Cronbach’s Alpha of 0.76. The Area Under the Curve (AUC) of IDDS was
78.5 (95%CI 73.9–83.4). At the IDDS cut-off of 4, the sensitivity and specificity of IDDS to indicate
nutritional status were 88.0% (95%CI 81.0–93.0) and 71.0% (95%CI 66.0–76.0), respectively. The AUC
of MDD-W was 74.1%, and at the cut-off of 4 the sensitivity and specificity of MDD-W to indicate
undernutrition were 73.0% and 72.0%, respectively. Both IDDS and MDD-W have good accuracy as
a proxy indicator for measuring the nutritional status of PLHIV. In the prevention of undernutrition
among PLHIV especially in a resource-limited setting, IDDS and MDD-W can be used to assess
nutritional status.
Abbreviations
AIDS Acquired immune deficiency syndrome
ART Anti-Retroviral Therapy
AUC Area Under ROC Curve
BMI Body Mass Index
CI Confidence Interval
HIV Human Immune Deficiency Virus
IDDS Individual Dietary Diversity Score
LR− Negative Likelihood Ratio
LR+ Positive Likelihood Ratio
NPV Negative Predictive Value
MPA Mean Probability of Adequacy
PLHIV People Living With Human Immune deficiency Virus
1
Department of Public Health, College of Medicine and Health Science, Wollo University, Dessie,
Ethiopia. 2Department of Internal Medicine, School of Medicine, College of Medicine and Health Science, Wollo
University, Dessie, Ethiopia. 3Department of Public Health, College of Medicine and Health Science, Mizan-Tepi
University, Mizan‑Tepi, Ethiopia. 4Department of Public Health Nutrition, School of Public Health, College of
Medicine and Health Sciences, Jimma University, Jimma, Ethiopia. *email: foziyamohammed2018@gmail.com
Scientific Reports | (2021) 11:18681 | https://doi.org/10.1038/s41598-021-98202-6 1
Vol.:(0123456789)www.nature.com/scientificreports/
PPS Proportional to Population Size
PPV Positive Predictive Value
ROC Receiver Operating Characteristic
SD Standard Deviation
Globally, 38.0 million people live with HIV and the disease accounted for 690,000 deaths in 20191. In Ethiopia,
an estimated 710, 000 people were living with HIV and there were 20,000 HIV-related d eaths2. Although more
people are surviving due to increased availability of ART, there is still a need to increase survival and quality of
life by improving nutrition. Eating a diversified diet for PLHIV increases resistance to opportunistic infections
improves energy, and makes a person generally stronger and more p roductive3.
Lack of diversified diets and malnutrition are public health concerns worldwide, particularly in low and
middle-income countries (LMICs)4. Nutritional guidelines recommend increasing the variety of food as well
as food groups consumed emphasizing the absence of a single food that contains all the required nutrients for
optimal health5. Therefore, dietary diversity is needed to meet the requirements of micronutrients and energy
especially for those who are at risk of nutritional deficiencies including PLHIV6,7. Besides, a diversified diet can
induced immunity then increase antiretroviral tolerance (reduce viral load and side effects), absorption, leading
to a decrease in morbidity and improvement in survival t ime8–12.
Accurate and consistent measurement of dietary intake and patterns of eating behavior is necessary to monitor
and evaluate the effectiveness of public health interventions aimed at improving diet and reduce malnutrition.[13]
Dietary methods are useful tools for nutritional assessment and monitoring of economic c onditions13. IDDS is an
abits7,14. It is more of a proxy of the nutrient (mainly
indicator for assessing the quality of an individual’s dietary h
7
micronutrient) adequacy of the diet of an i ndividual . Diversity scores are attractive to use because of their ease
of measurement and interpretation. However, there is no international consensus on the number and type of
food groups to include in the IDDS, and consistent cutoffs to determine the adequacy of dietary diversity7,15.
Therefore, in resource-limited settings, a simple, easy to use, and accurate method is needed to assess nutritional
status. Tool validation is of particular importance in any dietary assessment m ethod13,16.
Dietary diversity scores (DDS) have been validated in different age or sex groups as a proxy measure for the
macro or micronutrient adequacy of the diet8,17–20. They are associated with the mean micronutrient adequacy
of the diet21,22. DDS has also been shown to be associated with the nutritional status of individuals after adjusting
for socioeconomic f actors23–25. Despite the relationship between DDS and individual nutritional status, the use
of such an indicator for nutritional assessment, monitoring, and evaluation is still c ontroversial10,26–29. There is
also a lack of consensus on how to measure and operationalize DDS10,15. These inconsistencies could be attribut-
able to disparities in sociodemographic characteristics, economic, and food type across contexts17. These issues
impede the adoption of standardized indicators, which would be useful for comparing dietary diversity across
populations and over t ime30.
Due to a lack of uniformity and consensus, research is needed in LMICs to develop valid and reliable indi-
cators of dietary d iversity31,32. Furthermore, in LMICs measuring dietary diversity in the context of assessing
nutritional status is scant, and differences in methodological and analytical approaches affect the comparability
and generalizability of findings15,31. Our previous study showed that household dietary diversity (HDD) has a
good validity to assess nutritional status in PLHIV. However, the performance of individual dietary diversity, a
tool that assesses the overall quality of an individual’s diet, has yet to be validated.
Furthermore, poor dietary diversity in PLHIV has been associated with weight loss, disease progression
opportunistic infections, and poor survival33. Thus, adequate dietary diversity is a key to strengthen the immunity
system, maintain muscle mass, prevent viral progression and keep PLHIV h ealthy33,34. Therefore, measuring the
validity and determining IDDS cutoffs in this population group is important to consider targeted interventions.
Hence, we evaluated the performance of individual dietary diversity to identify nutritional status among PLHIV.
Methods
Study setting, design, and participants. The study was conducted in Bahir Dar city, the capital of
Amhara region in North-western Ethiopia, situated on the southern shore of Lake Tana. The commonly culti-
vated and consumed foods in the area are teff, maize, barley, wheat, tomato, and green leafy vegetables, whereas
fruits are rarely consumed in the a rea35. A facility-based, cross-sectional study was conducted among 423 PLHIV
who were attending Anti-retroviral treatment (ART) clinics in Bahir Dar, Ethiopia, from January to February
2017. All ART clinics, seven of which were public, and three private, were included in the study. The study
included men and women aged 18 years or older who were HIV positive and under treatment at the ART centers
during the data collection period. We excluded critically ill patients and pregnant women from the study. The
sample size (423) was determined using a single population proportion formula assuming a 50% proportion,
with a 95% confidence level, 5% margin of error, and an expected 10% non-response rate. From a total of 10,666
patients, the sample size was allocated to each ART clinic using proportional to population size (PPS). Then,
eligible participants were taken from each selected ART clinic consecutively until the required sample size was
obtained.
Data collection technique. We collected data on socioeconomic status including education and occupa-
tion, dietary habits, clinical conditions, using a structured questionnaire, and anthropometric measurements.
The questionnaire was adapted from the Ethiopian Demographic and Health Survey (EDHS) 2016 and modified
accordingly36.
Scientific Reports | (2021) 11:18681 | https://doi.org/10.1038/s41598-021-98202-6 2
Vol:.(1234567890)www.nature.com/scientificreports/
Index variable. Dietary intake data was collected using a 24-h recall method. Additionally, the individual
dietary diversity sheet including staple foods and beverages which was grouped into 9 groups: (1) Starchy stables;
(2) Vitamin-A rich vegetables and fruits; (3) Other fruits and vegetables; (4) meat and fish; (5) Dark green leafy
vegetables; (6) Organ meat; (7) Egg; (8) Legumes, nuts and seeds; (9) Milk and milk product was used to collect
the data7. After the study subjects were asked to remember whatever they consumed in the past 24 h, the probing
questions were followed to recall other food items. All foods eaten by the individual of interest, consumed inside
or outside the home, regardless of where the food prepared was included. Very small food quantities less than
one teaspoon (< 10 g) were excluded. If a person is on a special occasion such as fasting, funeral, and feast, the
next person was selected. A set of 9 food groups were used to guide the scoring as per the food items consumed,
with 0 being the minimum score and 9 as the maximum37.
The Minimum Dietary Diversity for Women (MDD-W) was grouped into 10 food groups: (1) Grains, roots,
and tubers; (2) Pulses (Legumes); (3) Nuts and seeds; (4) Milk and milk products; (5) Meat, poultry and fish; (6)
Eggs; (7) Dark green leafy vegetables; (8) Other vitamin A-rich fruits and vegetables; (9) Other vegetables; (10)
Other fruits38. A set of 10 food groups were used to guide the scoring as per the food items consumed, with 0
being the minimum score and 10 as the m aximum38.
Outcome variable. Height was taken in a standing position without wearing shoes, at the apex of the head,
with 0.1 cm precision39. Similarly, weight was taken by removing footwear and heavy clothing, using digital
weighing scales, to the nearest 0.1 kg. Measurements were taken twice and the mean score was recorded40.
Body mass index (BMI) was calculated to determine an individual’s nutritional status by dividing weight in
kilograms (kg) by height in meters (m) squared, then classified as underweight (< 18.5 kg/m2), healthy weight
(18.5–24.9 kg/m2), overweight (25–29.9 kg/m2), and obese (> 30 kg/m2)41. Finally, those participants identified
as undernutrition were given nutritional counseling and therapeutic feeding in collaboration with the clinicians
working at ART clinics.
Data quality control. To maintain the quality of data, training was given to the data collectors (clinical
staff nurses) and supervisors on the data collection, interviewing, and measurement techniques. Then, the col-
lected data were revised and possible errors were returned to the data collectors for correction daily. Moreover,
the pre-test was conducted before the actual data collection period. Measuring equipment was calibrated every
ten measurements.
Data analysis. Data were entered into EpiData version 3.1 and exported to a free statistical software R
version 4.0.3 for further processing and analysis42. The characteristics of study participants were summarized
using descriptive statistics including mean/median with standard deviation (SD)/interquartile range (IQR), and
absolute and relative frequencies.
For all items of IDDS, reliability analysis was done and Cronbach’s Alpha coefficient was calculated. A Cron-
bach’s Alpha value of > = 0.9, 0.7–0.9, 0.5–0.7, 0.3–0.5, respectively were considered as very high, high, moderate,
and low reliability43.
To assess the ability of the IDDS to detect poor nutritional status, we used Receiver operating characteristic
(ROC) curve. In a ROC curve, the true positive rate was plotted as a function of the false positive rate at differ-
ent cut-off points of the test variable (number of scores) in comparison with BMI as a reference standard. Each
point on a ROC curve represents a sensitivity/specificity pair corresponding to a particular decision threshold.
The optimal cut-off point was also determined by maximizing the Youden’s index (J = Sensitivity + Specificity − 1)
and, with the minimum distance to the upper left corner on the Receiver operating characteristic (ROC) curve.
The area under the ROC curve (AUC) was used as an indication of the predictive power or the accuracy
of the proxy indicator to correctly classify the nutritional status. A perfect classification by the proxy indicator
would result in an AUC of 1. AUC below 0.6 is considered not a cceptable44. Furthermore, the discriminatory
and predictive potential of IDDS against BMI was assessed using sensitivity, specificity, positive predictive value
(PPV), negative predictive value (NPV), positive and negative likelihood ratio with 95% confidence interval.
Ethical consideration. Ethical approval was obtained from the Institutional Review Board of Wollo Uni-
versity, College of Medicine and Health sciences. Written informed consent was obtained from each participant
after an explanation of the study purpose, description of the possible risks and benefits. Privacy and confidential-
ity of the collected information were ensured throughout the process. We confirm that the study was in compli-
ance with the principles of the declaration of Helsinki.
Results
Socio‑demographic characteristics. A total of 423 adults living with HIV aged 18 years or older were
enrolled in the study. Of the respondents 42.6% were male and 60.0% were married. The mean age was 34.8 years
(SD 8.4), and 56.3% were within the 18–35 years age group. The average family size was 3 (SD 2) people per
household. Sixty-eight (16.1%) of the respondents could not read or write. About 64.1% reported an average
monthly income higher than 1001(37.3 USD) Ethiopian birr per month with the median income of 2000 birr (1
USD = 26.84 ETB). Above a quarter (26.2%) were employed in public institutions and 6.1% were rural residents
(Table 1).
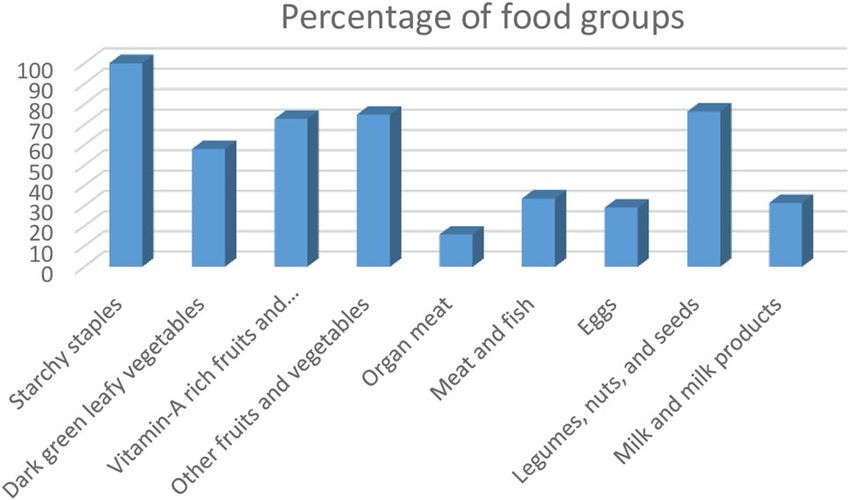
Individual dietary diversity of PLHIV. Figure 1 summarizes the intake of food types within 24 h preced-
ing the survey date. All participants reported that they had consumed starchy staples in the previous 24 h. Two
Scientific Reports | (2021) 11:18681 | https://doi.org/10.1038/s41598-021-98202-6 3
Vol.:(0123456789)www.nature.com/scientificreports/
Variable Frequency Percent
Sex
Male 180 42.6
Female 243 57.4
Age group (years)
18–35 238 56.3
36–55 179 42.3
56+ 6 1.4
Religion
Orthodox 331 78.3
Muslim 71 16.8
Protestant 21 5.0
Ethnicity
Amhara 378 89.4
Tigre 24 5.7
Oromo 19 4.5
Others 2 0.5
Marital status
Single 68 16.1
Married 254 60.0
Divorced 75 17.7
Widowed 26 6.1
Educational status
Cannot read and write 68 16.1
Primary education (1–8) 115 27.2
Secondary education (9–12) 126 29.8
Tertiary education (> 12) 114 27.0
Occupation
Government employed 111 26.2
Farmer 7 1.7
Self-employed 78 18.4
Daily laborer 69 16.3
Merchant 76 18.0
Housewife 77 18.2
Retired 5 1.2
Monthly HH Income
< = 500 73 17.3
501–1000 79 18.7
1001+ 271 64.1
Residence
Urban 397 93.9
Rural 26 6.1
Total 423 100
Table 1. Sociodemographic characteristics of the study participants in ART clinics of Bahir Dar, 2017
(N = 413).
hundred forty-five (57.9%) reported consuming dark green leafy vegetables, 72.8% vitamin A-rich fruits and
vegetables, 74.9% other fruits and vegetables, and 76.4% legumes, nuts, and seeds. One-third (33.6%) consumed
meat and fish, 29.1% egg, and 31.4% use milk and milk products. However, only 15.8% consumed organ meat
in the 24 h preceding the survey. The mean IDDS score was 4.9 (SD 2.3). A bit lower than one third (30.3%) of
study participants had inadequate dietary diversity as computed by less than four food groups, whereas 69.7% of
them consumed adequate dietary diversity (Fig. 1).
Nutritional status of peoples living with HIV. Overall, the prevalence of undernutrition was 29.3%,
whereas 2.4% of study subjects were overweight. Of them, 28.9% and 29.6% of male and female participants
were undernourished respectively. One-third (29.8%) of PLHIV within the age of 18–35 and 29.1% with the age
of 36–55 were undernourished. Approximately, one-third (29.0%) of urban and 34.6% of rural residents were
undernourished. More than half (56.5%) of PLHIV who had low dietary diversity were undernourished, but
Scientific Reports | (2021) 11:18681 | https://doi.org/10.1038/s41598-021-98202-6 4
Vol:.(1234567890)www.nature.com/scientificreports/
Figure 1. The prevalence of IDD food groups consumed by PLHIV in all ART clinics of Bahir Dar, 2017
(N = 413).
Figure 2. Receiver operating characteristic curve of MDD-W by using nutritional status as a benchmark of
PLHIV in all Bahir Dar ART clinics, 201742.
Sensitivity Specificity
Cutoff (95%CI) (95%CI) PPV (95%CI) NPV (95%CI) LR+ (95%CI) LR− (95%CI) Youden Indexwww.nature.com/scientificreports/
Items Corrected item-total correlation Cronbach’s Alpha if Item deleted
Starchy stables 0.000 0.776
Vitamin-A rich vegetables and fruits 0.388 0.751
Other fruits and vegetables 0.407 0.747
Meat and fish 0.589 0.716
Dark green leafy vegetables 0.449 0.742
Organ meat 0.597 0.721
Egg 0.601 0.715
Legumes, nuts and seeds 0.256 0.770
Milk and milk product 0.564 0.721
Table 3. Reliability analysis result of individual dietary diversity measurement tool of PLHIV in all Bahir Dar
ART clinics, 2017.
Figure 3. Receiver operating characteristic curve of IDDS by using nutritional status as a benchmark of PLHIV
in all Bahir Dar ART clinics, 201742.
Sensitivity Specificity
Cutoff (95%CI) (95%CI) PPV (95%CI) NPV (95%CI) LR+ (95%CI) LR− (95%CI) Youden Index
2.91 (0.80–www.nature.com/scientificreports/
Discussion
The prevalence of undernutrition in PLHIV was high (29.3%). Similarly, significant number of study subjects
(30.3%) had inadequate dietary diversity. Majority (56.5%) of PLHIV who had low dietary diversity were under-
nourished. IDDS was a good reliable tool for measuring the dietary diversity of individuals. Its predictive power
was good to classify the nutritional status of PLHIV. Additionally, the sensitivity and specificity of IDDS to cor-
rectly classify positive and negative outcomes were good. Among nine food groups, four were a cut-off point that
maximizes the sensitivity and specificity of IDDS. Similarly, MDD-W has a comparable accuracy with IDDS for
measuring nutritional status of PLHIV and its optimal cutoff point was four.
Majority PLHIV who had low dietary diversity were undernourished. This finding was consistent with several
studies done in the world45–47. Inadequate dietary diversity contributes to micronutrient deficiency that lead to
further HIV/AIDS progression and the reduction of CD4 count which increases risk of opportunistic infections3.
This opportunistic infections altered nutrient intake, absorption and metabolism leading to malnutrition3.
In our study, the individual dietary diversity measurement tool showed good reliability (Cronbach’s
Alpha = 0.76). From nine items, starchy stables had no item-total correlation. Although it was inconsistent, it
had no great effect on Cronbach’s Alpha, if deleted it raises Cronbach’s Alpha to 0.77. This might be due to all
participants consumed this food group resulting in 0 variance. Therefore, it is better to retain this food group.
Furthermore, legumes, nuts, and seeds had a fair item-total correlation (0.26) and only change Cronbach’s Alpha
to less than one unit, so this item was reliable for measuring the dietary diversity of PLHIV.
The overall accuracy of IDDS to correctly classify nutritional status measured with BMI was 78.5%. In LMIC,
a relationship between dietary diversity scores and individuals’ nutritional status has already been shown in
several studies45,48,49. However, validation of IDDS as a proxy indicator of nutritional status is limited. Our
study is consistent with the study done in India which reported, individual dietary diversity score was a good
proxy for the nutritional status of rural a dults25. A study conducted in Sri Lanka adults and elders also showed
a strong correlation between dietary diversity and BMI, indicating DDS are useful proxy indicators of nutrient
adequacy48,50. The more varied and/or diversified the diet, as reflected by IDDS, the higher the anthropometric
indices, reflecting a better nutritional status. Food intake increases when there is more variety in a meal or diet
and later associated with increased body weight. On the other hand, inadequately diversified food leads to low
micronutrient and caloric intake, which might contribute to the pathogenesis of HIV through increasing oxida-
tive stress and compromised immunity and indirectly resulting in u ndernutrition3.
In this study, IDDS showed a good true positive and true negative rate in which 88.0% of undernourished
PLHIV were correctly classified if they consumed less than four food group per day as a cutoff point from a total
of nine food groups and 71.0% of well-nourished PLHIV were correctly classified by this cutoff point. This find-
ing is inconsistent with a study done in Sri Lanka indicated that the best cutoff point for maximizing sensitivity
and specificity of achieving 50% of MAR (mean adequacy ratio) was 4.5 for D DS50. Although we used a different
benchmark, the cutoff point for optimal accuracy measures was similar. Hence, a cutoff point of 4 food groups
could be taken to identify IDDS among PLHIV.
Our study found that MDD-W was a good proxy indicator for measuring nutritional status of PLHIV. This
finding was supported by other studies which reported that dietary diversity was a good proxy indicator for
micronutrient adequacy, dietary quality, and nutritional status of w omen27,46,51,52. MDD-W had a good sensitiv-
ity and specificity rate in which 73.0% of undernourished PLHIV were correctly classified if they consumed less
than four food group per day as a cutoff point from a total of 10 food groups and 72.0% of well-nourished PLHIV
were correctly classified by this cutoff point. This finding is in line with the study conducted on Burkina F aso53.
Conversely, our result is inconsistent with several studies in which 4.5 and 5 were the optimal cutoff points that
maximized the sensitivity and specificity of MDD-W38,54–56. This might be due to the difference in the reference
variable and targeted population. Therefore, further largescale studies using different parameters in women of
reproductive age group of PLHIV are needed to provide appropriate optimal cut-off point.
The present study provides evidence that IDDS and MDD-W have good sensitivity and specificity, implying
that this tools are good for estimating the nutritional status of PLHIV as they measures the real dietary intake
of PLHIV. Thus, IDDS and MDD-W can be used as a proxy indicator of nutritional status. However, they might
not be used as a diagnostic or direct indicator for nutritional status. Hence, whenever equipment is available,
we recommend using BMI as a measure of nutritional status. Whereas, in resource-limited settings IDDS and
MDD-W can be used as a proxy indicator of an individual’s nutritional status.
This study has its strengths and limitations. The present study is the first in its type and can be used as a base-
line for further research in the subject area. It is also interpreted considering the following limitations. Firstly,
the data came from one geographical location, Bahir Dar. Therefore, using the standard cut-off point for this
specific population might be not feasible for wider use, further validation studies are needed with larger sample
sizes and in other locations. Then, it is not considered a repeated 24-h recall for measuring dietary diversity.
Data availability
It is available, based on a request we will give.
Received: 29 January 2021; Accepted: 27 August 2021
References
1. UNAIDS. Global HIV & AIDS statistics—2020 fact sheet (2021).
2. WHO. Ethiopia HIV Country Profile: 2016 (2017).
3. Rajabiun, S. HIV/AIDS: A Guide for Nutrition, Care, and Support. 2001: Food and Nutrition Technical Assistance Project, Academy
for Educational ….
Scientific Reports | (2021) 11:18681 | https://doi.org/10.1038/s41598-021-98202-6 7
Vol.:(0123456789)www.nature.com/scientificreports/
4. Amare, T. W. et al. Factors associated with dietary diversity among HIV positive adults (≥ 18 years) attending ART clinic at Mettema
hospital, Northwest Ethiopia: Cross-sectional study. J. AIDS Clin. Res. 6, 8 (2015).
5. Drimie, S. et al. Dietary diversity of formal and informal residents in Johannesburg, South Africa. BMC Public Health 13(1), 911
(2013).
6. Wiesmann, D., et al Validation of the world food programmes food consumption score and alternative indicators of household
food security. Int. Food Policy Res. Inst. 2, 00870 (2009).
7. FAO, F. Guidelines for measuring household and individual dietary diversity. Food and Agriculture Organization of the United
Nations (FAO) the Food and Nutrition Technical Assistance (FANTA) Project, Rome, Italy (2007).
8. Rathnayake, K. M., Madushani, P. A. E. & Silva, K. Use of dietary diversity score as a proxy indicator of nutrient adequacy of rural
elderly people in Sri Lanka. BMC. Res. Notes 5(1), 469 (2012).
9. Nsele, N. The effect of seasonal food variety and dietary diversity on the nutritional status of a rural community in KZN. (2014).
10. Ruel, M. T. Is Dietary Diversity an Indicator of Food Security or Dietary Quality? (International Food Policy Research Institute
(IFPRI), 2002).
11. Hsu, J. W. C. et al. Macronutrients and HIV/AIDS: A Review of Current Evidence (World Health Organization, 2005).
12. Organization, W. H. Consultation on Nutrition and HIV/AIDS in Africa: Evidence, Lessons and Recommendations for Action (World
Health Organization, 2005).
13. Assessment, D. A Resource Guide to Method Selection and Application in Low Resource Settings (FAO, 2018).
14. Organization, W.H. Community-based management of severe acute malnutrition: a joint statement by the World Health Organiza-
tion, the World Food Programme, the United Nations System Standing Committee on Nutrition and the United Nations Children’s
Fund (World Health Organization, 2007).
15. Ruel, M. T. Operationalizing dietary diversity: A review of measurement issues and research priorities. J. Nutr. 133(11), 3911S-3926S
(2003).
16. Penn, L. et al. Assessment of dietary intake: NuGO symposium report. Genes Nutr. 5(3), 205–213 (2010).
17. Habte, T. Y. & Krawinkel, M. Dietary diversity score: A measure of nutritional adequacy or an indicator of healthy diet. J. Nutr.
Health Sci. 3(3), 303 (2016).
18. Mirmiran, P. et al. Dietary diversity score in adolescents—A good indicator of the nutritional adequacy of diets: Tehran lipid and
glucose study. Asia Pac. J. Clin. Nutr. 13(1), 56–60 (2004).
19. Kennedy, G. L. et al. Dietary diversity score is a useful indicator of micronutrient intake in non-breast-feeding Filipino children.
J. Nutr. 137(2), 472–477 (2007).
20. Hussein, F. M., Ahmed, A. Y. & Muhammed, O. S. Household food insecurity access scale and dietary diversity score as a proxy
indicator of nutritional status among people living with HIV/AIDS, Bahir Dar, Ethiopia, 2017. PLoS ONE 13(6), e0199511 (2018).
21. Arimond, M. et al. Dietary Diversity as a Measure of the Micronutrient Adequacy of Women’s Diets in Resource-poor Areas: Summary
of Results from Five Sites Vol. 360 (FANTA-2 Bridge, FHI, 2011).
22. Kennedy, G.L. Evaluation of dietary diversity scores for assessment of micronutrient intake and food security in developing countries
(2009).
23. Warren, E., Hawkesworth, S. & Knai, C. Investigating the association between urban agriculture and food security, dietary diversity,
and nutritional status: A systematic literature review. Food Policy 53, 54–66 (2015).
24. Chegere, M. J. & Stage, J. Agricultural production diversity, dietary diversity and nutritional status: Panel data evidence from
Tanzania. World Dev. 129, 104856 (2020).
25. Nithya, D. & Bhavani, R. Dietary diversity and its relationship with nutritional status among adolescents and adults in rural India.
J. Biosoc. Sci. 50(3), 397–413 (2018).
26. UNS. Task Force on Assessment, Monitoring, and Evaluation Fact Sheets on Food and Nutrition Security Indicators/Measures: Dietary
Diversity (dd) Standing Committee on Nutrition (United Nations System, 2008).
27. Savy, M. et al. Use of variety/diversity scores for diet quality measurement: Relation with nutritional status of women in a rural
area in Burkina Faso. Eur. J. Clin. Nutr. 59(5), 703–716 (2005).
28. Donini, L. M. et al. A consensus proposal for nutritional indicators to assess the sustainability of a healthy diet: The Mediterranean
diet as a case study. Front. Nutr. 3, 37 (2016).
29. Ruel, M.T. Is dietary diversity an indicator of food security or dietary quality? A review of measurement issues and research needs.
(2003).
30. Kennedy, G. L. Evaluation of Dietary Diversity Scores for Assessment of Micronutrient Intake and Food Security in Developing
Countries (Wageningen University, 2009).
31. Ruel, M.T. Is dietary diversity an indicator of food security or dietary quality? A review of measurement issues and research needs
food consumption and nutrition division. International Food Policy Research Institute Washington, D.C, November 2002. 140.
32. Savy, M., Martin-Prevel, Y., Sawadogo, P., Kameli, Y. & Delpeuch, F. Use of variety/diversity scores for diet quality measurement:
Relation with nutritional status of women in a rural area in Burkina Faso. Eur. J. Clin. Nutr. 59, 703–716 (2005).
33. Yasuoka, J. et al. Nutritional status and dietary diversity of school-age children living with HIV: A cross-sectional study in Phnom
Penh, Cambodia. BMC Public Health 20(1), 1181 (2020).
34. Mpontshane, N. et al. HIV Infection Is Associated with Decreased Dietary Diversity in South African Children. J. Nutr. 138(9),
1705–1711 (2008).
35. Melkamu Alemayehu, E. A., Tilahun, G. & Assaye, H. Maximizing the Potential of Bahir Dar Area in Healthy Food Production
(Healthy Food Africa, 2021).
36. Csa, I. Central statistical agency (CSA)[Ethiopia] and ICF. Ethiopia demographic and health survey, Addis Ababa, Ethiopia and
Calverton, Maryland, USA (2016).
37. Gina Kennedy, T.B.a.M.D., Guidelines for measuring household and individual dietary diversity. FAO, 2013: p. 9.
38. 360, F.a.F. Minimum Dietary Diversity for Women (MDD-W), A Guide to Measurement. FAO: Rome, Italy (2016).
39. FMOH. National Guidelines for HIV/AIDS and Nutrition in Ethiopia. The Federal Democratic Republic of Ethiopia Ministry of
Health (2008).
40. Dorcus, N. W. Z. K. E. G. N. M. Contribution of Amaranth Grain (A. Cruentus) on dietary intake and Nutritional Status of Adults
Living with HIV in Mweiga, Nyeri, Kenya. J. Basic Appl. Sci. Res. 4, 4 (2014).
41. Cook, G. B. M. N. C. P. W. H. J. Measuring Food Security in the United States Guide to Measuring Household Food Security (USDA,
2000).
42. Team, R.C. R: A Language and Environment for Statistical Computing, R.F.f.S. Computing, Editor. Vienna, Austria (2020).
43. Assessment, O.O.E. Understanding Item Analysis. University of Washington (2017).
44. Hoddinott, D.W.L.B.T.B.J. Validation of the World Food Programme’s Food Consumption Score and Alternative Indicators of House-
hold Food Security. International Food Policy Research Institute Washington, D.C, June 2009.
45. Hadgu, T. H., Worku, W., Tetemke, D. & Berhe, H. Undernutrition among HIV positive women in Humera hospital, Tigray,
Ethiopia, 2013: Antiretroviral therapy alone is not enough, cross sectional study. BMC Public Health 13, 943 (2013).
46. Ali, F., Thaver, I. & Khan, S. A. Assessment of dietary diversity and nutritional status of pregnant women in Islamabad, Pakistan.
J. Ayub. Med. Coll. Abbottabad 26(4), 506–509 (2014).
47. Maila, G., Audain, K. & Marinda, P. A. Association between dietary diversity, health and nutritional status of older persons in rural
Zambia. South Afr. J. Clin. Nutr. 34(1), 34–39 (2021).
Scientific Reports | (2021) 11:18681 | https://doi.org/10.1038/s41598-021-98202-6 8
Vol:.(1234567890)www.nature.com/scientificreports/
48. Jayawardena, R. et al. High dietary diversity is associated with obesity in Sri Lankan adults: An evaluation of three dietary scores.
BMC Public Health 13, 314 (2013).
49. Mirmiran, P., Azadbakht, L., Esmaillzadeh, A. & Azizi, F. Dietary diversity score in adolescents—A good indicator of the nutritional
adequacy of diets: Tehran lipid and glucose study. Asia Pac. J. Clin. Nutr. 13(1), 56–60 (2004).
50. Rathnayake, K. M., Madushani, P. A. E. & Silva, K. D. R. R. Use of dietary diversity score as a proxy indicator of nutrient adequacy
of rural elderly people in Sri Lanka. BMC Res. Notes 5, 469 (2012).
51. Bulungu, A. L. et al. Validation of a life-logging wearable camera method and the 24-h diet recall method for assessing maternal
and child dietary diversity. Br. J. Nutr. 125(11), 1299–1309 (2021).
52. Gómez, G. et al. Dietary diversity and micronutrients adequacy in women of childbearing age: Results from ELANS study. Nutrients
12(7), 1994 (2020).
53. Diop, L. et al. Standard minimum dietary diversity indicators for women or infants and young children are good predictors of
adequate micronutrient intakes in 24–59-month-old children and their nonpregnant nonbreastfeeding mothers in rural Burkina
Faso. J. Nutr. 151(2), 412–422 (2020).
54. Tavakoli, S. et al. Is dietary diversity a proxy measurement of nutrient adequacy in Iranian elderly women?. Appetite 105, 468–476
(2016).
55. Group, W.S.D.D.P.S. Development of a dichotomous indicator for population-level assessment of dietary diversity in women of
reproductive age. Curr. Dev. Nutr. 1(12), cdn.117.001701 (2017).
56. FAO. Minimum Dietary Diversity for Women 176 (FAO, 2021).
Acknowledgements
We would like to thank all staff members of ART clinics in Bahir Dar, Bahir Dar health office, and municipality
for their unlimited support and for giving the required information. Finally, we want to express our gratitude to
all subjects included in the study for their willingness to participate.
Author contributions
F.M.H. designed the study, collected the data including the analysis, and drafted the manuscript. Other authors
contributed to data interpretation validation, reviewing, editing, and write up of the manuscript. All authors
read, critically revised, and approved the final manuscript.
Funding
The fund was obtained from Wollo University.
Competing interests
The authors declare no competing interests.
Additional information
Correspondence and requests for materials should be addressed to F.M.H.
Reprints and permissions information is available at www.nature.com/reprints.
Publisher’s note Springer Nature remains neutral with regard to jurisdictional claims in published maps and
institutional affiliations.
Open Access This article is licensed under a Creative Commons Attribution 4.0 International
License, which permits use, sharing, adaptation, distribution and reproduction in any medium or
format, as long as you give appropriate credit to the original author(s) and the source, provide a link to the
Creative Commons licence, and indicate if changes were made. The images or other third party material in this
article are included in the article’s Creative Commons licence, unless indicated otherwise in a credit line to the
material. If material is not included in the article’s Creative Commons licence and your intended use is not
permitted by statutory regulation or exceeds the permitted use, you will need to obtain permission directly from
the copyright holder. To view a copy of this licence, visit http://creativecommons.org/licenses/by/4.0/.
© The Author(s) 2021
Scientific Reports | (2021) 11:18681 | https://doi.org/10.1038/s41598-021-98202-6 9
Vol.:(0123456789)You can also read