Usability Evaluation: Smartphone Version versus Desktop Version of Spotify
←
→
Page content transcription
If your browser does not render page correctly, please read the page content below
DH2408, Fall 2012, Period 2 Assignment 5 Final Report 20121212
Usability Evaluation: Smartphone Version
versus Desktop Version of Spotify
Assignment 5 Final Report
Group 6
Zhenyu Lin zhenyul@kth.se 901207T214
Mona Salmani salmani@kth.se 8609189769
Manfred Micaux manfred@kth.se 8201040337
1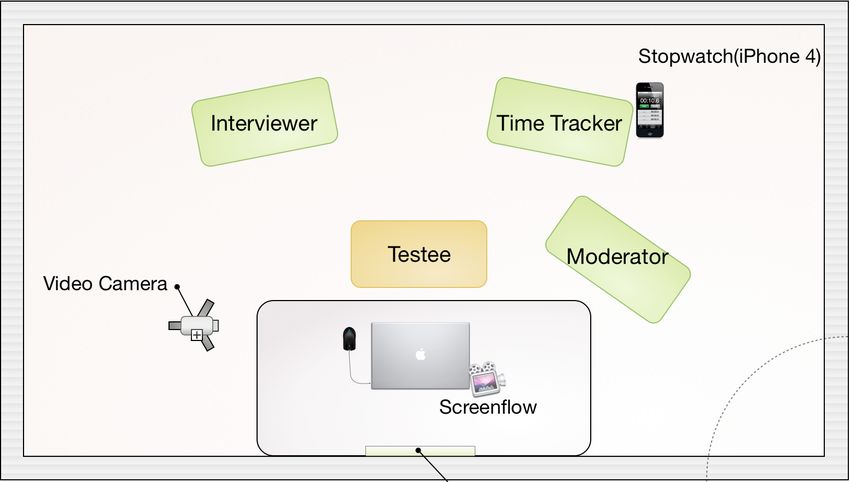
DH2408, Fall 2012, Period 2 Assignment 5 Final Report 20121212
Abstract
This report describes a usability evaluation study of the efficiency of playlist related functions of
the streaming music application Spotify. The study involves a controlled experiment where two
versions of this application, the smartphone version and the desktop version are tested in two
groups of testees.
The study evaluates efficiency of playlist related functions of the two versions of Spotify by both
measured efficiency and perceived efficiency, and draw the conclusions by the triangulations of
those quantitative data and qualitative data. Recommendations will be given to the developer team
based on the findings.
The quantitative data, from measuring the time to complete a set of tasks in the controlled
experiment, is complemented by video recordings, screen captures and an interview to provide an
additional qualitative dimension.
The triangulated qualitative and quantitative data gives a result that show differences in efficiency.
Overall the users found both versions of the application easy to use, however there are some
improvements to be made. The study includes recommendations to a fictive product development
team. The recommendations are as follows: For the smartphone version it is urgent to improve the
usability of how to remove a song from a playlist. For the desktop version it is urgent to improve
the usability of sharing a playlist, but this is less urgent than the smartphone version issue.
A note to the reader: The study is performed solely for academic purposes and the company
Spotify is not involved in the study.
2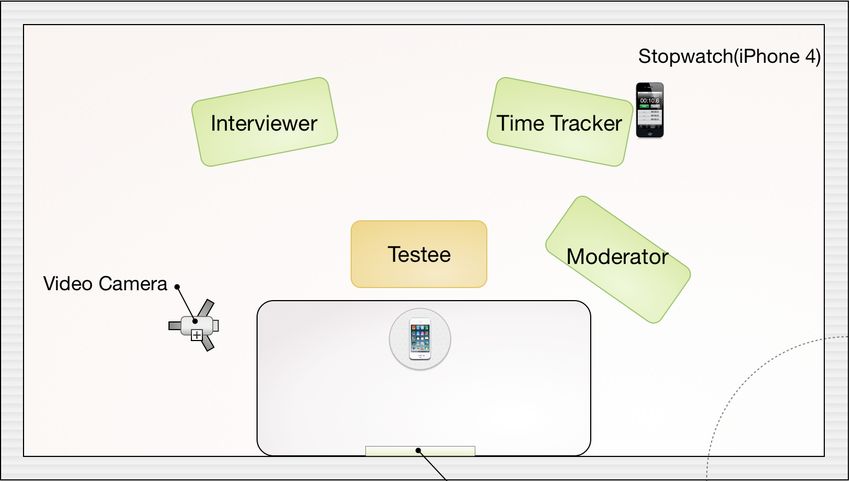
DH2408, Fall 2012, Period 2 Assignment 5 Final Report 20121212
Table of Contents
Abstract
Table of Contents
Introduction
Description of the evaluation artefact, the user context
Target Group
Research Questions
Purpose
Literature Review
Method
Evaluation Method
Evaluation Criteria
Independent and Dependent Variables
Sampling Method
Sampling Process
Test Design
Test Design Draft and Pilot Test
Final test design Controlled Experiment Environment Setup
Roles of Evaluators during the Test
Moderator
Time Tracker
Greeter and interviewer
Procedure
Pretest arrangements
Greeting the testee
Test
Regarding the semistructured gradual prompting
Test formulation and interview questions
3
DH2408, Fall 2012, Period 2 Assignment 5 Final Report 20121212
Data Collection
Data Analysis
Quantitative Analysis
Qualitative Analysis
Results
Important Findings
Sampling Result
Quantitative Result Measured Efficiency
BetweenGroup Efficiency Comparisons of Each Task
BetweenGroup Comparison of Overall Efficiency of All Tasks
Qualitative Result Perceived Efficiency
Perceived Efficiency
Summary of Interview Findings
Triangulation Perceived vs Measured Efficiency
Red light system triangulation according to urgency to change
Problem Analysis
Conclusions
Recommendations
Overall Change the Attitude to Smartphone Version Interface Design
Song Removal Function on the smartphone version
Playlist Sharing Function on the Desktop Version
Discussion
Quality assurance
Strengths and Weaknesses with the study
Strengths
Weaknesses
Deviations
Lack of Lab Network Support for Airserver
Controlled Experiment and Lab Context vs. “Natural” Context
Semistructured gradual prompting and assistance from the Moderator
Platform Difference and User Habit
4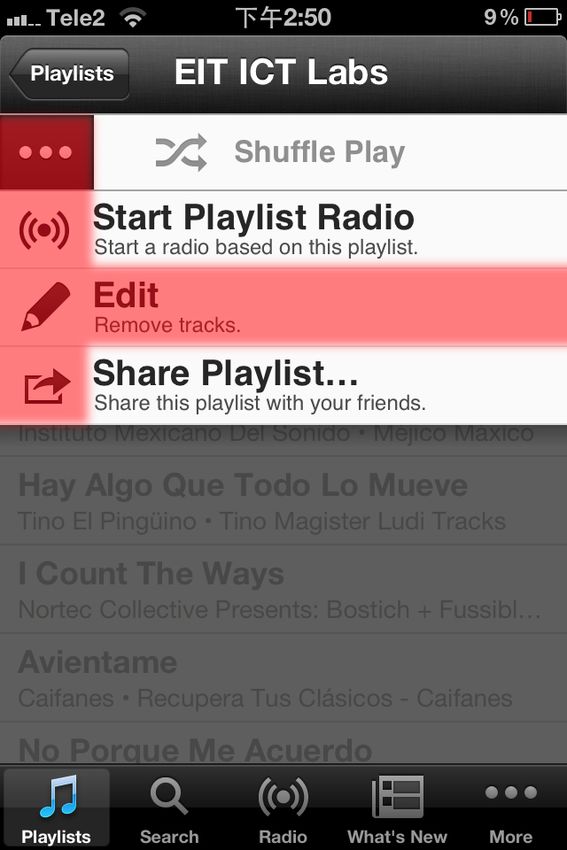
DH2408, Fall 2012, Period 2 Assignment 5 Final Report 20121212
Discussion on the selected method
Further research
References
Appendixes
Appendix I Invitation email
Appendix II Information sheet
Appendix III Informed Consent Form
Appendix IV Test formulation
Appendix V Interview: User’s Background
Smartphone
Desktop
Appendix VI Smartphone Users Interview: Former Experience of Spotify and the users
perception
Appendix VII Desktop Users Interview: Former Experience of Spotify and the users
perception
Appendix VIII Oneway Anova Comparison Results of Task 1,2,5,6
5
DH2408, Fall 2012, Period 2 Assignment 5 Final Report 20121212
Introduction
Description of the evaluation artefact, the user context
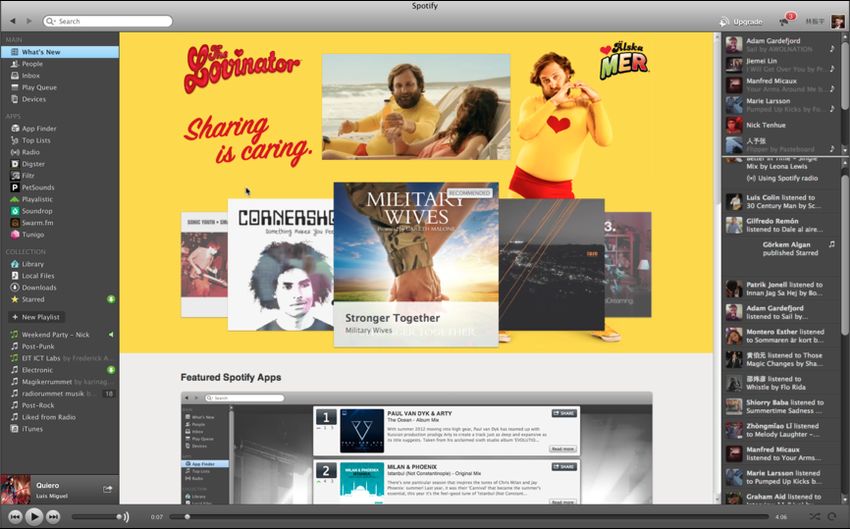
The evaluation artefact[1] in this study is the music as service[2] application, Spotify. The study
will consist of a between group comparison[1] using two different versions of the Spotify
application; on desktop[3](Free subscription, version 0.8.5.1333) and on smartphone[4](Premium
Subscription,version 0.5.9.10).
Pic 1 Screenshots of the two tested versions of Spotify
The desktop and the smartphone versions offer very different ways of presentation and interaction,
according to different affordances[5] and levels of mobility. Under different circumstances, users
will have different demands and behaviors. These parameters will be taken into account in the
evaluation process.
The chosen usability objective of this study is the performance criteria efficiency[6] applied to the
playlist function of the two versions of the application. Efficiency is somewhat of a subjective term
and to try to cover more than the measurable efficiency, information on the users perceived(or
experienced) efficiency will be collected.
6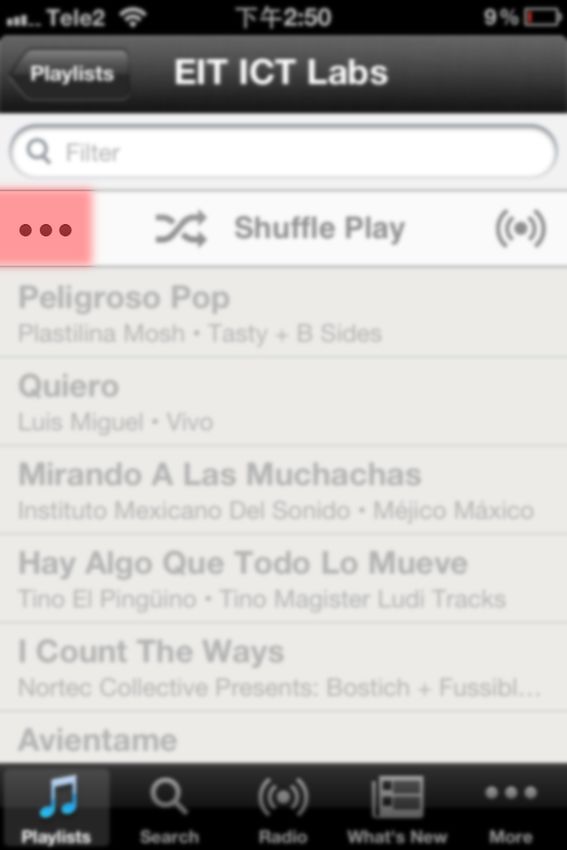
DH2408, Fall 2012, Period 2 Assignment 5 Final Report 20121212
The user context is a temporary lab environment to limit the amount of dependent variables.
Pilottesting is performed in a more “natural” environment out on the field to gain insights into the
“natural habitat” of our users and how doing the test in a lab might affect the result.
Target Group
Potential users of a music as a service application in the age between 20 and 45 years of age.
Research Questions
Are there any differences in efficiency when interacting with the desktop version comparing with
the smartphone version of Spotify, regarding the playlist related functions? How does the different
affordances[5] of different interfaces and devices affect the efficiency?
Purpose
The purpose: The evaluation will encompass different ways of interacting with the same
application, to gain more insight into users’ behaviour when using the playlist function on different
versions of the same application(Spotify).
The goal: Investigating if time spent on each specified task differs between a desktop and a
smartphone version of Spotify and also what tasks were perceived most and least time consuming
to compare measured and perceived efficiency.
The objective: The aim is to provide insight to which of the interfaces is more efficient for using
the playlist feature, or parts of it, and see what pro’s and con’s there are and how the development
team for each individual application interface can prioritize usability recommendations and benefit
from using design from the other team.
Literature Review
Literature review consists of usability and usability evaluation methods by Norman[5], Benyon[7]
and Rubin & Chisnell [8], as well as reviewing of terminology relevant to the study in PC
Magazine Encyclopedia [3][4]. Other elements of the review include reading a related paper from
Doerr, Jonathan et al. [9] as well as justifying the use of controlled experiment[7][10] as a method.
7
DH2408, Fall 2012, Period 2 Assignment 5 Final Report 20121212
Method
Evaluation Method
Participantbased evaluation method[7], controlled experiment[10], is chosen to do the evaluation.
A between group comparison[8] is used in the controlled experiment. Userparticipant evaluation is
done through observing and recording the users working with Spotify both on the smartphone
version and the desktop version. To support the collected quantitative data, interviews will be
arranged with the users to get some sort of additional qualitative data perspective. All the material
collected will be triangulated[11], using methodological triangulation[11], and analysed. Since the
research team is quite new to the field of investigation the bottomup research approach inductive
reasoning[12] is used to explore the topic instead of formulating a readymade hypothesis.
Evaluation Criteria
In this survey, the efficiency of the two different Spotify interfaces were evaluated. The term
efficiency includes both measured efficiency and perceived efficiency. By using a stop clock
during the test process, the time that each user spent on a set of tasks is measured, this is defined as
the measured efficiency[13] in this study. The user also has feeling about how much time is spent
on each task and this is defined as the perceived efficiency[14] in this study. Depending of the
nature of the task, these two definitions complement one another when analyzing the result, since a
task that is measured to be time consuming and therefore could be deemed less efficient, can still be
perceived efficient by the user.
Independent and Dependent Variables
The ambition is to keep as many variables as possible fixed and have the Spotify
applications(Desktop and Smartphone Application of Spotify) as the independent variables in
order to evaluate the dependent variable which is time –spent(both the measured time spent on
each task and the perceived time consumption for performing each task).
8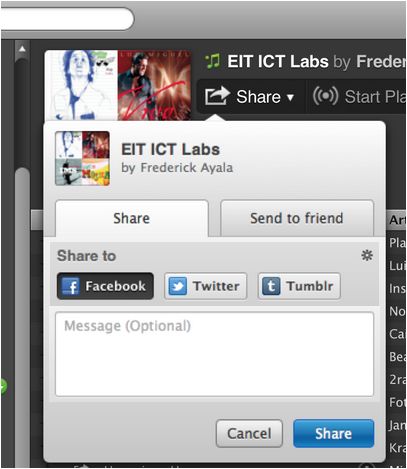
DH2408, Fall 2012, Period 2 Assignment 5 Final Report 20121212
Sampling Method
If the users have former experience in using Spotify on desktop version or smartphone version, that
factor might affect their performances on those interfaces. Furthermore, the desktop version
interfaces of Spotify on Windows and MacOS can be regarded as the same, while the smartphone
version interfaces have great differences between the iOS version and the Android version. So
there’s an extra factor affecting the users’ performances on the smartphone version interface if the
users have former experience in using an iPhone or not.
To counteract these factors, first, the population is segmented into two groups of former Spotify
users and nonformer Spotify users. Because of the tight budget and short time for this research, the
sample size can’t be large, thus it is hard to achieve the representative proportion of each segment
of the population. Therefore, a nonprobability sampling method named Quota Sampling[15] is
chosen to guarantee the inclusion of all the related segments and the control of the proportion. The
inclusion of all the segments help to eliminate the bias of sampling. The reason to have the same
proportion of each segment in different groups, is to control independent variables other than the
different versions of the interfaces affecting the efficiency performance of the interfaces. The frame
of sampling is shown in Table 1 below.
Former Spotify Users Not Former Spotify Users
Desktop Version 3 2
Smartphone Version 4 4
Sub Quota of Smartphone Version 2 are iOS users, 2 are not iOS users 2 are iOS users, 2 are not iOS users
Table 1 The Frame of Sampling
9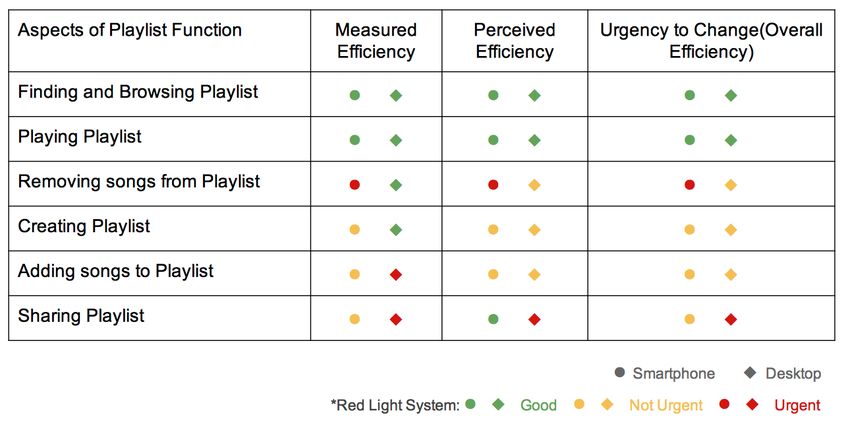
DH2408, Fall 2012, Period 2 Assignment 5 Final Report 20121212
Sampling Process
First, about 100 invitation emails[Appendix I] are sent to a randomized potential user group. In the
invitation email, there is a link to a doodle where the users can sign up for a suitable time(on a set
date) and include the basic information if they have former experience in using Spotify or not. If
this sampling is not successful, hallway sampling[16] will be used.
The age of the sought for users span from 20 to 45 years old. In the process, potential users are
asked to join without trying to make any previous selection based on any other criteria than
perceived ages, but then they are selected eligible or not according to the proportion set for each
segment based on the frame of sampling.
Test Design
Test Design Draft and Pilot Test
The pilot test is conducted before the real test. Two users perform the pilot testing on the
smartphone version, and two users on the desktop version. They follow a draft of the test process.
The test process is then revised and the role of each evaluator is further specified after the pilot test.
Final test design Controlled Experiment Environment Setup
Both the test of the desktop version and the smartphone version is conducted in the same
laboratory environment. The test is conducted indoor in a closed room, with a desk and office
chairs. The environment and evaluators positions are designed as shown in picture 2 and 3 below.
Two of the three evaluators sit behind the testee(user), and keep silent during the whole test, not to
distract the user. The moderator sits next to the user in a semibehind position, trying not to distract
the testee.
10DH2408, Fall 2012, Period 2 Assignment 5 Final Report 20121212
Pic 2 The Test Environment Design for the Desktop Version Test
Pic 3 The Test Environment Design for the Smartphone Version Test
The devices to run the tested versions of the application on are chosen as follows. A MacBook Pro
Laptop with keyboard, touchpad and an external mouse is used as the device for the desktop
version test. Iphone 4S smartphone is used as the device for the smartphone version test.
11DH2408, Fall 2012, Period 2 Assignment 5 Final Report 20121212
Roles of Evaluators during the Test
Moderator
The test moderator starts with the introduction of the scenario and tasks. Assist the user if needed
during the test by answering questions and gradually prompting hints so that the user can succeed
and proceed to the next task if the user is not able to complete a task in a reasonable amount of
time. The moderator will also observe the users’ behavior during test and take down notes directly
afterwards. The moderator is responsible for setting up and monitoring the video recording as well.
Time Tracker
The time tracker primarily focuses on measuring the efficiency of the interface by using a stop
clock and a sheet to jot down the time each user spend on each function. This is a task that
demands a high level of focus and therefore this user doesn’t have any obligations to perform other
tasks than to start the screen capturing for the desktop users.
Greeter and interviewer
Performs hallway sampling and greets the participant welcome to the test while bringing him/her to
the lab. During the test this person observes and after the test he/she performs the posttest
interview and guides the user to the exit of the lab.
Procedure
Pretest arrangements
1) Users fill out the doodle with background information and prefered time to perform the test OR
are being hallway sampled
2) Evaluators check eligibility and place the user in a test group according to the time schedule
request
3) Eligible users receive, review information sheet[Appendix II] and sign informed consent
forms[Appendix III]
12DH2408, Fall 2012, Period 2 Assignment 5 Final Report 20121212
Greeting the testee
Test
1) Introduction to the test 5 min(by Moderator)
2a) Performing tasks 1020 min(Time Tracker measures the task time)
2b) Semistructured gradual prompting of hints to complete task (due to time constraints). See more
info under “Regarding the semistructured gradual prompting” below.
Posttest Interview followup
4) Followup interview and debrief 5 min(by Interviewer)
Regarding the semistructured gradual prompting
The testee gradually received hints to complete the task since the time slot for each testee was
limited. The moderator usually prompted the hints in the following way and order:
General hints: “take your time”, “maybe you can push different things in the interface”, “maybe
there is a button somewhere”, “maybe there is something that doesn't look like a button that is
actually a button”, “it’s getting hotter” or “it’s getting cooler” (assuming that hotter is understood as
closer to the target).
Specific hints: “do you see the “...”?”, “do you see the “+”?
The moderator tried to prompt the hints at approximately the same amount of time, first letting the
user try on her/his own.
13DH2408, Fall 2012, Period 2 Assignment 5 Final Report 20121212
Test formulation and interview questions
Excerpt from test formulation (above) and all postinterview questions(below)
The full test formulation can be found in the Appendices section, in Appendix IV.
The interview notes can be found in Appendices V, VI.
14DH2408, Fall 2012, Period 2 Assignment 5 Final Report 20121212
Data Collection
According to the short time frame and lack of resources in terms of money for this usability
evaluation project, lowtech data collection method is used:
● Time Consumption Measurement by stopwatch during the test.
While the moderator is guiding the user through the test, he/she will give pronounce a
signal sentence to the time tracker for starting and stopping the time measurement for each
task. For example, he/she will read the content of each task and say “Now you can start.”
to the user and the time tracker, and say “Now you are done with the task.” to give
feedback to the user in time and give signal to time tracker as well.
● Posttest Interview on users’ characteristics and perceived time consumption
● Observation will be done by both the moderator and the time tracker
The results will be noted down immediately after the test is done.
● Video Recording of the users hands and parts of the devices is done for all the tasks
performed for further analysis and review in the qualitative analysis. For the desktop
version, screen capture software Screenflow is used to record: the user's activity on the
screen, internal audio from the computer, as well as external audio and video of the user
using the front camera and microphone. For smartphone version, the users’ interaction with
the interface and the related sound is to some extent recorded by a video camera.
Data Analysis
Since inductive reasoning is applied in this study a mixed quantitative and qualitative research
approach suited both the collection and the analysis of the data. Adopting this triangulationbased
approach enables a crossvalidation of the results. Analysing both measured data and perceived
emotions is useful when evaluating usability since it humancomputer interaction is a
crossdisciplinary field.
Quantitative Analysis
The time consumption on each task is measured by stopwatch during the test and transcribed in a
sheet to note down the time measurements. The data is then analysed by comparing the differences
15DH2408, Fall 2012, Period 2 Assignment 5 Final Report 20121212
between the groups through diagrams and tables.
Qualitative Analysis
To collect data for the qualitative study, semistructured interviews are conducted with all
participants after the test.
The questions are created based on the data seemingly required to add a perspective to the study as
well as allowing for the correct sampling. Examples include: data about the user’s
background(Appendix V), former experience of Spotify and other music application, and open
ended questions to collect data about the users perception of “Which task did you feel was the least
time consuming one to complete?” and “Which task did you feel was the most time consuming to
complete?”(Appendix VI and VII). To make sense of the collected data, it is interpreted by using
such techniques as transcribing and categorizing in an Excel sheet.
Reviewing of the videos, screen captures and answers from the interviews will also be done, in
order to make the main data(measured and perceived efficiency) easier to analyses and to make
better recommendations to the product development team.
Triangulation
A traffic(red) light metaphor is used to describe the urgency of the triangulated quantitative results
and qualitative results.
Results
Important Findings
The result shows there are not any statistically significant differences in measured efficiency
between the desktop and the smartphone version of Spotify. However looking at some individual
task there are differences between the two interfaces as well as between perceived and measured
efficiency within each version. The result that stands out the most is that removing a song is very
time consuming and is also perceived very time consuming on the smartphone version but not on
the desktop version.
16DH2408, Fall 2012, Period 2 Assignment 5 Final Report 20121212
Sampling Result
Before the day of the test, only 2 users signed up on the doodle. Then hallway sampling is
conducted in the area of Kista. Finally 8 users are elected to test the smartphone version of Spotify,
and 5 users to test the desktop version of Spotify. Besides, the data from the User B on smartphone
version is abandoned for accidental errors in setting up the test, this user is not counted in the 8
users on the smartphone version test.
Quantitative Result Measured Efficiency
BetweenGroup Efficiency Comparisons of Each Task
Pic 4 Betweengroup Comparison on Each Task
Generally, the comparisons of mean values of time consumption on each task, shown in Pic 4,
indicate that it takes approximately equal amount of time to finish Task 1,2,5,6, regardless if a user
is performing the task on the smartphone version or on the desktop version of Spotify. Moreover,
the oneway Anova comparisons of time consumption data of each task support the results that
there are no significant statistical differences in the time consumption of performing Task 1,2,5,6
17DH2408, Fall 2012, Period 2 Assignment 5 Final Report 20121212
on both versions. All the results of those oneway Anova comparisons are put in Appendix VIII.
Besides, the results show that for completing Task 1,2,6, the smartphone version is a little bit more
efficient than the desktop version..
On the other hand, the time consumptions of finishing Task 3,4 on the smartphone version is over
2 times more than those on the desktop version (shown in Pic 4), showing that it is not so efficient
to do Task 3,4 on the smartphone version of Spotify as on the desktop version of Spotify,
especially Task 3. The oneway Anova comparison of the data of the two groups finishing Task 3
shows that in Task 3 there’s significant statistical difference between the two groups, with a
significance index of 0.015, shown in Pic 5. However, the oneway Anova comparison of data on
Task 4 shows that in spite of the significant difference shown in mean value comparison, there’s no
significant statistical difference between the two groups in finishing Task 4, with a significance
index of 0.110, shown in Pic 6.
Pic 5 Oneway Anova Comparison Result of Two Groups on Task 3
Pic 6 Oneway Anova Comparison Result of Two Groups on Task 4
18DH2408, Fall 2012, Period 2 Assignment 5 Final Report 20121212
BetweenGroup Comparison of Overall Efficiency of All Tasks
Pic 7 Result of Oneway Anova Comparison of Mean Values of Time Consumption of Each Task
The results of Oneway Anova Comparison of mean values of time consumption of all tasks show
that there’s no statistically significant difference between the users’ performances on efficiency on
the two versions of Spotify, since the significance index is 0.244, much higher than 0.05. In spite
of different efficiency in performing Task 3,4, the overall efficiency of playlist related functions on
the smartphone and the desktop version of Spotify are on the same level. Overall, the differences of
affordance of the two device platforms don't affect the efficiency of the interface significantly.
19DH2408, Fall 2012, Period 2 Assignment 5 Final Report 20121212
Qualitative Result Perceived Efficiency
Perceived Efficiency
Pic 8 Statistic of Perceived Most and Least Time Consuming Tasks
The qualitative results gathered from the interview questions about the perceived efficiency are
summarised in the bar charts above(pic 9). It shows that the differences of perceived efficiency
between the desktop version and the smartphone version are noticeable, especially in the perceived
most time consuming task bar chart. The desktop users think that Task 6 is the most time
consuming, i.e. not efficient, while the smartphone version users perceive Task 3 as the least
efficient. This is majorly caused by different design of the two versions of the interfaces. There are
some design flaws for functions related to task 3 for the smartphone version.
Summary of Interview Findings
Working with the desktop version of Spotify doesn’t seem to be perceived as hard in general,
because the users said it was easy to follow and complete the tasks, and that there was enough
visual information on how to interact with the application to perform their desired tasks.
In the desktop user group, the only task that was a little bit confusing in terms of how it was
formulated was “find and add three songs to the playlist you just created”, many of the users asked
about this and some seemed to interpret it as “finding their favorite music”. Users did however not
20DH2408, Fall 2012, Period 2 Assignment 5 Final Report 20121212
experience this task as time consuming. The difference between the share and the send to a friend
tabs should be more clear.
In the smartphone user group, there were many comments and recommendations which present a
number of problems they had during the test. The difference between the share and the send to a
friend tabs should be more clear. The users did not understand the functions of some buttons. The
“Edit” function was confusing. The button “i” signalling an Info button includes many useful
features other than more info. 3 dots was not understood as a button or more menu, even among
iPhone users.
Triangulation Perceived vs Measured Efficiency
Pic 10 Triangulation of the results by Red Light System
Red light system triangulation according to urgency to change
Using the red light system, the results are triangulated into the level of urgency to change the
specific part involved with completing a task. The final results show that the song removing
function in smartphone version and playlist sharing function in desktop version are really not
efficient, and urgent to change.
21DH2408, Fall 2012, Period 2 Assignment 5 Final Report 20121212
Problem Analysis
Task 3 takes significantly longer time to be completed on the smartphone version of Spotify,
because of the poor visibility of this function. The button of the remove function is hidden in the
second level of the menu, under the name of “edit”(shown in the right of Pic 11), which is not a
enough clear description of the function. Moreover, the button to open the menu lacks obvious
understandability as well(shown in the left of Pic 11). It has really vague understandability of the
indication for its functions with three dots. This button does not provide necessary clues to the user
about it’s functionality. And it lies in a row with the text “Shuffle Play”, and leads to the
misperception that it is descriptive text rather than a button. The indication of the function of the
“more” button largely relies on the related context it gets in the interface. Besides the vague
indication of function, there’s no line or light and shade to show the area of the three dots is
pressable, which lacks the affordance of a button.
Pic 11 Problem of Song Removal Function on the smartphone version
22DH2408, Fall 2012, Period 2 Assignment 5 Final Report 20121212
Conclusions
Overall, the efficiency of performing playlist functions on both the smartphone version and the
desktop version doesn’t have significant difference. The different affordances of the devices
doesn’t affect the efficiency of the function significantly.
The efficiency of performing some particular function related to playlist are different on the
smartphone version and the desktop version. The quantitative results show that there are
differences in measured efficiency when users perform the song removal function on the
smartphone and desktop versions of Spotify. The qualitative results show that there are differences
in perceived efficiency of the tasks as well. The song removal function is perceived as the most
time consuming while in the desktop version it is quite good and that the playlist sharing function
in the desktop version is urgent to change but in the smartphone version it’s manageable.
In most of the tasks, the perceived efficiency presents quite the same results as the measured
efficiency but in some cases the results are different. This gets more obvious in task 5, “Find and
add 3 songs to the playlist”, in the desktop version test this is not perceived that time consuming
even though it was, probably due to the nature of the task or how the task was formulated.
The different affordances of these interfaces affect the efficiency; therefore some recommendations
for future development will be presented in the following section in detail. To conclude the product
development team can prioritize to improve the usability of the functions involved in removing a
song from a playlist in the smartphone version and sharing a playlist in the desktop version.
23DH2408, Fall 2012, Period 2 Assignment 5 Final Report 20121212
Recommendations
Overall Change the Attitude to Smartphone Version Interface Design
Based on the findings from the quantitative results that the affordances of different devices don’t
affect the overall efficiency of the playlist related functions significantly, it is important for the
designers to take the smartphone version interface design as serious as the desktop version. All the
functions on the smartphone version can be as efficient as the desktop version by using better
design.
Song Removal Function on the smartphone version
To improve the efficiency of the song removal function on the smartphone, the most important
thing is to improve the visibility of the function. In Pic 11 is an example that puts the function
button on the first level and cuts down all the repetitions of the same functions in one interface.
Pic 11 Illustrative Example of Improvement of Song Removal Interface
24DH2408, Fall 2012, Period 2 Assignment 5 Final Report 20121212
Playlist Sharing Function on the Desktop Version
To improve the efficiency of the playlist sharing function, it is important to improve the visibility of
the function according to the right task structure. In Pic 12, it is an example to improve the visibility
to reduce the confusion when users performing this function. The sharing options should be above
the “message”, which is an earlier user decision in the task structure than editing the message. The
text description of the function in the interface can be even clearer, using “share the playlist to”
rather than “share to”, “share to friend” rather than “send to friend”.
Pic 12 Illustrative Example of Improvement of Playlist Sharing Interface
25DH2408, Fall 2012, Period 2 Assignment 5 Final Report 20121212
Discussion
Quality assurance
Validity [17]
The authors set out to study if there were any differences in efficiency when interacting with the
desktop version in comparing with the smartphone version of Spotify, regarding the playlist related
functions, and how the different affordances of these interfaces affect the efficiency. In this light it
must be seen as the authors have managed to perform a study that is clearly reflecting the topic that
was supposed to be studied.
Reliability[18]
The artefacts involved in this study, the two different versions of the Spotify application, are pretty
volatile. New versions will be released and old ones will be discontinued. So the results from this
small crosssectional study won’t be reproducible at any given moment. However the methods
used in this study could probably be applied successfully to determine the efficiency of newer
versions of Spotify. In the coming sections some strengths and weaknesses as well as deviations
are discussed for the reader gain an additional perspective on the reliability of the study.
Strengths and Weaknesses with the study
Strengths
Firstly, the study encompassed both perceived and measured efficiency. Secondly, the evaluators
had clearly defined roles during the whole process and especially during the testing. Finally, the
tailored lab provided a very controlled environment.
Weaknesses
The weaknesses include having a small sample size, not being able to screen record the
smartphone version tests and that the study was not done in a “natural” environment.
26DH2408, Fall 2012, Period 2 Assignment 5 Final Report 20121212
Deviations
Lack of Lab Network Support for Airserver
At the time of our test the ITsupport at KTH didn’t allow the application Airserver to be used on
their network. This meant that the image from the iPhone couldn’t be sent to a MacBook for screen
capturing of the testees activities during the iPhone version test. This meant that only the desktop
version tests had screen captures associated with them and the amount of information was greater
for each the desktop testee. To counteract this video recording of the user's hand movements and
parts of the interface was used but this is a lot harder to analyse on the smartphone since the hand
or hands that hold the device often block the interactions with the interface. To counteract this two
video cameras could have been used from different angles but that is time and resource consuming.
Controlled Experiment and Lab Context vs. “Natural” Context
The use of a controlled experiment in a lab context instead of doing a field study in a more natural
context could have affected the result of the study. However it is harder to perform controlled
measurements in the field and it is hard to define what truly is a natural environments for using a
smartphone and a laptop computer (with the desktop application) since both devices are more or
less mobile devices that can be used in a huge amount of contexts.
Semistructured gradual prompting and assistance from the Moderator
The gradual prompting of hints was done in a semistructured way and that may have affected the
measured time, because the testees didn’t get the same information at the exact same point in time
when performing the tasks. So the measured time should more be viewed as an indication than the
actual time to perform these tasks. An improvement could be to prompt hints in a more structured
way, for example at the exact same points in time and also script the hints to increase the likelihood
that they are pronounced in the same way.
Platform Difference and User Habit
Users habits and experience of different hardware and software might have affected the result.
Smartphone devices using iOS or Android operating systems are a bit different in terms of
27DH2408, Fall 2012, Period 2 Assignment 5 Final Report 20121212
hardware buttons and gestures to perform certain interactions. As described before the sampling
was done to counteract the influence of this and to have a diverse group as possible.
Discussion on the selected method
According to Benyon "…there can be no substitute for involving some real people in the
evaluation."[7] therefore participantbased evaluation method is chosen. To narrow it down even
further the evaluation method controlled experiment is used.
One Definition of controlled experiment: “A scientific investigation in which both the control
group and experimental group(s) are kept under similar variables apart from the factor under study
so that the effect or influence of that factor can be identified or determined.”[10]. The controlled
experiment setup may allow measurement of the dependent variable (time spent) with less
interference from disturbances in the surrounding, since the context is the same and it is stripped of
other user input than the ones from the system.
Another reason to select this method is that the goal is to compare the desktop and smartphone
versions of the Spotify application. A controlled experiment is suitable for evaluating “...particular
features of a design, perhaps comparing one design to another to see which is better.” [7]
Two other contextual aspects that can be furthered discussed, is that the users will be using the
same device within each group and that the “true” mobility aspects wouldn’t be measured in a lab.
To counteract this the pilottesting is done in a more "natural habitat".
Further research
Suggestions for further research includes looking deeper into the efficiency of the social features of
Spotify.
28DH2408, Fall 2012, Period 2 Assignment 5 Final Report 20121212
References
[1] Rubin, Jeff. Chisnell, Dana., Handbook of Usability Testing, Second Edition, 2008, Wiley
Publishing, Inc. Indianapolis, USA, ISBN: 9780470185483
[2] Doerr, Jonathan. Benlian, Alexander. Vetter, Johannes. Hess, Thomas., Pricing of Content
Services – An Empirical Investigation of Music as a Service,
Available:
http://dx.doi.org/10.1007/9783642151415_2
Accessed on: 2012/10/30
[3] PC Magazine Encyclopedia, Desktop Application,
Available:
http://www.pcmag.com/encyclopedia_term/0,1237,t=desktop+application&i=41158,00.asp
Accessed on: 2012/10/30
[4] PC Magazine Encyclopedia, Smartphone,
Available:
http://www.pcmag.com/encyclopedia_term/0,2542,t=Smartphone&i=51537,00.asp
Accessed on: 2012/10/30
[5] Norman, Donald, Design of Everyday Things, Currency Doubleday, 1998, ISBN
0262640376
[6] Rubin, Jeff. Chisnell, Dana., Handbook of Usability Testing, p.36, Second Edition, 2008,
Wiley Publishing, Inc. Indianapolis, USA, ISBN: 9780470185483
[7] David Benyon, Designing Interactive Systems, Second Edition, Addison Wesley,
2010, Chapter 10.3, ISBN: 9780321435330
[8] Rubin, Jeff. Chisnell, Dana., Handbook of Usability Testing, Second Edition, 2008, Wiley
Publishing, Inc. Indianapolis, USA, ISBN: 9780470185483
[9] Doerr, Jonathan. Benlian, Alexander. Vetter, Johannes. Hess, Thomas., Pricing of Content
Services – An Empirical Investigation of Music as a Service,
Available: http://dx.doi.org/10.1007/9783642151415_2
Accessed on: 2012/10/30
[10] Biology online, Controlled Experiment,
29DH2408, Fall 2012, Period 2 Assignment 5 Final Report 20121212
Available at: http://www.biologyonline.org/dictionary/Controlled_experiment
Accessed: 2012/11/02
[11] Guion, Lisa A. , Diehl, David C., and McDonald, Debra., ”Triangulation: Establishing the
Validity of Qualitative Studies”, Department of Family, Youth and Community Sciences, Florida
Cooperative Extension Service, Institute of Food and Agricultural Sciences, University of Florida
Available: http://edis.ifas.ufl.edu/pdffiles/FY/FY39400.pdf
Accessed on: 20121210
[12] Wallén, Göran. (1996), “Vetenskapsteori och forskningsmetodik”, 2:13 Edition,
Studentlitteratur, Sweden.
[13] Rubin, Jeff. Chisnell, Dana., “Measured efficiency”, Handbook of Usability Testing, p.72.,
Second Edition, 2008, Wiley Publishing, Inc. Indianapolis, USA, ISBN: 9780470185483
[14] Rubin, Jeff. Chisnell, Dana., “Perceived efficiency”, Handbook of Usability Testing, p.36.
Second Edition, 2008, Wiley Publishing, Inc. Indianapolis, USA, ISBN: 9780470185483
[15] UC Davis Psychology, Sampling: Types of Samples, Available at:
http://psychology.ucdavis.edu/sommerb/sommerdemo/sampling/types.htm
Accessed: 2012/11/27
[16] Template Monster, “Hallway testing or Hall Intercept Testing”,
Available: http://blog.templatemonster.com/2011/09/14/usabilitytestingbasics/
Accessed on: 2012/11/09
[17] Howell, Jonathan et al. (1994 2012), Writing@CSU,“Validity”, Colorado State University
Available: http://writing.colostate.edu/guides/page.cfm?pageid=1388
Accessed on: 20121212
[18] Howell, Jonathan et al. (1994 2012), Writing@CSU, “Reliability”, Colorado State
University
Available: http://writing.colostate.edu/guides/page.cfm?pageid=1386
Accessed on: 20121212
30DH2408, Fall 2012, Period 2 Assignment 5 Final Report 20121212
Appendixes
Appendix I Invitation email
Subject: Test Spotify with us
Hi there,
We are students from KTH and EIT ICT Labs, doing a university project to evaluate the
userfriendliness of the music streaming application Spotify. We would like you to participate in
testing the playlist function of Spotify.
You’ll be doing some tasks on the music application Spotify and giving us some comments. The
whole test process takes 30 minutes, including setting up, interview and a time to have a Swedish
fika served by us. We are really looking forward to your participation and discussion.
When: The test will take place on 15th of November (Thursday) between 10:0019:00.
Here is a link to sign up for testing and to choose the time that suits you best. Please add
YES or NO to your name to tell us if you have used Spotify before. Example John Smith
YES(if you have used it):
http://doodle.com/5sxfah8cfbhzrma6
*If you have any problem in selecting a time, send us an email and we’ll sort it out.
Where: The test will take place at the EIT ICT Labs in Kista* (Electrum Building).
EIT ICT Labs Address(Close to Kista Galleria and Kista Tbana):
Isafjordsgatan 26, Elevator C, level 3
Kista (Stockholm)
Click here for map
An alternative entrance is Kistagången 16 (more easily accessible for taxi)
*If the location of the test would change we will let you know.
*Call us if you don’t find the place.
Two Forms
We are attaching an information sheet as well as a consent form you need to sign for us to
be able to publicize a report. We will have copies printed out when you come to the test.
We will make sure all data is handled with great respect for secrecy and privacy and all user
data will be anonymized in the final report.
Best Regards,
Manfred, Mona and Zhenyu
Contact Information:
Manfred 0703773892
Mona 0704199622
Zhenyu 0767162024
31DH2408, Fall 2012, Period 2 Assignment 5 Final Report 20121212
Appendix II Information sheet
Information sheet
Title of Investigating the usability of the playlist
Project: function in the music as a service application
Spotify
Name and Contacts of Researchers: Manfred Micaux, Mona Salmani, Zhenyu Lin
Contact Number: 0703773892, 0704199622,
0767162024
Email: manfred@kth.se, salmani@kth.se,
zhenyul@kth.se
We would like to invite you to take part in this research study. Before you decide whether or not to take part, it is
important that you read the following information carefully. Please do not hesitate to ask us about anything if
you have questions concerning your participation in the study.
Details of Participation
The aim of this study is to investigate the usability of the playlist function in Spotify. By taking part in this test we
aim to gain a better understanding of the user experience of this function. This in turn will help us to become better
designers of the interaction between computers(smartphone etc.) and humans.
The test should take no longer than 30 minutes, however it may be slightly shorter or longer depending on what
information we get. We will ask you to share your thoughts and opinions on the area of research in an interview and
some basic background on using Spotify and computers/smartphone in general.
It is up to you whether you decide to take part in this study or not. If you decide to take part you will be given this
information sheet to keep and be asked to sign an ‘Informed Consent Form’. If you decide to take part you will be
free to withdraw at anytime without giving a reason. If you do choose to withdraw, any information we have
32DH2408, Fall 2012, Period 2 Assignment 5 Final Report 20121212
gathered up until that point will not be used in the final publication of the report. All data will be collected and
stored in accordance to Swedish PuL 1998:204.
The study has been approved by KTH Royal Institute of Technology and will be organised and reviewed by the
institution.
Thank you for taking the time to read this information sheet and we hope you enjoy participating in the study.
Last updated on: 12112012
33DH2408, Fall 2012, Period 2 Assignment 5 Final Report 20121212
Appendix III Informed Consent Form
Informed Consent Form
Title of Investigating the usability of the playlist
Project: function in the music as a service application
Spotify
Participant’s Statement
I …………………............................................................... agree that I have;
● read the information sheet and the project has been explained to me orally;
● had the opportunity to ask questions and discuss the study;
● I have received satisfactory answers to all my questions about the study;
● understood that the information that I give will be published as a report and be available as a public
document;
● understood that my participation is voluntary and that I am free to withdraw at any time, without giving
reason;
Finally, I agree to take part in the above study. I give my consent to the processing of my information for the
purposes of this study only and that it will not be used for any other purposes. All data will be collected and stored
in accordance to Swedish PuL 1998:204.
Your personal information will be anonymised before publication.
________________________ _______________ _________________
Name of Participant Date Signature
________________________ _______________ _________________
________________________ _______________ _________________
________________________ _______________ _________________
Name of Researcher Date Signature
34DH2408, Fall 2012, Period 2 Assignment 5 Final Report 20121212
Appendix IV Test formulation
Usability Evaluation Project
Project Introduction
Hi, welcome to participating in the test of the playlist function of Spotify.
This is a usability evaluation project aimed at testing the efficiency of the playlist function of
Spotify. Remember it is the interface of the application Spotify that is being tested, not you, so keep
relaxed! The purpose of the design is to make the application as easy to use as possible. If you find
any difficulties during using the function, regard it as the design problems. Any recording we got
from the test will be destroyed after we’ve analyzed the data, and they will only be used in this
study.
Task List
Scenario:
You are going to a party this weekend, and you are able to contribute with 3 songs to the music
playlist for the party with your friends. You can edit your friends’ playlists and finally send your
playlist to holder of the party called “Mona Salmani”. Feel free to speak out loud any comments to
the interface and the design, since we are not the designer of the interface.
Task 1
● Browse through the playlist called “Weekend Party Nick”
Task 2
● Play music in the playlist “Weekend Party Nick”
Task 3
● Remove 1 song from the playlist “Weekend Party Nick”
Task 4
● Create a playlist with a name of “Party Your Name”
Task 5
● Find 3 songs and add them to the playlist you created
Task 6
● Share the playlist you created with a friend called “Mona Salmani” so that she can do
further editing of the playlist
Well Done!
Thank you for participating in the evaluation of Spotify. Enjoy the Swedish fika and we’ll ask you a
few questions about the test.
35DH2408, Fall 2012, Period 2 Assignment 5 Final Report 20121212
Appendix V Interview: User’s Background
Smartphone
Desktop
36DH2408, Fall 2012, Period 2 Assignment 5 Final Report 20121212
Appendix VI Smartphone Users Interview: Former Experience of Spotify
and the users perception
37DH2408, Fall 2012, Period 2 Assignment 5 Final Report 20121212
Appendix VII Desktop Users Interview: Former Experience of Spotify and
the users perception
38DH2408, Fall 2012, Period 2 Assignment 5 Final Report 20121212
Appendix VIII Oneway Anova Comparison Results of Task 1,2,5,6
Oneway Anova Result of Task 1
Oneway Anova Result of Task 2
Oneway Anova Result of Task 5
Oneway Anova Result of Task 6
39You can also read