Development of a Supercritical Carbon Dioxide Brayton Cycle: Improving PBR Efficiency and Testing Material Compatibility
←
→
Page content transcription
If your browser does not render page correctly, please read the page content below
INEEL/EXT-04-02437

Development of a Supercritical
Carbon Dioxide Brayton Cycle:
Improving PBR Efficiency and
Testing Material Compatibility
Project Number: 02-190
Nuclear Energy Research Initiative
Report for October 2004 to September 2004

Chang Oh
Thomas Lillo
William Windes
Terry Totemeier
Richard Moore

October 2004

Idaho National Engineering and Environmental Laboratory
Bechtel BWXT Idaho, LLC
INEEL/EXT-04-02437

 Development of a Supercritical Carbon Dioxide Brayton
  Cycle: Improving PBR Efficiency and Testing Material
                     Compatibility

Chang Oh, Idaho National Engineering and Environmental Laboratory (INEEL)

   Thomas Lillo, William Windes, Terry Totemeier, Richard Moore, INEEL

                              October 2004

    Idaho National Engineering and Environmental Laboratory

                       Idaho Falls, Idaho 83415

                             Prepared for the
                        U.S. Department of Energy
                         Office of Nuclear Energy
                     Under DOE Idaho Operations Office
                       Contract DE-AC07-99ID13727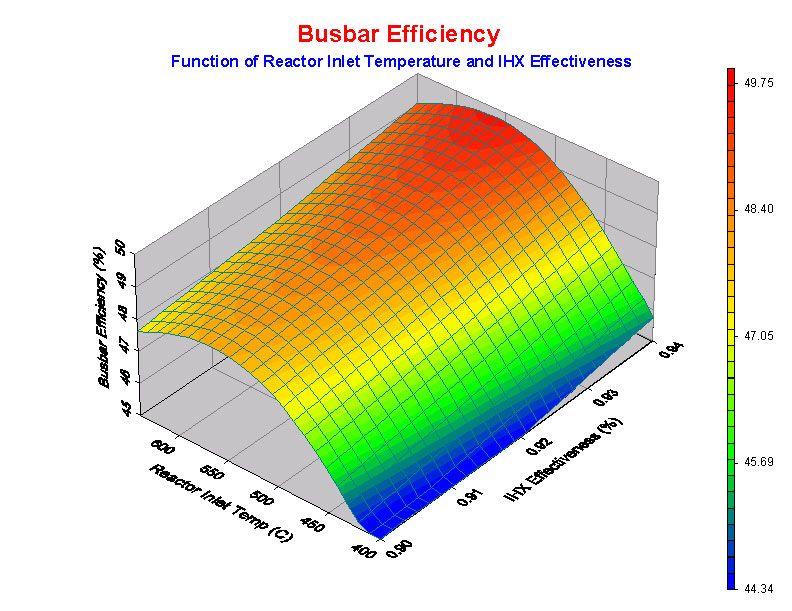
CONTENTS
Executive summary...........................................................................................................iii
Narrative............................................................................................................................ 1
Task 1.         Development of CO2 Brayton Cycle ................................................................ 1

                Task 1-1 Development of the efficiency equation of turbine
                and compressor for real gas............................................................................ 1

                Task 1-2 Comparison of supercritical CO2 properties with
                equations of state ............................................................................................ 1

                Task 1-3 Selection of the optimization computer code.................................... 1

                Task 1-4 Layout of the CO2 thermal cycle and initial
                calculations...................................................................................................... 2

                Task 1-5 Perform baseline calculations along with Task 1-4 .......................... 2

Task 2.         Improvement of PBR Net Efficiency ................................................................ 2

                Task 2-1 Parametric study due to enhancement of each
                component’s efficiency .................................................................................... 2

                Task 2-2 Optimization of PBR Plant .............................................................. 10

                Task 2-3 Efficiency Calculations and Other Technical Issues....................... 13

Task 3.         Materials Testing ........................................................................................... 19

References            ................................................................................................................. 28

                                                                   iii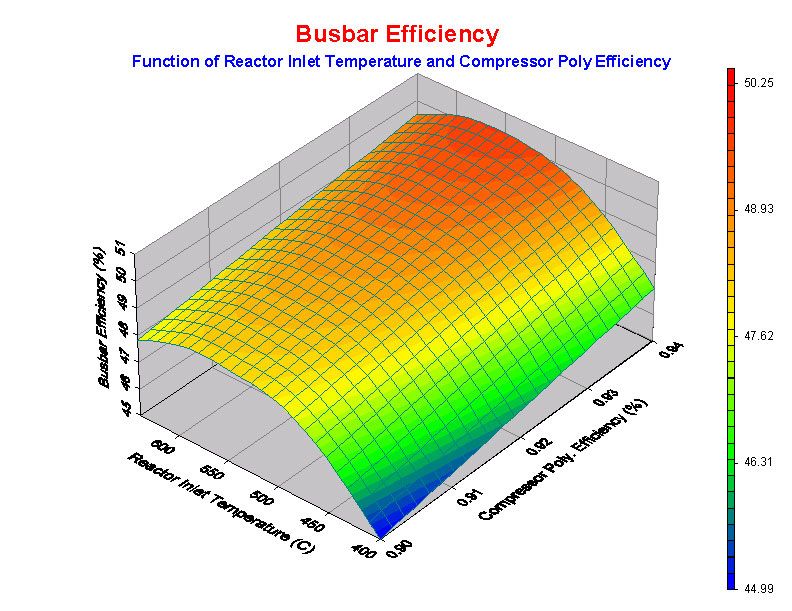
iv
NUCLEAR ENERGY RESEARCH INITIATIVE
 Development of a Supercritical Carbon Dioxide Brayton Cycle:
  Improving PBR Efficiency and Testing Material Compatibility
PI:                    Chang Oh, Idaho National Engineering and Environmental
                       Laboratory (INEEL)

Collaborators:         Thomas Lillo, William Windes, Terry Totemeier, Richard Moore,
                       INEEL

Project Start Date:    October 2003                      Project Number: 02-190

Projected End Date: September 2004

Research Objectives

The U.S. and other countries address major challenges related to energy security and
the environmental impacts of fossil fuels. Solutions to these issues include carbon-free
electricity generation and hydrogen production for fuel cell car, fertilizer synthesis,
petroleum refining, and other applications. The Very High Temperature Gas Reactor
(HTGR) has been recognized as a promising technology for high efficiency electricity
generation and high temperature process heat applications. Therefore, the U.S. needs to
make the HTGR intrinsically safe and proliferation-resistant. The U.S. and the world,
however, must still overcome certain technical issues and the cost barrier before it can
be built in the U.S. The establishment of a nuclear power cost goal of 3.3 cents/kWh is
desirable in order to compete with fossil combined-cycle, gas turbine power generation.
This goal requires approximately a 30% reduction in power cost for state-of-the-art
nuclear plants. It has been demonstrated that this large cost differential can be
overcome only by technology improvements that lead to a combination of better
efficiency and more compatible reactor materials.

The objectives of this research are (1) to develop a supercritical carbon dioxide Brayton
cycle in the secondary power conversion side that can be applied to some Generation-IV
reactors such as the HTGR and supercritical water reactor, (2) to improve the plant net
efficiency by using the carbon dioxide Brayton cycle, and (3) to test material compatibility
at high temperatures and pressures. The reduced volumetric flow rate of carbon dioxide
due to higher density compared to helium will reduce compression work, which
eventually increase turbine work enhancing the plant net efficiency.

Research Progress

Advanced gas reactor technology has been identified as one of the best passively safe,
thermally efficient, proliferation resistant, modular reactor systems capable of electricity
and hydrogen production as well as efficient burning of spent fuel. Internationally, the
HTGR concept has become the top priority for implementation because of its inherent
safety and near-term implementation feasibility. The U.S. Department of Energy (DOE)

                                              v
indicates that the Next Generation Nuclear Plant (NGNP) will be built at the INEEL site
by 2017. In order to resolve any first of a kind technical issue, this project consists of
three major tasks with a number of subtasks under the major ones. All tasks have been
performed on schedule and budget. The technical accomplishments from each task are
summarized below:
Development of CO2 Brayton Cycle: The proposed supercritical Brayton cycle deals with
high pressures and temperatures. At these conditions, an ideal gas law, using isentropic
compression and expansion cannot be applied because of real gas effects associated
with non-ideal compression and expansion processes. Therefore, there was a need to
develop analytical equations for polytropic expansion and compression through a
sequence of turbines and compressors, respectively. The developed set of equations is
used for scoping analyses aimed at investigating the effect of the overall plant efficiency.
For the detailed computation of the balance of plant (BOP) efficiency calculations, a CO2
database is required to make accurate calculations. We compared a number of
equations of state and CO2 databases and determined that the NIST CO2 database is
the most accurate and the properties are consistent with those referenced in Perry’s
Handbook. We also investigated and compared Aspen Plus and HYSYS for BOP
process optimization. Both codes agree well with conditions defined in a simple
reference design. The deviation in results was less than 0.5%. However, Aspen Plus is
limited to isentropic expansion processes without multiple turbine performance curve
capabilities. Therefore we decided to use the HYSYS code for our BOP calculations.
We also used a numerical model that was originally developed at MIT using the Visual
Basic computer language. This numerical model was revised by INEEL by implementing
the NIST CO2 database and adding a reactor core pressure drop equation to the
numerical model. The results from HYSYS were compared with those from the Visual-
Basic (V-B) model. The results produced by both models agreed very well for the 3-shaft
baseline case. The HYSYS CO2 Brayton cycle model gives a 51% plant efficiency, which
is an improvement over the 47% for the helium Brayton cycle using the same BOP
layout. The improvement in efficiency is attributed to the reduced volumetric flow of CO2
over that of helium, which results in less compression work.
Improvement of HTGR Net efficiency: The objective of this task is to determine the
overall plant cycle efficiency by the integration and optimization of each of the
components used in the power conversion side. In order to perform this task in an
efficient manner, our original reference design with a three-shaft turbo-machinery
arrangement was used in a parametric study and optimization with helium as working
fluid using HYSYS. In parallel to the use of HYSYS, the V-B model was used with an
implementation of an appropriate friction pressure drop equation for a pebble bed
reactor. This term is importance in determining the net power plant efficiency and is not
directly calculated by the HYSYS model. A similar pressure drop equation can be input
for a prismatic core of NGNP. After the helium Brayton Cycle loop was optimized a
number of HYSYS simulations with supercritical CO2 were completed.
A number of important parameters were investigated for this study. The parameters
investigated are: various temperature differences across the reactor, reactor inlet
temperatures, inlet cooling temperatures to compressors, effectiveness factor of the IHX
and recuperator, efficiencies of the compressors, turbines, and other components.
Results corresponding to various temperature differences across the reactor for a three-
shaft 250 MW thermal helium Brayton cycle using a 92 % effectiveness factor for the
intermediate heat exchange and 90 % polytropic efficiency for the turbines and
vicompressors, indicate that at a relatively low reactor outlet temperature (850qC), the
maximum cycle efficiency peaks at 45%, which corresponds to a reactor inlet
temperature of 520qC. As the reactor outlet temperature is allowed to increase, the
maximum efficiency increases to 51.5% at an outlet temperature of 1000qC. For
intermediate outlet temperature between 850qC and 1000qC, the cycle efficiency
increases from 45% to 51.5% with the corresponding reactor inlet temperature
increasing from 520qC to 640qC. The effect of compressor efficiency on the overall
Brayton cycle efficiency was determined by varying the compressor efficiency from 90 to
94 % using a constant reactor inlet and outlet temperature of 5000C and 900qC,
respectively. The results showed that the cycle efficiency increases from 48.2% for a
compressor polytropic efficiency of 90% to 50.2% for a polytropic efficiency of 94%. A
practical way of reducing the compressor work is to keep the specific volume of the gas
as small as possible during the polytropic compression. This can be achieved by
maintaining the gas temperature as low as possible because specific volume is
proportional to temperature. By dividing the compression process into stages and
cooling the gas between stages, the total work done during the compression process is
reduced. By reducing the compressor inlet temperature by 5qC, the overall cycle
efficiency increases by 0.65 %. We also investigated the sensitivity of the effectiveness
of the intermediate heat exchanger (IHX) on the overall cycle efficiency. If the
effectiveness of the IHX is improved from 90% to 92% at a core outlet temperature of
9500C and a core inlet temperature of 400°C, for example, there is an initial
improvement of the overall Brayton efficiency by 0.65%. The IHX effectiveness has less
impact on the efficiency compared to the compressor efficiency.
In order to validate the HYSYS and V-
B models, a simple one-shaft Brayton
cycle layout and reference design of
the GTHTR300 was used. GTHTR300
is a direct cycle plant that consists of
three subsystem modules including a
reactor with a prismatic core, a gas
turbine generator module with one
turbine, one compressor, and a
generator on a single shaft in a
horizontal arrangement, and a heat
exchanger module with one
recuperator and one precooler as
shown in Figure E-1.
Fig. E-1. GTHTR-300
Assumed values of turbine polytropic efficiency (92.8%), compressor polytropic
efficiency (90.5%), recuperator effectiveness (95 %), and inlet compressor temperature
(28żC) were used along with same conditions of other parameters in both the V-B and
HYSYS models. The V-B model gives lower net cycle efficiencies than those of HYSYS
except at the maximum efficiency point. The one difference between the HYSYS and V-
B models lies in the uses of different helium property database. The V-B model uses the
NIST database while HYSYS uses an equation of state to define the helium properties.
Then in order to check the accuracy of HYSYS simulation using CO2, a CO2 pressure-
enthalpy diagram was used. The results calculated by HYSYS agree very well with
those calculated using the CO2 pressure-enthalpy diagram.
viiA parametric investigation was made with supercritical CO2 cycle using a 250 MW three- shaft reference design. Three different CO2 secondary system pressures of 6.3 MPa, 13 MPa, and 20 MPa, give cycle efficiency of 48%, 49.3%, and 50.3%, respectively, which are not significantly different from each other. Working fluids of helium for both direct and indirect cycle, nitrogen for indirect cycle, and CO2 for indirect cycle were investigated. The difference between the helium direct cycle and the indirect cycle was 50.9% vs. 48.7% respectively. Nitrogen gave a cycle efficiency of 45.5% while CO2 gave a cycle efficiency of 50.7%. Total area ratio (total heat transfer area of working fluid / total heat transfer area of helium indirect cycle) gives, 0.65 for helium direct cycle, unity for helium indirect cycle, 1.32 for nitrogen indirect cycle, and 1.18 for CO2 indirect cycle at 20 MPa. Conclusions from the investigation are (1) among the three working fluids studied, CO2 has the highest cycle efficiency due to less compression. CO2 cycle also results in the smallest turbomachinary, and (2) helium direct cycle eliminates the IHX and consequently requires the smallest heat transfer area due to the higher heat capacity and thermal conductivity than those of the other fluids considered. Theoretically a combination of reheat and intercooling increases the cycle efficiency in a closed loop. Preliminary multiple reheat with a number of intercooling were investigated using a molten salt (Flibe) in the primary side and helium in the power conversion loop. This configuration yields a 56% cycle efficiency. Further investigation using Flibe-CO2 is being considered. Material Compatibility: Research on the creep behavior and corrosion resistance in supercritical CO2 of MA 754 continued during FY04. The creep behavior of both coarse- grained as well as fine-grained MA 754 was documented. Creep microstructures were documented and fracture analysis was carried out on failed creep samples. A manuscript documenting the results was prepared and submitted to a peer-reviewed journal for publication. The results showed that MA 754 did, indeed, exhibit superior creep resistance at temperatures approaching 1000oC. The material did, however, exhibit lower creep rates in direction perpendicular to the extrusion direction, i.e. creep rate is a function of direction in the material, and exhibited low creep ductility,
Highlights of the annual activities are summarized below:

x In terms of the schedule and budget, we are right at the target.
x Task 1 (development of CO2 Brayton cycle) including a number of baseline
   calculations has been completed.
x Upon completion of Task 1, we mainly focused on Task 2. Parametric studies have
   been performed to determine the overall cycle efficiency sensitivity to key
   parameters.
x For supercritical CO2 Brayton cycle, a case from a HYSYS simulation was checked
   to make sure that exit conditions of a compressor calculated using HYSYS agreed
   with those from the CO2 pressure-enthalpy diagram through sequential compression
   steps. They agree very well.
x Among three working fluids studied for the indirect power conversion study (PCS),
   supercritical CO2 has the highest cycle efficiency due to less compression work as a
   result of the higher densities of supercritical CO2 than other fluids used for the
   indirect cycle. Supercritical CO2 also results in the smallest turbomachinary
   components.
x Helium direct cycle eliminates an IHX and consequently requires the smallest heat
   transfer area due to the higher heat capacity and thermal conductivity than those of
   other fluids.
x For the final selection of the best working fluid, or fluid mixture, trade-off studies need
   to be performed for efficiency, capital cost, maintenance cost, the stability of fluids
   through compressor, potential leakage from PCS, and other relevant issues. This
   project will include some of these issues later in FY-05 efforts.
x Two technical papers were published and one paper was accepted in peer review
   journal.
    C.H. Oh, R. Moore, Enhancement of the Thermal Efficiency for High Temperature
    Gas-Cooled Reactors, the 10th International Topical Meeting on Nuclear Reactor
    Thermal Hydraulics, Seoul, Korea, October 5-9, 2003.
    C.H. Oh and R.L. Moore, Parametric Investigation of Brayton Cycle for High
    Temperature Gas-Cooled Reactors, ASME Summer Heat Transfer Conference,
    Charlotte, NC, July 11-15, 2004.
    C.H. Oh and R.L. Moore, Brayton Cycle for High Temperature Gas-Cooled
    Reactors, to be published in March Issue of Nuclear Technology, 2005.
x   Completed Task 3-1 – Characterization of creep deformation of coarse-grain MA
    754 that included completion of subtasks 3-1-2 High temperature mechanical and
    creep properties of coarse-grained MA 754 and 3-1-3 Mechanical and creep
    properties of fine-grained MA 754. A manuscript describing the results was
    accepted for publication in a peer-reviewed journal.
    T. C. Totemeier, and T. M. Lillo, Effect of Orientation on the Tensile and Creep
    Properties of Coarse-Grained INCONEL Alloy MA754, accepted for publication in
    Metallurgical and Materials Transactions A.
x   Completed subtask 3-2-2 Corrosion testing of MA 754 in supercritical CO2
x   Characterized the creep microstructures of MA 754. These results were also
    incorporated into the manuscript mentioned under Task 3-1 above.

                                              ix
Planned Activities
x Task 2 continues with comparison of other cycle configurations.
x Other cycle configurations are a combined cycle, recompression, and multiple reheat
cycle. The cycle will be optimized using HYSYS.
x If time is allowed, an intermediate flow loop heat transfer study for NGNP hydrogen
will be investigated.
x Complete Task 3-2-3 Corrosion testing of fine-grain MA 754 and compare the
corrosion behavior to coarse-grained MA 754
x Initiate and complete Task 3-2-3 Corrosion testing of alternate alloys. Tentatively we
plan on documenting the corrosion behavior of I-617, an alloy receiving considerable
attention for use in various high temperature areas of the NGNP.
x Complete the summary report on MA 754 (Task 3-3) with recommendations on the
suitability of MA 754 for use in a supercritical Brayton cycle.
xNarrative
Task 1. Development of CO2 Brayton Cycle
Task 1-1 Development of the efficiency equation of turbine and compressor for the real
gas
The objective of this task involves mathematical derivations of the turbine and
compressor efficiency. When supercritical CO2 gas is expanded and compressed in a
real gas fashion through a sequence of turbines and compressors, the isentropic
formulas shown in most thermodynamic books are no longer useful.
Task technical status overview: As reported in the first annual report the following tasks
were already accomplished through the end of September 2002.
x Theoretical equations for polytropic expansion and compression were developed
in this task for scoping analyses in Year 1.
Task 1-2 Comparison of supercritical CO2 properties with equations of state
The objective of this task involves checking thermal and transport properties of CO2 gas
between references (Reid et al., 1977, Reid et a., 1987, Rivken, 1988, and Perry et al.,
1997) and a number of equations of state (EOS) in the Aspen Plus (Aspentech, 2001)
and HYSYS codes (Aspentech, 2001).
Task technical status overview: As reported in the first annual report the following tasks
were already accomplished through the end of September 2002.
x Thermal and transport properties of CO2 were compared and we found that the
NIST database (http://webbook.nist.gov/chemistry/fluid) is very accurate. Also the Lee-
Kesler-Plocker equation of state is the most accurate EOS defined in Aspen Plus and
HYSYS. The Peng-Robinson EOS (Peng and Robinson, 1976) is good for helium and
other fluids. Therefore, the NIST database is used for our scoping calculations and the
Lee-Kesler-Plocker EOS (Knapp, H., 1989) is used for all the CO2 computer simulation
while the Peng-Robinson EOS is used for helium and other fluids.
Task 1-3 Selection of the optimization computer code
The objective of this task involves the comparison of the HYSYS and Aspen Plus codes
and the selection of one code for Next Generation Nuclear Plant (NGNP) (Macdonald,
2003) simulations.
Task technical status overview: As reported in the first annual report the following tasks
were already accomplished through the end of September 2002.
1x Actually both the HYSYS and ASPEN PLUS computer codes gave the same
results for cases we investigated. However, HYSYS has more capabilities than those for
Aspen Plus. If more complicated chemical processes are involved, Aspen Plus can be a
better code. However, when it is applied to no chemical reaction application with
polytropic compression and expansion, HYSYS is a slightly better code with more
characteristic turbine curves. INEEL has had company wide licenses for both computer
codes. Therefore, we can use Aspen Pus code for other application such as hydrogen
production plant.
Task 1-4 Layout of the CO2 thermal cycle and initial calculations
The objective of this task is to create a preliminary layout of a CO2 thermal cycle as a
baseline case for comparing with the helium cycle.
Task technical status overview: As reported in the first annual report the following tasks
were already accomplished through the end of September 2002.
Task 1-5 Perform baseline calculations along with Task 1-4
The objective of this task is to establish a baseline case and to use the baseline case as
a basis for comparing its results with those from other cycle efficiency calculations using
other cycle configurations and various working fluids.
Task technical status overview: This task was completed in June 2003.
Task 2. Improvement of Pebble Bed Reactor (PBR) Net Efficiency
Task 2-1 Parametric study due to enhancement of each component’s efficiency
The objective of this task is to determine the overall plant busbar efficiency by the
combination of the increased efficiency of each component in the secondary side of the
HTGR. To accomplish this task, we performed a parametric study of the effect of each
component on the overall Brayton cycle efficiency.
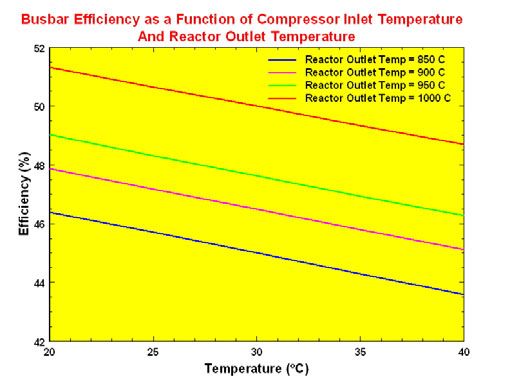
Important parameters for improving the Brayton cycle efficiency are increasing the
reactor core outlet temperature, increasing the efficiencies of the compressor, turbine,
intermediate heat exchanger, and others. The reactor core outlet temperature was
varied between 850qC and 1000qC. For each of the fixed outlet temperatures (850qC,
900qC, 950qC and 1000qC), the inlet temperature to the core was varied between 400qC
and 640qC. All of the above cases are based on a three shaft arrangement for the
helium Brayton cycle, using an intermediate heat exchanger effectiveness factor of 92
%, a 90 % polytropic efficiency for the compressors and turbines, and a 300C cooling
temperature to the precooler and the three intercoolers.
The mass flow rate through the core needed to remove 250 MW of thermal energy
from the reactor core is a function of the required temperature drop across the core.
Thus, the pressure drop across the core is a function of the core mass flow rate.
Previously we did not account for the effect of the pressure drop on the Brayton cycle
efficiency. For these calculations, we used a pressure drop equation shown below that is
based on a pebble bed reactor.
2The friction pressure drop 'Pf through a pebble bed of height H (Oh and Moore, 2004)
can be expressed as
H Uave 2
'Pf \ Up
dh 2
where \ is the pressure drop coefficient, H is the height of the core, d h is the hydraulic
diameter, Uave is the average density of the fluid in the core, and U p is the mean velocity
in the gaps between the particles.
The new V-B numerical model with the new pressure drop correlation was benchmarked
against a three-shaft baseline case based on HYSIS simulation. The results and
comparison are shown in Table 1.
Table 1. Comparison between HYSIS simulation and Visual-Basic based model.
Calculation Inlet Outlet Total Total Busbar
Method temperature / temperature/press compression turbine efficiency
pressure to ure to HP work work
HP turbine compressor (MW) (MW)
HYSIS 8650C / 74.50C / 7.9 MPA 111.7 129.5 47%
746MPa
V-B Model 8640C/ 77.50C / 8.0 MPA 112.7 129.9 46%
746MPa
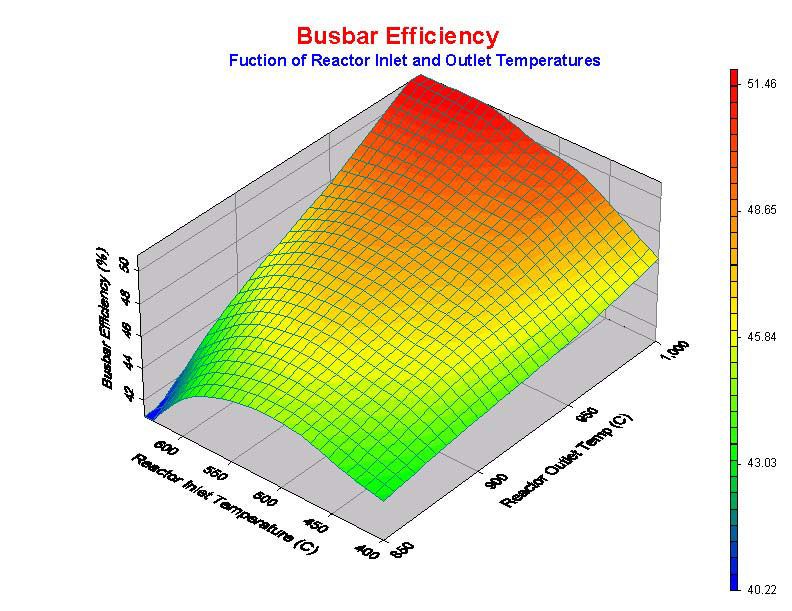
Figure 1 shows a three-dimensional plot of the plant busbar efficiency as a function
of reactor inlet and outlet temperatures for a three-shaft 250 MW thermal helium Brayton
cycle using a 92% effectiveness factor for the intermediate heat exchange and 90 %
polytropic efficiency for the turbines and compressors.
3Figure 1. Busbar efficiency as a function of temperature
difference across the reactor.
We investigated the effect of compressor efficiency on the overall Brayton cycle
efficiency by varying the compressor efficiency from 90 to 94 % as shown in Figure 2.
Figure 2. Busbar efficiency as a function of compressor efficiencies
and reactor inlet temperatures.
A practical way of reducing compressor work is to keep the specific volume of the
gas as small as possible during the polytropic compression. This is achieved by
maintaining the temperature of the gas as low as possible because specific volume is
proportional to temperature. By dividing the compression process into stages and
cooling the gas between stages, the total work done during the compression process is
4reduced. By reducing the compressor inlet temperature by 10C, the overall cycle
efficiency increases by 0.131 % as shown in Figure 3.
Figure 3. Busbar efficiency at various cooling temperature.
We also investigated the sensitivity of the effectiveness of intermediate heat
exchanger (IHX) on the overall busbar efficiency. If the effectiveness of IHX is improved
from 90% to 92% at a core outlet temperature of 9500C and a core inlet temperature of
4000C, for example, there is an initial improvement of the overall Brayton efficiency by
0.65%. The IHX effectiveness has less impact on the efficiency compared to the
compressor efficiency.
Figure 4. Busbar efficiency as a function of IHX efficiencies
and reactor inlet temperatures.
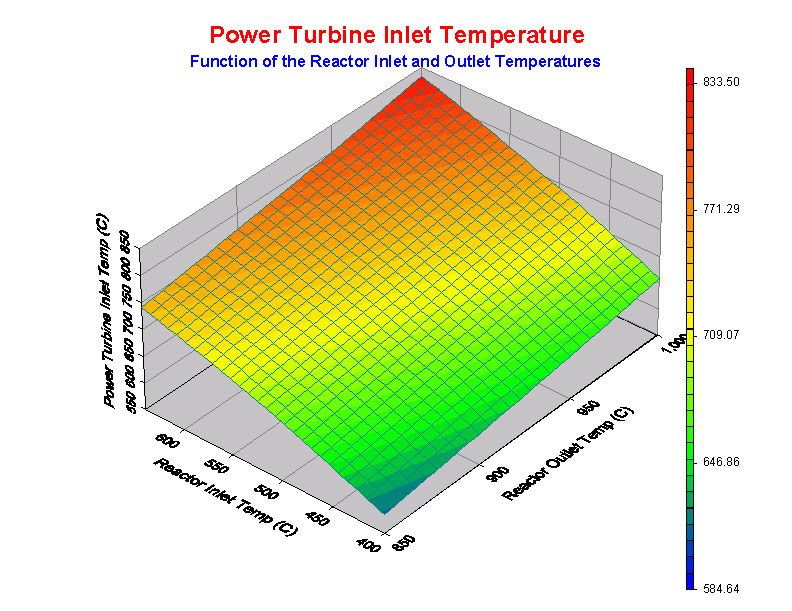
5Figure 5 shows how the temperature difference across the reactor impacts the
power turbine inlet temperature that is very important to the overall efficiency.
Figure 5. Power turbine inlet temperature as a function of temperature drop across the
reactor.
The objective of this task is to determine the overall plant cycle efficiency by the
combination of the increased efficiency of each component in the secondary side of the
HTGR. To accomplish this task, we performed a number of parametric studies to
determine the effect of each component on the overall Brayton cycle efficiency.
In order to calculate the pressure and temperature at the exit of a polytropic expansion
or compression process, pressure-enthalpy (P-H) data from the NIST database was
used. The procedure is described below and depicted in graphical form in Figure 6:
(1) Starting Point 1, follow the line of constant entropy to the required discharge pressure
of P2, locating the isentropic discharge state point of 2is.
(2) With these two points located, the differential isentropic enthalpy can be calculated
from the following equation:
'h is h 2is h 1 (1)
(3) Calculate the real discharge enthalpy of point 2 using:
'h is
h2 h1 (2)
Kis
where Kis is the isentropic process efficiency. The point 2 is on the same pressure P2
line shown on Figure 7. At the point 2, temperature can be obtained on the same
temperature isotherm line in Figure 6.
6The actual discharge temperature can now be obtained from the P-H diagram (GPSA,
1998) or P-H database. The helium properties were incorporated as a property look-up
table. In these calculations, we used pressure-temperature-enthalpy data from the NIST
database.
P1
Isentropic P2
T
'T
'Ti
Polytropic
S
Figure 6. Pressure-Enthalpy diagram. Figure 7. T-S diagram for
isentropic and polytropic (real)
compression.
In the preceding quarters, we used heat capacities of helium for calculating the stream
conditions through all unit-operation components. However, heat capacity of
supercritical CO2 has a spiked value around the supercritical condition of pressure of
7.29 MPa and temperature of 31°C. Therefore, there was a need to use an enthalpy
database for avoiding numerical instabilities when dealing with step increased value of
heat capacity around the supercritical condition.
As part of Task 2, improvement of the net efficiency, there was a need to validate our
Visual Basics and HYSYS models. Results from both the HYSYS simulation and the
Visual Basic model were compared with Japanese calculations based on the 300 MWe
GTHGR that was developed by the Japan Atomic Energy Research Institute (JAERI).
Figure 8 is a schematic of the GTHTR300 (Yan, 2003) power conversion cycle. As
shown, the GTHTR 300-power conversion cycle selected for validation uses no cycle
intercooling.
7TURBINE COMPRESSOR Generator
850 C 28 C
6.8 MPA 3.5 MPa 280 MWe
439.1 kg/s 442.9 kg/s
cooling water
612 C 22 C
3.62 MPa
442.9 kg/s
Reactor
Precooler
600 MWt
vessel cooling bypass flow
0.2 %
164.4 C
3.54 MPa
442.9 kg/s
Recuperator
Figure 8. GTHTR300 Schematic.
Figures 9 and 10 show comparisons of cycle efficiencies and pressure ratios,
respectively at various reactor inlet temperatures and a reactor outlet temperature of
8500 C. Turbine polytropic efficiency of 92.8%, compressor polytropic efficiency of
90.5%, recuperator efficiency of 95 %, and inlet compressor temperature of 280 C were
used. The Visual Basic model gives lower efficiencies than those of HYSYS except at
the maximum efficiency point. The one difference between HYSYS and V-B model lies in
a different helium property database. V-B model uses NIST database while HYSYS uses
an equation of state to define the helium properties.
Figure 9. Comparison of cycle efficiency. Figure 10. Comparison of pressure
ratio
Cycle efficiency is most sensitive to core outlet temperature, which is transferred to the
inlet stream of the high-pressure turbine through an intermediate heat exchanger.
8Based on a three-shaft 250 MW thermal HTGR, we summarize cycle sensitivities to key
cycle parameters shown in Table 2.
Table 2. Cycle efficiency sensitivity to key cycle parameters.
Cycle parameters Change in cycle parameter Change in cycle efficiency
(%)
Turbine inlet temperature +50qC +2.1
Recuperator efficiency +1% +1.6
Reactor vessel cooling flow +1% -0.1
Compressor inlet +5.0qC -1.2
temperature
Compressor efficiency +1% +0.8
Turbine efficiency +1% +1.0
In order to check the accuracy of HYSYS simulation, the CO2 pressure-enthalpy diagram
was used to compare with HYSYS simulation results. The method used is the same
procedure described above. Figures 11 and 12 illustrate how to obtain the HPC exit
temperature of 113°C from the P-H diagram. Figure 11 shows HYSYS results for one
case using CO2 with a HPC exit temperature of 113°C. We need to validate this
temperature using the P-H diagram shown in Figure 12. As shown in Figure 12, once the
red point 2 in step 3 described above is determined, the temperature isotherm line is
crossed at 113°C, which is the same result obtained from the HYSYS simulation.
HPC Exit Tem perature Check
on CO 2 Brayton cycle
Q = 3.8196e4 kW
Intercooler Efficiency = 0.9
m = 696.9 kg/s
HPC R ecuperator
T = 30. C T = 113. C
P = 3199 kPa P = 8149 kM Pa
Inlet H = -8977.2 kJ/kg Outlet H = -8922.4 kg/kg
D elta H = isentropic enthalpy change = 54.8 kJ/kg
OR
D elta H = Q/m = 3.8196e4/696.9 = 54.8 kJ/kg
Polytropic enthalpy change = isentropic enthalpy change / efficiency = 60.9 kJ/kg
Figure 11. Stream property of the inlet and outlet of the high-pressure compressor from
HYSYS simulation.
9Figure 12. CO2 pressure-enthalpy diagram and paths to obtain the HPC exit temperature
of 1130C.
Task 2-2 Optimization of PBR Plant
The objective of this task is to improve the overall plant cycle efficiency by the
combination of the increased efficiency of each component in the secondary side of the
HTGR. To accomplish this task, we performed a number of HYSYS simulation to
investigate the pressure effect on the overall cycle efficiency. The high pressure of the
working fluid permits the turbo machine to be compact due to the higher density of the
fluid. For example, the density of CO2 at 20 MPa and 800°C is 2.43 times higher than
that of CO2 at 8MPa and 800°C. It shows the same trend for helium (2.44 times higher
for helium at 20MPa and 800°C than that of helium at 8MPa and 800°C). Generally
system pressure increases the cycle efficiency. However, the optimized system pressure
should be determined by energy and mass balance on each component where the
condition does not cause temperature crossover around the recuperator and
intermediate heat exchanger. The heat transfer of various working fluids affects the final
design and operating conditions, which results in various cycle efficiencies. Using
HYSYS optimization option, a wide range of system pressures from 6 MPa to 20 MPa
were examined along with a wide range of temperatures, which will provide an optimized
efficiency.
Figure 13 shows a typical example of a HYSYS simulation using a three-shaft
arrangement, a system pressure of 13 MPa and other conditions described as follows:
polytropic efficiency of turbine 92%, compressor efficiency of 90%, a reactor outlet
temperature of 900°C, a compressor inlet temperature of 30°C, three inter coolers (a
pressure drop of 20 kPa each), a recuperator effectiveness of 95%, IHX effectiveness of
90%, pressure drops of 140 kPa for the IHX primary side and 150 kPa for the secondary
side, and a pressure drops of 20 kPa for precooler.
10Figure 13. HYSYS Schematic for a supercritical CO2 cycle with 49.3% efficiency.
The preliminary results of the pressure effect on the cycle efficiency and the size of the
recuperator using a supercritical CO2 cycle, indirect 3-shaft arrangement are presented
in Table 3.
Table 3. Results of the pressure effect on the efficiency.
Pressure in PCS Mass flow rate UA value for Cycle efficiency
(kg/s) recuperator (kJ/C-
hr)
6.3 MPa 700 2.7095e7 48%
13 MPa 625 1.885e7 49.3%
20 MPa 560 1.507e7 50.3%
where UA is universal heat transfer coefficient times heat transfer area.
In order to maintain an effectiveness factor of 95% for the recuperator, the following
calculation was implemented into the HYSYS simulation: The effectiveness İ of a heat
exchanger is defined as the ratio of the actual heat transfer rate to the maximum heat
transfer rate.
q
H{ (3)
q max
q max C min (Th ,i Tc ,i ) (4)
here Cmin is either Ccold or Chot, whichever is smaller.
C cold c p ,cold m cold (5)
11C hot c p ,hot m hot (6)
The effectiveness is set for each heat exchanger (90% for the intermediate heat
exchanger and 95% for the recuperator).
Next, the qmax is determined using equation 4 through 6. In the case of Helium cp is
constant through the heat exchanger and Cmin is not a function of temperature.
However, in the case of CO2 or other real gases cp is not constant and Cmin is a function
of temperature. To account for this, the assumption was made that cp through the heat
exchanger would be the average, cp,avg of cp,in and cp,out.
In order to fully define a heat exchanger, the inlet and outlet temperature and pressure
must be known, along with the mass flow for both the hot and cold side of the heat
exchanger. Therefore q of the heat exchanger can be calculated.
HYSYS uses an adjust function to make the heat exchanger satisfy the effectiveness
condition. Equations 3 and 4and the heat exchanger conditions are entered into
HYSYS. HYSYS then calculates q, qmax and İ for the exchanger. A modifiable condition
is then entered into HYSYS. This condition is adjusted, while the others are held
constant, so that the heat exchanger satisfies the effectiveness condition. For the IHX
the cold side outlet temperature is adjusted. While for the recuperator the hot side outlet
pressure is adjusted. Therefore, if a condition is altered the modifiable condition can be
adjusted to satisfy the effectiveness condition.
Direct cycles versus indirect cycles were compared based on a 600 MW-thermal
Japanese GTHTR and a 900°C reactor outlet temperature. Figure 14 shows HYSYS
layout for the indirect cycle with 48% efficiency compared with a 52% for the direct cycle.
Figure 14. HYSYS layout for the indirect Brayton cycle.
12Task 2-3 Efficiency Calculations and Other Technical Issues
The objective of this task is to include some of the important technical issues which were
not cover in the preceding tasks: review of various working fluids, number of intercooler,
an option for reheat, review on other cycles including recompression, a combined
Brayton and Rankine cycle, and multiple reheat using molten salts for the intermediate
flow loop.
This is the start of the third year of this NERI project thus some preliminary results from
this year are presented in this report.
The working fluid is very important for the power conversion system (PCS) of the NGNP.
The cycle efficiency, the size of all the components such as turbine, compressor,
recuperator, intermediate heat exchanger for hydrogen production units, and other
components will depend on the fluid because each different fluid has different heat
transfer and transport properties. Due to the different properties of the fluids, the balance
of plant will have varying energy and mass balances. The material sustainability in the
PCS is also dependent on type of fluids in terms of corrosion, material creep (yield
stress, ultimate tensile stress, ductility and others). Construction material used for all the
components and piping in the PCS are exposed to high temperature and pressure,
which are governed, by the fluid energy and mass balance.
We began to investigate the working fluid choices including nitrogen, and a binary
mixture for the indirect cycle. A combined Brayton cycle will also be explored to see the
improvement of the efficiency.
2-3-1 Working Fluids
(a) Helium for both direct and indirect cycle
The direct helium cycle was simulated with an optimal pressure ratio of ~1.93.
This gave a cycle efficiency of 50.9%.
The indirect helium cycle was simulated assuming a compressor outlet pressure
of 8 MPa. The cycle conditions were optimized with a secondary mass flow rate
equal to the primary mass flow (439.1 kg/s) and a pressure ratio of ~2.02. This
gave a cycle efficiency of 48.7%.
(b) Nitrogen for indirect cycle
The indirect Nitrogen cycle was simulated assuming a compressor outlet
pressure of 8 MPa. The optimal secondary mass flow rate was 2600 kg/s and
the optimal pressure ratio was ~2.37. This gave a cycle efficiency of 45.5%.
(c) CO2 for indirect cycle
The indirect CO2 cycle was simulated assuming a compressor outlet pressure of
20 MPa. The higher compressor outlet pressure was used to take advantage of
compression around the critical point and decrease compressor work. The
optimal secondary mass flow rate was 1794 kg/s and the optimal pressure ratio
was ~4.76. This gave a cycle efficiency of 50.7%.
13The indirect CO2 cycle was also simulated at 8 MPa for comparison. The mass
flow rate was unchanged and the optimal pressure ratio was ~6.8. This gave a
cycle efficiency of 46.4%. This is closer to the other working fluid efficiencies.
The other working fluids are insensitive to system pressure while an efficiency
gain can be accomplished by increasing the pressure for CO2.
Assuming similar pressure drops in the heat exchangers and the same turbomachinary
efficiencies, helium, nitrogen, and CO2 at 8MPa all have approximately the same cycle
efficiency. However, the CO2 at 20 MPa has a ~4% higher efficiency than the other
cycles due to the decreased compression work for the cycle as seen in Table 2.1-2.
Helium and nitrogen are insensitive to maximum system pressure while an efficiency
gain can be accomplished by increasing the pressure for CO2.
The reduced compression work due to compression around the critical point of CO2
makes it an attractive option for a secondary working fluid. However, CO2 is not inert
compared with other fluids such as helium and nitrogen and more advanced materials
are required to address potential corrosion issues. The tradeoff of increased capital cost
and increased cycle efficiency would need to be studied further if a more in-depth
economic analysis were to be carried out.
Table 4 compares the cycle efficiency, the work duty of the turbine and compressor, and
the total heat transfer area ratio for different working fluids in the power conversion unit.
Pressure drops through the IHX and recuperator were calculated for various working
fluids using a shell-tube type heat exchanger. Relative total area ratio can be varied
depending on the final selection of heat exchanger. Overall heat transfer coefficients, U,
were calculated and the ideal heat transfer area (assuming perfect counterflow) of the
helium indirect cycle was used as a basis for comparing area ratios for each working
fluid. As shown in Table 4, Nitrogen as a working fluid in the PCS needs the largest heat
exchanger size compared with those of other fluids studied. The Framatome indirect
cycle design therefore uses a helium-nitrogen mixture to increase the gas thermal
conductivity and reduce the heat exchanger size.
UA was calculated using the following equation:
1
Ui (7)
1 D x Di
i w
h i DL k m Doh o
where Ui is an universal heat transfer coefficient based on an inner diameter, h is the
heat transfer coefficient, x is thickness, k is thermal conductivity, i, o, L are inside,
outside, and log-mean, respectively. D L is defined as:
Do Di
DL (8)
§D ·
ln ¨¨ o ¸¸
© Di ¹
14Table 4. Comparison of cycles for different working fluids
Overall
Total
Cycle Turbine Compressor Total UA1 U
Working Fluid 2 Area
Efficiency Work (MW) Work (MW) (MW/K) (W/m K
Ratio2
)
He Direct (No Recup: 42.9 204.6 0.65
IHX) 50.9% 542.9 237.7
IHX: 24.2 216.9
1
He Indirect 48.7% 575.4 256.5 Recup: 43.1 204.6
IHX: 13.7 186.7
1.32
N2 Indirect 45.5% 557.3 258.3 Recup: 58.9 166.6
IHX: 24 170.3
145.3 1.18
CO2 (20 MPa) 50.7% 497.2 167. Recup: 35.1
1
UA=Universal heat transfer coefficient * heat transfer area, assuming perfect
counterflow.
2
Area Ratio: Total Heat Transfer Area of Working Fluid / Total Heat Transfer Area
of Helium Indirect
Preliminary conclusions drawn from this investigation are:
x Among the three working fluids studied for the indirect PCS, supercritical CO2
has the highest cycle efficiency due to less compression work resulting from higher
supercritical CO2 densities. . Supercritical CO2 also results in the smallest
turbomachinary components.
x Helium direct cycle eliminates an IHX and consequently requires the smallest
heat transfer area due to the higher heat capacity and thermal conductivity than those of
other fluids.
x For the final selection of the best working fluid, or fluid mixture, trade-off studies
need to be performed for efficiency, capital cost, maintenance cost, the stability of fluids
through compressor, potential leakage from PCS, and other relevant issues. This project
will include some of these issues later in FY-05 efforts.
2-3-2 Effect of intercoolers
The objective of this task is to find the cycle efficiency based on a variable number of
intercooler in the secondary side of the HTGR or NGNP. In order to make a comparison
with the supercritical CO2 cycle, cases using the helium Brayton cycle were made as a
baseline. Then more complicated CO2 cycle will be investigated in the FY-05 first
quarter, and will be reported next quarter.
To determine the effects of interstage cooling on cycle efficiency 1, 2 and 3 intercoolers
were added to the basic indirect recuperated Helium cycle. The pressure drop through
the precooler was set at 20 kPa. With a 1-intercooler layout the intercooler pressure
drop was set to 50 kPa. With 2 intercoolers the first intercooler pressure drop was set to
37 kPa and the second intercooler set to a pressure drop of 50 kPa. With a 3-intercooler
15layout the first, second and third intercooler pressure drops were set to 30, 40 and 50
kPa, respectively. These pressure drops were chosen because they are representative
of pressure drops used in the MIT studied on an indirect Helium Brayton cycle with a
maximum system pressure of 8 MPa [Wang, 2003].
A base design for each cycle was determined and input into HYSYS. HYSYS was then
used to simulate and optimize each cycle.
The base cycle used in this study was the indirect Helium cycle and the operating
conditions used are summarized in Table 5. The efficiency without intercooling was
45.19%. The efficiency with 1,2 and 3 intercoolers was 48.25%, 48.92% and 49.07%,
respectively.
Table 5 Cycle conditions used for intercoolers
Condition Value
Reactor Power 600 MW
Reactor Outlet Temp 900 C
Turbine Polytropic Efficiency 92%
Compressor Polytropic Efficiency 90%
IHX Effectiveness 90%
Recuperator Effectiveness 95%
IHX Primary Side Pressure Drop 150 kPa
IHX Secondary Side Pressure Drop 175 kPa
Recuperator Hot Side Pressure Drop 90 kPa
Recuperator Cold Side Pressure Drop 50 kPa
Precooler Pressure Drop 20 kPa
Intercooler Pressure Drop 30 kPa
Compressor Inlet Temp 28 C
Pressure Ratio 2.1
2-3-2 Effect of reheat
The objective of this task is to determine how much a reheat option can enhance the
cycle efficiency and to find out technical issues associated with the reheat option. For
these calculations, a cycle similar to the proposed Advanced High Temperature (AHTR)
(Forsberg et al., 2004, Peterson, 2002) was used with Flibe, a fluoride molten salt, as a
coolant fluid in the primary side and helium in the Brayton cycle.
Theoretically a combination of reheat and intercooling increases the cycle efficiency in a
closed cycle, the implications have not been explored. Multiple-reheat is technically
viable for closed gas cycles, as demonstrated by the PBMR turbomachinary design with
three separate turbines. For gas-cooled reactors, a multiple reheat option may not be
practical due to higher-pressure loss associated with gases, i.e., helium, supercritical
CO2, and nitrogen. However, molten coolants can transport heat with low pumping
power requirement, which becomes very attractive without any consideration of material
problems associated with molten coolants at high temperatures.
Figure 15 shows the layout of the HYSYS simulation. In the primary side, stream 1 to 6
has Flibe as a coolant and in the secondary side, streams 7 through 21 has helium as a
working fluid. The cycle efficiency from this simulation is 56%, which is much higher
16than helium-helium cycle or helium-CO2 cycle. The detailed operating conditions are
summarized in Table 6. Similar calculations are being performed now and it will be
reported in the next quarterly report.
Table 6. Summary of HYSYS simulation with multiple reheats.
Operating
conditions
Reactor Power 600 MW-thermal
Configuration Indirect
Mass flow of Flibe in the
1,189 kg/s
primary loop
Mass flow of helium in the
295 kg/s
secondary loop
600qC
Reactor Inlet, stream (6)
0.1MPa (1 atm)
700qC
Reactor Outlet, stream (1)
0.1 MPa (1 atm)
IHX Inlets (stream (2) to( 700qC
5)) 0.1MPa (1 atm)
HP Turbine Inlet/Outlet 602qC/ 525 C
(8) / (9) 7 MPa / 5.46 MPa
MP Turbine Inlet/Outlet 622qC/ 525 C
(10) / (11) 5.46 MPa / 4 MPa
LP Turbine Inlet/Outlet 622C/ 525 C
(12) / (13) 4 MPa / 2.93 MPa
623qC/ 525 C
Turbine Inlet/Outlet
(14) / (15) 2.92 MPa / 2.14
MPa
Recuperator Inlet/Outlet 525 C / 94 C
35qC
Compressor Inlet (17)
2.5 MPa
LP Compressor Inlet 35qC
(18) 3.24 MPa
MP Compressor Inlet 35qC
(19) 4.2 MPa
35qC/ 73 C
HP Compressor
Intlet/Outlet (20/21) 5.44 MPa/ 7.04
MPa
Outlet from Recuperator, 5040qC
shell side (7) 7 MPa
Cycle Efficiency 56 %
172 14
Spliter
Turbine Generator HP
21 Compressor
IHX
1 20
15 IC
13
3 LP 19
G MP
12 Turbine Compressor
Recuperator
Reactor
IHX
IC
11
4 MP
LP LP
10 Turbine G 18 Compressor
IHX
IC
5 9
HP G Compressor
8 Turbine
6 IHX 17
Mixer Precooler
7 16
Circulator
Figure 15. Cycle layout with multiple reheat option.
Next quarter/year activities:
x Task 2 continues with comparison of other cycle configurations.
x Other cycle configurations are a combined cycle, recompression, and multiple reheat
cycle. The cycle will be optimized using HYSYS.
If time is allowed, an intermediate flow loop heat transfer study for NGNP
hydrogen will be investigated.
Issues/concerns: There are no issues and/or concerns.
18Task 3. Materials Testing
Research on the creep behavior and corrosion resistance in supercritical CO2 of MA 754
continued during FY04. The creep behavior of both coarse-grained as well as fine-
grained MA 754 was documented. Creep microstructures were documented and
fracture analysis was carried out on failed creep samples. A manuscript documenting
the results was prepared and submitted to a peer-reviewed journal for publication.
Final modifications were made to a supercritical CO2 loop and the corrosion behavior of
MA 754 in flowing supercritical CO2 at 1000oC and 1500 psi was documented.
Experiments were carried out at exposure times ranging from 47 to 335 hours. The
time-averaged corrosion rate was found to decrease as the exposure time increased.
The corrosion rate at the 335-hour exposure test equated to less than 1 mm/year.
Microscopic examination indicated that a corrosion layer formed and grew slowly. The
corrosion layer also acted to protect the base material from further corrosion.
Overall, it was concluded that MA 754 possessed high creep resistance at 1000oC,
better than other high temperature metallic alloys, and acceptable corrosion resistance
to supercritical CO2. From these results it was determined that the study of creep and
corrosion resistance of MA 758, that has a higher chromium content for added corrosion
resistance, may not be necessary. This issue is being worked with the sponsor.
The detailed results of work performed during FY04 are given below for the various
materials-related tasks.
Task 3-1-2 High temperature mechanical and creep properties of coarse-grained MA
754
During FY04, creep testing of annealed (coarse-grained) MA 754 specimens with both
longitudinal and transverse orientations was completed. Creep and stress rupture data
are graphically presented in Figures 16 through 19. In the longitudinal direction, high
stress exponents are observed at the temperatures studied, consistent with the
threshold behavior for this alloy. At a fixed stress, creep rates in the transverse
orientation are much higher than in the longitudinal, in some cases greater than an order
of magnitude. The stress exponents in the transverse direction decrease with increasing
temperature; at temperatures of 900 and 1000°C the exponents are sufficiently low (less
than 10) that threshold behavior is not observed. The reduction in stress exponent is
believed to result from increased grain boundary diffusion and sliding at the higher
temperatures.
19Annealed MA 754, Longitudinal
-4
10
n = 30
-5
10
Minimum Creep Rate (sec )
n = 41
-1
-6
10
n = 39
-7
10
-8
10
-9 800°C
10 900°C
1000°C
-10
10
100 200 300
Stress (MPa)
Figure 16: Minimum creep rates in coarse-grain MA 754, longitudinal orientation.
Annealed MA 754, Transverse
-6
10
800°C
900°C n = 9.3
1000°C
Minimum Creep Rate (sec )
-7
-1
10
n = 4.9
-8
10
n = 24.2
-9
10
-10
10
40 50 60 70 80 90100 200 240
Stress (MPa)
Figure 17: Minimum creep rates in coarse-grain MA 754, transverse orientation.
20Annealed MA 754, Longitudinal
300
800°C
900°C
1000°C
200
Stress (MPa)
100
-1 0 1 2 3 4
10 10 10 10 10 10
Time to Rupture (hr)
Figure 18: Stress-rupture behavior of coarse-grain MA 754, longitudinal orientation.
Annealed MA 754, Transverse
300
200
Stress (MPa)
100
80
60
40
800°C
900°C
1000°C
20
0 1 2 3 4
10 10 10 10 10
Time to Rupture (hr)
Figure 19: Stress-rupture behavior of coarse-grain MA 754, transverse orientation.
The creep and elevated temperature mechanical test data were summarized in a paper
that was accepted for publication in Metallurgical and Materials Transactions A. The
abstract of the paper follows:
21Terry C. Totemeier and Thomas M. Lillo, “Effect of Orientation on the Tensile and Creep
Properties of Coarse-Grained INCONEL Alloy MA754”.
Elevated temperature tensile and creep-rupture tests were performed on INCONEL
MA754 in longitudinal and transverse orientations at temperatures from 700 to 1000°C.
Due to a higher grain boundary density perpendicular to the applied stress axis, the
transverse orientation was weaker and less ductile than the longitudinal orientation. This
effect was especially pronounced for creep tests at 900 and 1000°C. Threshold creep
behavior was observed for the longitudinal orientation with stress exponents ranging
from 29 to 40. Stress exponents in the long transverse orientation ranged from 24 at
800°C to 5 at 1000°C, indicating a temperature-varying deformation mechanism. Creep
ductility in the transverse direction was extremely low, less than 1 pct for higher
temperature, lower stress conditions. Failure was controlled by grain boundary
separation for all transverse specimens. Despite the relative weakness of the transverse
orientation, MA754 maintains a clear strength advantage over other wrought alloys being
considered for advanced power plants.
The full paper is attached as an appendix since it gives greater detail and discussion of
the results.
Task 3-1-3 Mechanical and creep properties of fine-grained MA 754
Fine grained MA754 was acquired from the
vendor and characterization of the
microstructure was performed. Fine-grained 1 micron
MA754 is heat treated at high temperature to
produce coarse-grained (creep resistant)
MA754. Figure 20 shows a TEM micrograph of
fine-grained MA754 with the grain size on the
order of 0.5-1.0 Pm. This is in contrast to the
coarse-grained MA754, which exhibited highly
elongated grains on the order of millimeters in
length.
Tensile and creep specimens were fabricated
to investigate the high temperature mechanical Figure 20. TEM micrograph of fine-
strength and creep resistance of this material. grained MA754.
The creep resistance of the fine-grained MA754
is expected to be much lower than its large-grain counterpart. However, the creep
properties of fine-grain MA754 must be known since joining may have to occur while in
the fine grained state and then followed by an anneal to generate large creep resistant
grains.
Elevated temperature tensile tests were completed on transverse specimens at 25, 800,
900, and 1000°C and a strain rate of 10-3 sec-1. The test results are listed in Table 7.
The fine-grained material is stronger than the coarse-grain material at room temperature
(~1275 MPa vs. 900 MPa, respectively) but considerably weaker at elevated
temperature (67MPa vs. 900 MPa at 1000oC, respectively). Transverse tensile ductility
at elevated temperature is significantly higher than coarse-grain material (~20% vs.
~10% at 1000oC, respectively).
22Creep testing of fine-grained MA754 in the transverse orientation was also completed.
The results indicate that the fine-grained material is significantly weaker than coarse-
grained, even in the transverse orientation. The results of creep tests are listed in Table
8. The minimum creep rates for the fine-grained MA 754 for temperatures between 800-
1000oC are shown in Figure 21. The stress exponents are slightly lower than those for
the coarse-grain material in the transverse orientation.
Table 7: MA754 Fine-Grained Tensile Data
Specimen Test Temperature Modulus Yield Strength UTS Ductility RA
(°C) (GPa) (MPa) (MPa) (%) (%)
MA754F-T-1 25 225 1170 1257 7.7 16
MA754F-T-2 25 231 1203 1297 8.8 18
MA754F-T-3 800 47 118 138 40 46
MA754F-T-4 800 39 141 148 40 45
MA754F-T-5 900 27 90 91 32 51
MA754F-T-6 900 39 86 89 38 49
MA754F-T-7 1000 25 64 67 19 27
MA754F-T-8 1000 35 60 65 19 34
MA754F-T-9 1000 48 60 67 20 34
Table 8: MA754 Fine-Grained Creep Data – Transverse Orientation
Test/Specimen Test Minimum Creep Time to
ID Orientation Temperature Stress Rate Rupture Ductility RA
(°C) (MPa) (sec-1) (hr) (%) (%)
MA754F-T-16 Transverse 800 45 5.40E-09 268 0.7 0
MA754F-T-15 Transverse 800 60 7.30E-08 35.4 1.5 0
MA754F-T-11 Transverse 800 74 7.90E-07 6.4 3.2 0
MA754F-T-12 Transverse 800 92 0.9 13.5 15
MA754F-T-14 Transverse 900 25 3.10E-09 1138 2.4 0
MA754F-T-18 Transverse 900 35 3.50E-08 105 1.6 0
MA754F-T-13 Transverse 900 45 1.70E-07 15.4 1.6 0
MA754F-T-10 Transverse 900 64 5.50E-06 1.1 3.2 0
MA754F-T-17 Transverse 1000 10 7.80E-09 > 1670 > 24 0
MA754F-T-17 Transverse 1000 20 1.20E-07 83 5.4 0
23You can also read