Establishing Heat Alert Thresholds for the Varied Climatic Regions of British Columbia, Canada - MDPI
←
→
Page content transcription
If your browser does not render page correctly, please read the page content below
International Journal of
           Environmental Research
           and Public Health

Article
Establishing Heat Alert Thresholds for the Varied
Climatic Regions of British Columbia, Canada
Kathleen E. McLean 1, *, Rebecca Stranberg 2 , Melissa MacDonald 3 , Gregory R. A. Richardson 2 ,
Tom Kosatsky 1 and Sarah B. Henderson 1
 1    British Columbia Centre for Disease Control, 655 West 12th Ave, Vancouver, BC V5Z 4R4, Canada;
      tom.kosatsky@bccdc.ca (T.K.); sarah.henderson@bccdc.ca (S.B.H.)
 2    Climate Change and Innovation Bureau, Healthy Environments and Consumer Safety Branch,
      Health Canada, 269 Laurier Avenue West, Ottawa, ON K1A 0K9, Canada;
      rebecca.stranberg@canada.ca (R.S.); gregory.richardson@canada.ca (G.R.A.R.)
 3    National Health and Air Quality Program, Meteorological Service of Canada, Environment and Climate
      Change Canada, 45 Alderney Dr, Dartmouth, NS B2Y 2N6, Canada; melissa.macdonald@canada.ca
 *    Correspondence: kathleen.mclean@bccdc.ca; Tel.: +1-604-707-2424

 Received: 31 July 2018; Accepted: 18 September 2018; Published: 19 September 2018

 Abstract: Following an extreme heat event in 2009, a Heat Alert and Response System (HARS) was
 implemented for the greater Vancouver area of British Columbia (BC), Canada. This system has
 provided a framework for guiding public health interventions and assessing population response
 and adaptation to extreme heat in greater Vancouver, but no other parts of BC were covered by
 HARS. The objective of this study was to identify evidence-based heat alert thresholds for the
 Southwest, Southeast, Northwest, and Northeast regions to facilitate the introduction of HARS across
 BC. This was done based on a national approach that considers high temperatures on two consecutive
 days and the intervening overnight low, referred to as the high-low-high approach. Daily forecast and
 observed air temperatures and daily mortality counts for May through September of 2004 through
 2016 were obtained. For each date (dayt ), dayt−2 forecasts were used to assign high temperatures
 for dayt and dayt+1 and the overnight low. A range of high-low-high threshold combinations was
 assessed for each region by finding associations with daily mortality using time-series models and
 other considerations. The following thresholds were established: 29-16-29 ◦ C in the Southwest;
 35-18-35 ◦ C in the Southeast; 28-13-28 ◦ C in the Northwest; and 29-14-29 ◦ C in the Northeast.
 Heat alert thresholds for all regions in BC provide health authorities with information on dangerously
 hot temperature conditions and inform the activation of protective public health interventions.

 Keywords: extreme heat; temperature; mortality; public health surveillance; heat alert and response
 system; climate change; early warning systems

1. Introduction
     Exposure to extreme heat has direct and indirect health effects. Heat stress can directly induce
illnesses such as heat edema, rash, cramps, syncope, exhaustion, and heat stroke [1]. Heat stress can
indirectly increase the likelihood of severe adverse health events including cardiovascular mortality [2],
stroke, and renal colic [3]. There is also increased risk of adverse maternal [4] and birth outcomes [5],
including gestational diabetes [4], sudden infant death syndrome [5], term placental abruption [6],
and early delivery [7]. Use of antipsychotics, antidepressants, diuretics [8], and illicit substances
such as cocaine [9] can increase the likelihood of experiencing heat-related illness or experiencing
adverse health events because these drugs interfere with natural thermoregulatory mechanisms [1].
This spectrum of health outcomes is influenced by the risk and protective factors within each
population, and the intensity, duration, and timing of the heat event.

Int. J. Environ. Res. Public Health 2018, 15, 2048; doi:10.3390/ijerph15092048   www.mdpi.com/journal/ijerph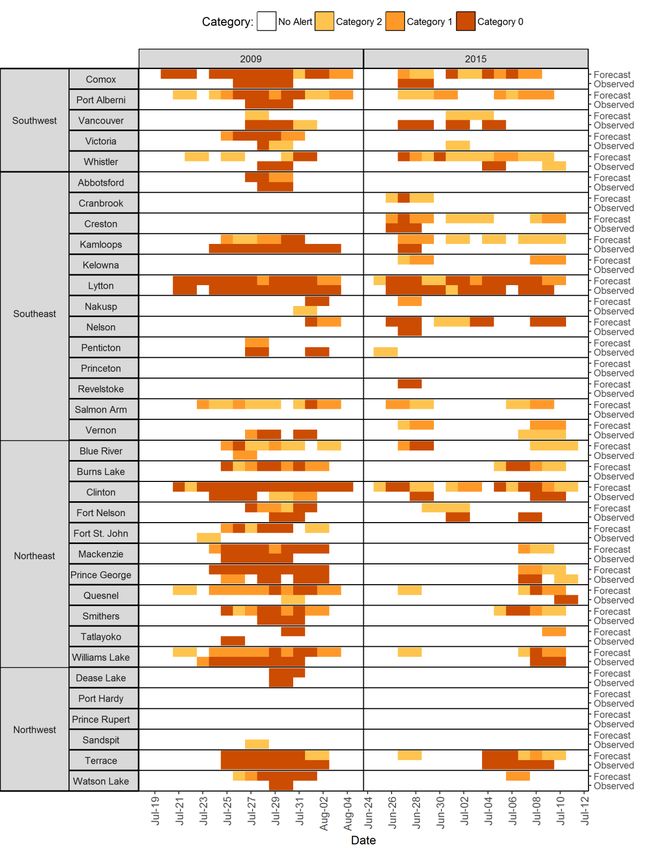
Int. J. Environ. Res. Public Health 2018, 15, 2048                                                  2 of 14

      Extreme heat is a leading cause of illness and death from weather-related hazards in Canada.
For example, there were an estimated 114 excess deaths during a 5-day event in greater Vancouver,
British Columbia (BC) in the summer of 2009 [10]. Similarly, there were an estimated 106 excess deaths
during the 3-day event in Montréal, Quebec in the summer of 2010 [11]. In addition, mean estimates for
the Canadian cities of Montréal, Toronto, Ottawa, and Windsor were 121, 120, 41, and 37 excess annual
heat-related deaths, respectively, between 1954 to 2000 [12]. Heat exposure has also been associated
with increased ambulance dispatches [13] and emergency room visits [14]. For example, a study in
Toronto found an increase (95% confidence interval) of 32% (24%, 41%) in ambulance dispatches for
heat-related illnesses associated with every 1 ◦ C increase in mean temperature [13]. Another study
in rural southern Ontario found that the average rate of emergency room visits was 11% (7%, 15%)
higher during heat events compared with average summer temperatures [14].
      Maximum temperatures during a heat event are strongly associated with the magnitude of the
observed health outcomes. The temperature thresholds at which Canadian populations exhibit
increased morbidity and mortality vary by location across the country. For example, mortality
curves generated for 21 Canadian cities showed an increase in relative risk above baseline at mean
temperatures as low as 20 ◦ C (Calgary, Alberta) and as high as 27 ◦ C (Windsor, Ontario) [15]. Within
BC, a similar study found increased risk over maximum apparent temperatures as low as 14 ◦ C in
the north, and as high as 22 ◦ C in the south [16]. This variability is due to several factors, including:
different adaptive capacities, such as access to air conditioners [17]; population and demographic
differences; historical meteorological events, especially those hot enough to drive adaptation activities;
and, most importantly, historical climate. To account for all of these factors, heat alert thresholds would
be expected to differ by region [18].
      Environment and Climate Change Canada (ECCC) is responsible for issuing timely weather
forecasts, warnings, and alerts across Canada, including heat alerts. Prior to 2015, ECCC issued heat
alerts using a single national criterion based on the Canadian humidex, without consideration of
different climates or population responses. At present, ECCC is modernizing the national heat alert
program to incorporate regional climatology, health evidence, heat event duration, and overnight
temperatures. Under this updated program, heat alerts are issued based on forecast high temperatures
for two consecutive days and the intervening overnight low (referred to herein as the high-low-high
approach). In some jurisdictions, ECCC has partnered with provincial public health agencies and
Health Canada to complete the analyses necessary to identify evidence-based high-low-high thresholds.
In other regions, thresholds are currently based on guidance from the World Health Organization
(WHO) using the 95th percentiles of daily high and low temperatures [19].
      The BC Centre for Disease Control (BCCDC) collaborated with ECCC, Health Canada, and BC
health authorities to establish high-low-high alert thresholds across all regions of BC. As of 2017,
the only operational Heat Alert and Response System (HARS) in BC was restricted to the greater
Vancouver area [10]. Within this HARS, a heat alert was issued on dayt for dayt+1 when the average of
the dayt 14:00 observed temperature and dayt+1 forecast high temperature equaled or exceeded 34 ◦ C
at Abbotsford airport or 29 ◦ C at Vancouver airport [20]. These thresholds were used from 2011 to
2017. Although no heat alerts were issued during this period, temperatures approached the threshold
values on multiple occasions. Whenever this occurred, the BCCDC contextualized the temperature
data with real-time data on registered deaths and an evaluation of results from a mortality nowcasting
model and shared this information with health authority partners.
      At the end of every summer, the BCCDC assessed the operation of the greater Vancouver HARS
through retrospective evaluation of forecast temperatures, observed temperatures, and observed
mortality to ensure that no important events were missed. This assessment process identified a period
of prolonged heat in late June and early July 2015 that affected greater Vancouver but was not identified
in real-time. The same episode also affected other regions of BC that did not have established HARS.
Previous work has shown that populations in the coastal and northern regions of BC are susceptible
Int. J. Environ. Res. Public Health 2018, 15, 2048 3 of 14
to heat impacts despite the temperate climate of these regions [16], further highlighting the need for
more comprehensive HARS in the province.
One of the first steps in establishing HARS is to determine appropriate heat alert thresholds for
different regions with varying climates and vulnerabilities, and a number of different approaches
have been used worldwide. Synoptic classification systems identify air-mass categories using several
meteorological factors and then assess excess mortality within each category [19,21]. Other systems
model the relationship between mortality and maximum temperatures, minimum temperatures,
or apparent temperatures, using single-day values or multi-day averages [22,23]. Many systems have
different alert levels (i.e., heat warning versus heat emergency) with thresholds for each level reflecting
a certain percentage increase in morbidity or mortality, which varies by jurisdiction [19,21]. In Canada,
the new high-low-high approach being used by ECCC required that we use methods tailored to
this approach. Here we describe the process of establishing the high-low-high thresholds for four
regions of BC. For each region, we identified thresholds that were (1) reliably associated with increased
population mortality, and (2) unlikely to cause warning fatigue. We also discuss how such thresholds
should be used for ongoing assessment of health vulnerabilities and climate change adaptation in the
context of public health surveillance.
2. Materials and Methods
The R statistical computing environment version 3.4.2 (28 September 2017) (R Foundation
for Statistical Computing, Vienna, Austria) was used for all data management, analysis,
and visualization [24]. Sample code and data for the main threshold analyses are included in the
Supplementary Materials.
2.1. Study Context
The province of BC, which covers a land area of 944,735 km2 , is located on the west coast of
Canada. The estimated 2017 provincial population was 4.84 million, of which 2.78 million lived in
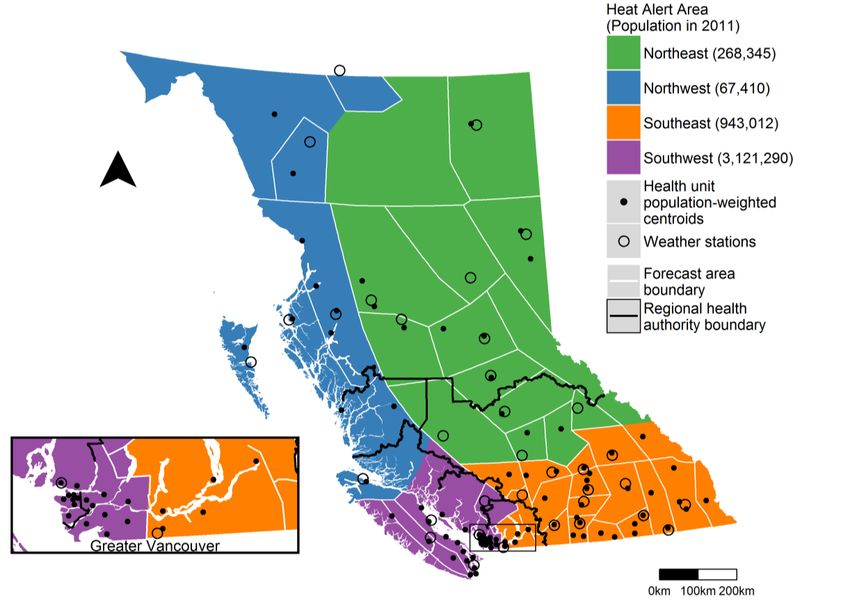
the greater Vancouver area on the southwestern coast (Figure 1). In general, the climate along the
entire BC coast is temperate throughout the year, while the inland climate is more extreme with colder
winters and hotter summers. Winter conditions are typically coldest in the north, especially in the
Boreal region. Summer conditions are typically hottest throughout the southern interior, especially in
the dry plateau between the Coast Mountain and Rocky Mountain ranges.
2.2. Heat Alert Areas
In collaboration with ECCC, the BCCDC grouped the 53 provincial forecast regions into four
climatologically similar Heat Alert Areas (HAAs). We then assigned each of the 89 provincial health
units to one of the HAAs using the spatial distribution of the 2011 census population (Figure 1).
First, we assigned the populations of all 7582 dissemination areas in BC (each with 400–700 residents)
to their geographic centers. Next, we used all dissemination areas within the boundary of each health
unit to calculate its population-weighted center. Finally, each health unit was assigned to the HAA
that contained its population-weighted center. Populations within each HAA ranged from 67,410 in
the Northwest to 3,121,290 in the Southwest, where the latter includes most of the densely populated
greater Vancouver area.high (maximum) and low (minimum) temperatures for one weather station in each forecast area
over the same period (Figure 1). All forecast and observed temperatures were received as integer
values in degrees Celsius (°C). For each date of the study period (dayt), we used the dayt−2 afternoon
forecast to assign the high-low-high forecast temperatures for dayt and dayt+1. For each forecast area,
Int.we then computed
J. Environ. the 2018,
Res. Public Health Pearson correlation coefficient for the forecast (on dayt−2) and observed
15, 2048 4 of 14(on
dayt) temperatures and the slope of the relationship between them.
Figure
Figure 1. Map
1. Map of Heat
of Heat Alert
Alert Areas,
Areas, forecast
forecast areas,
areas, weather
weather stations,
stations, health
health unit
unit population-weighted
population-weighted
centroids, andand
centroids, regional health
regional authority
health boundaries
authority in British
boundaries Columbia
in British Columbia(BC), Canada.
(BC), Canada.
2.3. Temperature Forecasts and Observations
2.4. Mortality
We obtained three sets of daily high and low temperature forecasts for May through September
Information on all-cause mortality was obtained from the BC Vital Statistics Agency, which
of 2004 through 2016 for 35 ECCC forecast areas (Figure 1). Official public forecasts, including
provides the BCCDC with a daily feed of registered deaths for its surveillance activities. These
temperature, are issued three times daily by ECCC at approximately 05:00, 11:00, and 16:00 local time.
anonymous data include the date of death, primary cause of death (coded according to the 10th revision
Operational meteorologists use computer models, expert knowledge of local weather, climatology,
of the International Classification of Diseases), age, sex, health unit, and residential 6-digit postal code for
and nowcasting to provide temperature forecasts for each area. In forecast areas with local effects
each decedent. Based on our previous work indicating that heat events are associated with increases in
contributing to large temperature differences across the area, exceptions are used to describe varied
both accidental and non-accidental deaths [10], our analyses used daily counts of deaths from all causes.
conditions. For example, summer forecasts for the City of Vancouver are often described as “high
All deaths in each HAA were aggregated on a daily basis, and a running 3-day sum of the daily counts
22 ◦ C except 28 ◦ C inland” to account for the cooler temperatures experienced in coastal locations
(including dayt−1, dayt, and dayt+1) was used in the analyses. This allowed us to amplify the cumulative
compared with inland locations away from sea breezes. We did not consider temperature exceptions in
effects of heat, particularly in the less populous HAAs where daily death counts are low.
these analyses, and thus would have used the forecast high of 22 ◦ C from the example above. We also
obtained daily observations
2.5. Time-Series Modelling of high (maximum) and low (minimum) temperatures for one weather
station in each forecast area over the same period (Figure 1). All forecast and observed temperatures
We tested
were received a rangevalues
as integer of high-low-high threshold
in degrees Celsius combinations
(◦ C). for of
For each date each
the HAA,
study chosen
period from
(dayt ),the
distributions of summertime temperatures observed in each area. For each date (dayt), we assigned a
we used the dayt−2 afternoon forecast to assign the high-low-high forecast temperatures for dayt and
dayheat alert category based on the forecast temperatures. This category was equal to the sum of the total
t+1 . For each forecast area, we then computed the Pearson correlation coefficient for the forecast
(on dayt−2by
degrees which
) and the daytime
observed (on day highs and the overnight lows deviated below the candidate high-low-high
t ) temperatures and the slope of the relationship between them.
thresholds. If a forecast was greater than or equal to its corresponding threshold, it would contribute 0
2.4. Mortality
Information on all-cause mortality was obtained from the BC Vital Statistics Agency,
which provides the BCCDC with a daily feed of registered deaths for its surveillance activities.
These anonymous data include the date of death, primary cause of death (coded according to the 10th
revision of the International Classification of Diseases), age, sex, health unit, and residential 6-digit
postal code for each decedent. Based on our previous work indicating that heat events are associatedInt. J. Environ. Res. Public Health 2018, 15, 2048 5 of 14
with increases in both accidental and non-accidental deaths [10], our analyses used daily counts of
deaths from all causes. All deaths in each HAA were aggregated on a daily basis, and a running 3-day
sum of the daily counts (including dayt−1 , dayt , and dayt+1 ) was used in the analyses. This allowed us
to amplify the cumulative effects of heat, particularly in the less populous HAAs where daily death
counts are low.
2.5. Time-Series Modelling
We tested a range of high-low-high threshold combinations for each HAA, chosen from the
distributions of summertime temperatures observed in each area. For each date (dayt ), we assigned
a heat alert category based on the forecast temperatures. This category was equal to the sum of
the total degrees by which the daytime highs and the overnight lows deviated below the candidate
high-low-high thresholds. If a forecast was greater than or equal to its corresponding threshold,
it would contribute 0 ◦ C to the total. If a forecast was 1 ◦ C lower than its threshold, it would contribute
1 ◦ C to the total, and so on. The total sum of these differences was used to assign dates to heat alert
categories as follows: Category 0 = 0 ◦ C; Category 1 = 1 ◦ C; Category 2 = 2 ◦ C; and Category 3 =
3 ◦ C or more (Table 1). This approach was taken to evaluate the effects of scenarios when forecasts
nearly reached the threshold values and to account, in part, for the variability in forecast values within
forecast areas.
Table 1. Example showing how different hypothetical scenarios would be categorized into heat alert
categories 0, 1, 2, or 3 based on a high-low-high heat alert threshold of 30-15-30 ◦ C.
Overnight Low Category (Sum of
Dayt High (Deviation Dayt+1 High (Deviation
Scenarios (Deviation below Deviation below
below Threshold) below Threshold)
Threshold) Threshold, Maximum of 3)
Example
30 15 30 -
threshold values
Scenario 1 31 (0) 16 (0) 34 (0) 0
Scenario 2 30 (0) 15 (0) 30 (0) 0
Scenario 3 29 (1) 16 (0) 30 (0) 1
Scenario 4 32 (0) 14 (1) 32 (0) 1
Scenario 5 31 (0) 17 (0) 28 (2) 2
Scenario 6 32 (0) 14 (1) 29 (1) 2
Scenario 7 29 (1) 14 (1) 29 (1) 3
Scenario 8 28 (2) 16 (0) 29 (1) 3
Scenario 9 30 (0) 15 (0) 27 (3) 3
Scenario 10 29 (1) 14 (1) 28 (2) 3
We estimated the effect of forecast temperatures on mortality by constructing time-series models
with the running 3-day sum of mortality as the response variable and the heat alert category as the
explanatory variable. We focused on forecast temperatures for these analyses because heat alerts will
always be generated using such uncertain data. We used generalized linear models with a natural cubic
spline having six degrees of freedom to account for long-term temporal trends. The resulting effect
estimates were the relative rates of mortality associated with Category 0, Category 1, and Category 2
heat, all compared with Category 3. The analyses were run for each of the 35 forecast areas, where heat
alert categories for the area were regressed against all deaths in the HAA to which it belonged. Finally,
we combined the model results for forecast areas in the same HAA using random effects meta-analysis
from the R meta package [25].
2.6. Identification of Heat Alert Thresholds
To evaluate the high-low-high combinations, we generally considered the following features as
desirable in the following order: (1) minimization of warning fatigue, such that health authorities and
the general public would retain confidence in the heat alerting system; (2) threshold values at or over
the 95th percentile of the distribution, as per WHO guidelines [19]; (3) at least a 5% increase in all-cause
mortality; (4) an increase in risk across Category 0, Category 1, and Category 2 heat; and (5) consistencyInt. J. Environ. Res. Public Health 2018, 15, 2048 6 of 14
with neighboring Canadian jurisdictions (i.e., Alberta, Yukon, and the Northwest Territories). For all
high-low-high combinations, we assessed the potential for warning fatigue by identifying the number
of times a heat alert would have been issued under those thresholds using both observed and forecast
temperatures. Sets of days that met or exceeded the thresholds with a one-day gap between them
were counted as a single warning because that is how ECCC would operate in practice. Based on
these analyses, the BCCDC recommended thresholds for each HAA to ECCC, which then finalized the
values following internal and external operational review.
2.7. Sub-Analyses
We conducted sub-analyses for age at death, place of death, and within-season variability
using the finalized heat alert thresholds. For these analyses, we used heat alert categories based
on observed temperatures, and combined them into heat events (Categories 0–2) and other summer
days (Category 3). We focused on observed temperatures for these analyses because we wanted to
understand the actual effects of hot days. In all other ways, the sub-analyses were the same as the
analyses done for threshold identification using forecast temperatures. For age at death, we constructed
models separately for deaths at all ages and for deaths in those aged 65–75 years based on previous
work indicating this age range being at higher risk [26]. For place of death, we constructed models
separately for deaths that occurred in all locations, out of hospital (including deaths at residential care
facilities), and out of care (deaths at home or the community). To examine within-season variability,
we constructed models separately for deaths that occurred during May–September (entire season),
May–July (early season), and July–September (late season).
3. Results
3.1. Observed and Forecasted Temperatures
Observed summertime daily lows from 2004 to 2016 ranged from −14.5 ◦ C to 26.6 ◦ C across
BC, while observed daily highs ranged from 0.5 ◦ C to 42 ◦ C. The 95th percentiles of observed low
temperatures were generally highest in the Southwest (15 ◦ C) and Southeast (16 ◦ C) HAAs, and lowest
in the Northeast (13 ◦ C) and Northwest (14 ◦ C) HAAs. The 95th percentiles of observed high
temperatures were generally lowest in the Northwest HAA (25 ◦ C), similar in the Northeast and
Southwest HAAs (30 ◦ C), and highest in the Southeast HAA (34 ◦ C). The forecast low and high
temperatures followed the same pattern as the observed temperatures.
In all 35 forecast areas, forecast low temperatures were positively correlated with observed low
temperatures (Figure S1) and forecast high temperatures were positively correlated with observed
high temperatures (Figure S2). For overnight lows the Pearson correlation coefficients by forecast area
ranged from 0.72 to 0.91 (Figure S1), and for daytime highs the correlation coefficients ranged from
0.78 to 0.92 (Figure S2). For the linear relationship between observed (dependent variable) and forecast
(independent variable) temperatures, the mean slope was 0.93 for both daily lows and daily highs.
Forecast lows over-predicted observed lows in 89% of forecast areas (Figure S1), and forecast highs
over-predicted observed highs in most forecast areas (97%) (Figure S2).
3.2. Heat Alert Thresholds
We established the following high-low-high heat alert thresholds: 29-16-29 ◦ C in the Southwest;
35-18-35 ◦ C in the Southeast; 29-14-29 ◦ C in the Northeast; and 28-13-28 ◦ C in the Northwest (Figure 2,
Figures S4–S7). In the Southwest HAA the relative rate of mortality (95% confidence interval) for
Category 0 compared with Category 3 was 1.08 (1.04, 1.13) (Figure 2). In comparison, Category 1
was 1.06 (1.01, 1.12) and Category 2 was 1.02 (1.00, 1.04) (Figure 2). There were other high-low-high
combinations that followed the same pattern in the Southwest HAA (Figure S4), but 29-16-29 ◦ C was
most consistent with the criteria described above. In the Southeast HAA the relative rates of mortality
for Categories 0, 1, and 2 were 1.08 (1.05, 1.11), 1.04 (1.01, 1.07), and 1.06 (1.03, 1.09), respectivelyInt. J. Environ. Res. Public Health 2018, 15, 2048 7 of 14
(Figure 2). There were significant associations for all high-low-high combinations tested for the
Southeast HAA (Figure S5), and the 35-18-35 ◦ C values were based largely on minimizing warning
fatigue. In the Northeast and Northwest HAAs, none of the relative mortality rates for any of the
categories were significant (Figure 2). In the Northeast, all values were above 1.00 and below 1.03.
In the Northwest, the value for Category 1 was less than 1.00 while the values for Categories 0 and
2 were above 1.00 but below 1.10. The 29-14-29 ◦ C and 28-13-28 ◦ C thresholds selected for these
HAAs were based on both the 95th percentile values of the observed temperatures and continuity with
warning
Int. criteria
J. Environ. from
Res. Public neighboring
Health 2018, 15, x jurisdictions. 7 of 14
Figure 2.
Figure Relative rates
2. Relative rates and
and 95%
95% confidence
confidence intervals
intervals for
for mortality
mortality during
during Category
Category 0,
0, Category
Category 1,
1,
and Category 2 heat compared with Category 3 heat using the finalized high-low-high heat
and Category 2 heat compared with Category 3 heat using the finalized high-low-high heat alert alert
thresholds in
thresholds in each
each Heat
Heat Alert
Alert Area
Area (HAA).
(HAA).
3.3. Retrospective Heat Alerts Using Forecasted and Observed Temperatures
3.3. Retrospective Heat Alerts using Forecasted and Observed Temperatures
The average number of heat alerts per year (2004–2016) based on forecast temperatures ranged
fromThe
zeroaverage number
in multiple of heat
forecast alerts
areas per in
to four year (2004–2016)
Clinton basedHAA)
(Northeast on forecast
(Table temperatures ranged
2). In 74% of forecast
from zero in multiple forecast areas to four in Clinton (Northeast HAA) (Table 2). In 74%
areas the average number of annual heat alerts based on observed temperatures was lower than thoseof forecast
areas
based the average temperatures,
on forecast number of annual heat alerts
suggesting based
a greater on observed
likelihood temperatures
of false positives (anwas lower
alert than
not being
those based on forecast temperatures, suggesting a greater likelihood of false positives (an alert not
being needed when it was issued) in these areas. In 17% of forecast areas, the average number of
annual heat alerts based on observed temperatures was higher than those based on forecast
temperatures. This suggests a greater likelihood of false negatives (an alert being missed when it
was needed) in Vancouver, Victoria, Kamloops, Penticton, Dease Lake, and Sandspit (Table 2).Int. J. Environ. Res. Public Health 2018, 15, 2048 8 of 14
needed when it was issued) in these areas. In 17% of forecast areas, the average number of annual
heat alerts based on observed temperatures was higher than those based on forecast temperatures.
This suggests a greater likelihood of false negatives (an alert being missed when it was needed) in
Vancouver, Victoria, Kamloops, Penticton, Dease Lake, and Sandspit (Table 2).
Table 2. Average number of heat alerts per year based on forecasted and observed temperatures by
forecast area from 2004 to 2016 using the finalized high-low-high heat alert thresholds.
Average Number of Heat Average Number of Heat
Heat Alert Area Forecast Area Alerts Per Year Based on Alerts Per Year Based on
Forecasted Temperatures Observed Temperatures
Comox 2 1
Port Alberni 2 0
Southwest Vancouver 1 2
Victoria 0 1
Whistler 2 1
Abbotsford 1 0
Cranbrook 2 0
Creston 2 1
Kamloops 1 2
Kelowna 1 0
Lytton 3 2
Southeast Nakusp 1 0
Nelson 2 0
Penticton 0 2
Princeton 1 0
Revelstoke 1 0
Salmon Arm 2 0
Vernon 1 1
Blue River 2 1
Burns Lake 2 0
Clinton 4 1
Fort Nelson 2 1
Fort St. John 2 1
Northeast Mackenzie 2 0
Prince George 2 1
Quesnel 3 1
Smithers 2 0
Tatlayoko 1 0
Williams Lake 3 1
Dease Lake 0 1
Terrace 3 3
Watson Lake 2 0
Northwest
Port Hardy 1 0
Prince Rupert 0 0
Sandspit 0 1
We also looked at retrospective heat alerts during two extreme heat events that affected all of
BC in 2009 and 2015 using both forecast and observed temperatures classified into the three heat
categories (Figure 3). From 19 July to 4 August 2009, 25 of the 35 (71%) forecast areas had days with
observed temperatures near to or meeting the threshold values. In 21 of those areas, the observed
temperatures coincided with periods of forecast heat, while in four areas the observed heat was not
predicted. There were also three areas for which heat was forecast but not observed. The 2015 event
was less extreme than the 2009 event. Between 25 June and 11 July 2015, only 16 of the 35 (46%) forecast
areas had at least one period of observed heat according to the heat alert thresholds. In 14 of those
locations the observations coincided with periods of forecast heat. There were 12 forecast areas for
which heat was predicted but not observed, which is a greater number of false positive warnings than
during the 2009 event (Figure 3).Int. J. Environ. Res. Public Health 2018, 15, 2048 9 of 14
Int. J. Environ. Res. Public Health 2018, 15, x 9 of 14
Figure
Figure 3. 3. Retrospective
Retrospective heat
heat alerts
alerts duringtwo
during twoextreme
extremeheat
heat eventsthat
events that affected
affected BCBC
inin 2009
2009 and
and 2015
2015
based
based onon forecasted
forecasted and
and observed
observed temperatures
temperatures andand
thethe finalized
finalized heat
heat alert
alert thresholds.
thresholds.
3.4.
3.4.Sub-Analyses
Sub-Analyses
TheTherelative
relativerate
rateofofmortality
mortalityduring
duringobserved
observedheatheatevents
events(Categories
(Categories0–2)
0–2)compared
comparedwith withallall
other
othersummer
summerdaysdays(Category
(Category3)3)waswashigher
higherfor
forthose
thoseaged
aged65–75
65–75years
yearsthan
thanfor
fordeaths
deathsatatallallages
agesinin
the Southwest and Northwest HAAs (Figure 4). There was no apparent difference
the Southwest and Northwest HAAs (Figure 4). There was no apparent difference in rates betweenin rates between
these
theseage
agegroups
groupsininthetheSoutheast
Southeastand
andNortheast
NortheastHAAs,
HAAs,and
andconfidence
confidenceintervals
intervalsoverlapped
overlappedininallall
cases. There was a consistent trend across HAAs for the sub-analysis on place of death (Figure 4),Int. J. Environ. Res. Public Health 2018, 15, 2048 10 of 14
Int. J. Environ. Res. Public Health 2018, 15, x 10 of 14
cases. There was a consistent trend across HAAs for the sub-analysis on place of death (Figure 4),
with the highest risk observed for those deaths occurring at home
home oror in
in the
the community
community (out(out of
of care).
care).
This trend was weakest in the Northwest where hot weather is rare, and strongest in the Southeast
where
where extremely
extremelyhot weather
hot is common.
weather ThereThere
is common. were consistent effects for
were consistent the entire
effects season
for the compared
entire season
with the early and late summer periods (Figure 4).
compared with the early and late summer periods (Figure 4).
Figure 4. Relative rates and 95% confidence intervals for mortality during heat events (Categories 0–2)
compared with other
Figure 4. Relative ratessummer
and 95%days (Category
confidence 3) by for
intervals agemortality
at death, during
place ofheat
death, and(Categories
events within-season
0–2)
variability usingother
compared with the finalized
summerhigh-low-high heat
days (Category 3) alert
by agethresholds.
at death, place of death, and within-season
variability using the finalized high-low-high heat alert thresholds.
4. Discussion
4. Discussion
We identified high-low-high heat alert thresholds for four regions in BC as a necessary step in
establishing HARS province-wide.
We identified high-low-high heatWe considered multiple
alert thresholds forfactors in selecting
four regions in BC theasthresholds
a necessaryincluding
step in
minimization of warning fatigue, distributions of forecast and observed temperatures,
establishing HARS province-wide. We considered multiple factors in selecting the thresholds evidence-based
associations with daily mortality,
including minimization of warning andfatigue,
consistency with neighboring
distributions of forecastCanadian jurisdictions.
and observed We are
temperatures,
confident that the
evidence-based high-low-high
associations withthresholds for the Southwest
daily mortality, and Southeast
and consistency HAAs will accurately
with neighboring Canadian
and
jurisdictions. We are confident that the high-low-high thresholds for the Southwestand
flexibly capture periods of increased risk of overall mortality. In the Northeast andNorthwest
Southeast
HAAs,
HAAs however, we didand
will accurately not observe
flexibly any consistent
capture or significant
periods of increased increases
risk ofinoverall
overallmortality.
mortality during
In the
heat events identified using the high-low-high approach. Northern BC is
Northeast and Northwest HAAs, however, we did not observe any consistent or significant sparsely populated and hot
weather
increasesis in
rare, whichmortality
overall makes it challenging
during heatto events
detect an acute temperature-mortality
identified using the high-low-high effect using these
approach.
methods.
Northern As BC such, we placed
is sparsely more emphasis
populated on other
and hot weather is factors, including
rare, which makesthe 95th percentiles
it challenging of daily
to detect an
high and low observed temperatures, and consistency with neighboring jurisdictions.
acute temperature-mortality effect using these methods. As such, we placed more emphasis on other For example,
the Northeast
factors, threshold
including the 95th 29-14-29 ◦ Cof
of percentiles is daily
one degree below
high and lowthe 95th percentile
observed of observed
temperatures, maximum
and consistency
daily ◦
temperaturesjurisdictions.
(30 C) and For oneexample,
degree above the 95th percentile of 29-14-29
observed°C minimum daily
with neighboring the Northeast threshold of is one degree
below the 95th percentile of observed maximum daily temperatures (30 °C) and one degree above
the 95th percentile of observed minimum daily temperatures (13 °C), but it is the same as the
threshold for the Northern Prairie region of the neighboring province of Alberta.Int. J. Environ. Res. Public Health 2018, 15, 2048 11 of 14
temperatures (13 ◦ C), but it is the same as the threshold for the Northern Prairie region of the
neighboring province of Alberta.
Identifying the final heat alert thresholds was a more collaborative and iterative process among
stakeholders than we can succinctly describe here. In brief, the BCCDC proposed an initial set of
thresholds to ECCC based on the reported analyses and results. The thresholds were then modified
slightly after an operational review by ECCC, and presented to the five regional health authorities,
all of which have some area in at least two of the HAAs (Figure 1). This led to further modifications,
particularly for the Southwest region where the original proposal was for 28-15-28 ◦ C. Because
the densely populated greater Vancouver area spans the Southwest and Southeast HAAs and is
administered by two different health authorities, we had to ensure that the two sets of thresholds
identified similar alert periods in the historic data. Once complete, ECCC took a number of steps to
operationalize the finalized thresholds by: (1) preparing standard operating procedures for forecasters;
(2) preparing standardized impact and call to action statements that are available to forecasters for
heat health messaging; and (3) establishing a communications strategy to ensure timely notification of
public health authorities when extreme heat is expected.
Overall, minimization of warning fatigue was the most important consideration in finalizing the
heat alert thresholds. Warning fatigue occurs when people become desensitized to warnings after
hearing recurring messages about an event that did not materialize, thereby reducing vigilance and
preparation in future [27]. Factors such as trust and credibility, over-warning, false alarms, skepticism,
and helplessness all contribute to warning fatigue, which must be managed with carefully designed
systems and risk communication strategies [27]. Too many heat alerts in a particular region could
result in warning fatigue, especially given the uncertainty of temperature forecasts. In BC we found
that forecasts consistently over-predicted the observed high and low temperatures (Figures S1 and S2).
It follows that there were more heat alerts per year based on forecast temperatures than on observed
temperatures (Table 2, Figure 3), with the exception of some forecast areas including Vancouver,
Victoria, Kamloops, and Penticton. These four areas are densely populated and located in HAAs
with significant increases in mortality when temperatures meet or exceed the heat alert thresholds,
and as such these results highlight the need for ongoing evaluation of the high-low-high thresholds
established here.
The sub-analyses provided valuable insight into the utility of the final heat alert thresholds,
particularly in the northern HAAs. First, the analysis on within-season variability suggested that
thresholds should remain the same throughout the summer. Second, the analysis by age group found
that risk was generally higher in those aged 65–75 years than risk for all ages, even in the Northwest
HAA where the relative rate of mortality for all ages was less than 1.0. This is consistent with our prior
work in the greater Vancouver area [10,26], and continues to suggest that people 65–75 years of age
are a higher risk group in BC. Equal risk between age groups in the Northeast HAA may be due to
significantly lower life expectancy in this region [28]. Finally, the analysis on location of death showed
clear and consistent patterns across all four HAAs. One hallmark of extreme heat events is an increased
number of deaths occurring at home and in the community [26,29,30]. As such, it was important for
our high-low-high thresholds to reflect this risk, even in HAAs where the overall association with
mortality was largely null. Risk of mortality at home or in the community was clearly and significantly
increased in the Northeast, Southwest, and Southeast HAAs, and elevated in the Northwest HAA.
One limitation of this work was its dependence on mortality as the indicator of population
health effects from extreme heat. There are studies of other indicators available for other Canadian
jurisdictions, including emergency room visits [14] and ambulance dispatches [13]; however, we did
not have such data available for these analyses. Future work to establish heat alert thresholds could be
strengthened by considering the combined effects of multiple outcomes that are known to be associated
with heat to ensure that identified thresholds are appropriately predictive of morbidity and mortality.
Another limitation involves the large differences in population sizes between the HAAs, which simply
reflects the reality of BC and many other places in Canada. While it may have improved the analysesInt. J. Environ. Res. Public Health 2018, 15, 2048 12 of 14
to have smaller HAAs with more evenly sized populations, it would have been too challenging for
ECCC to operationalize.
Based on previous experience in the greater Vancouver area, operational heat alert thresholds and
HARS provide a framework for routine and ongoing assessment of population response to extreme
heat. Best practice requires evaluation of the heat alert thresholds and HARS at the end of every
summer to ensure that they remain appropriately protective for the upcoming year [31]. The thresholds
presented here will first be assessed after the summer of 2018 using analyses similar to those we have
described. For each HAA, the BCCDC plans to: (1) characterize any heat alerts that occurred during the
summer in terms of forecast and observed temperatures and daily mortality; (2) identify false positive
(forecast but not observed) and false negative (observed but not forecast) heat alerts; (3) identify
anomalies in daily mortality and deaths out of care, and assess the temperatures before and during
those anomalies; (4) evaluate whether lower thresholds would capture any important events that were
missed; and (5) evaluate whether higher thresholds would reduce false positives and warning fatigue.
This type of ongoing and systematic evaluation process is critical to ensure heat alert thresholds
and HARS are effective. It can also play an important role in helping public health authorities to
track and understand the evolving relationships between temperature and population health in a
changing climate.
5. Conclusions
Identification of heat alert thresholds covering all of BC is a necessary step for establishing
HARS beyond greater Vancouver such that populations can be better protected from extreme heat.
Under the new high-low-high criteria being used by ECCC, we established very different alerting
thresholds ranging from 28-13-28 ◦ C to 35-18-35 ◦ C for the four large geographic regions of BC,
even though the overall climate of the province is temperate. We also found that the thresholds
indicated higher risk of out-of-hospital mortality, which is a hallmark of extreme hot weather events.
These findings highlight the value of data-driven methods for establishing heat alert thresholds and
associated HARS. The methods and processes applied in BC provide a concrete example that can
inform researchers, policy-makers, and public health practitioners conducting similar exercises in
other jurisdictions. They also provide a framework for ongoing assessment of health vulnerabilities
and climate change adaptation in the context of public health surveillance, as will be conducted in BC
over the coming years.
Supplementary Materials: The following are available online at http://www.mdpi.com/1660-4601/15/9/2048/
s1, Sample code and data for the main threshold analyses, Figure S1: Daily low temperature forecasts (independent
variable) and observations (dependent variable) from 2004 to 2016 in 35 forecast areas in British Columbia,
Canada, with the Pearson correlation coefficient and slope of the relationship between them, Figure S2: Daily
high temperature forecasts (independent variable) and observations (dependent variable) from 2004 to 2016 in 35
forecast areas in British Columbia, Canada, with the Pearson correlation coefficient and slope of the relationship
between them, Figure S3: Relative rates and 95% confidence intervals for mortality during Category 0, Category 1,
and Category 2 heat compared with Category 3 heat for combinations of high-low-high heat alert thresholds
in the Southwest Heat Alert Area, Figure S4: Relative rates and 95% confidence intervals for mortality during
Category 0, Category 1, and Category 2 heat compared with Category 3 heat for combinations of high-low-high
heat alert thresholds in the Southeast Heat Alert Area, Figure S5: Relative rates and 95% confidence intervals for
mortality during Category 0, Category 1, and Category 2 heat compared with Category 3 heat for combinations of
high-low-high heat alert thresholds in the Northeast Heat Alert Area, Figure S6: Relative rates and 95% confidence
intervals for mortality during Category 0, Category 1, and Category 2 heat compared with Category 3 heat for
combinations of high-low-high heat alert thresholds in the Northwest Heat Alert Area, Figure S7: Retrospective
heat alerts based on forecast and observed temperatures in the Southwest Health Alert Area from 2004 to 2016,
Figure S8: Retrospective heat alerts based on forecast and observed temperatures in the Southeast Health Alert
Area from 2004 to 2016, Figure S9: Retrospective heat alerts based on forecast and observed temperatures in
the Northeast Health Alert Area from 2004 to 2016, Figure S10: Retrospective heat alerts based on forecast and
observed temperatures in the Northwest Health Alert Area from 2004 to 2016.
Author Contributions: Conceptualization, M.M. and S.B.H.; Data curation, K.E.M.; Formal analysis, K.E.M.;
Funding acquisition, T.K. and S.B.H.; Methodology, S.B.H.; Project administration, S.B.H.; Supervision, M.M.,
G.R.A.R. and S.B.H.; Visualization, K.E.M.; Writing—original draft, K.E.M., R.S. and S.B.H.; Writing—review and
editing, R.S., M.M., G.R.A.R., T.K. and S.B.H.Int. J. Environ. Res. Public Health 2018, 15, 2048 13 of 14
Funding: This research was funded by Health Canada MOA#4500368407.
Acknowledgments: Thank you to our partners at the Vancouver Island Health Authority, Vancouver Coastal
Health Authority, Fraser Health Authority, Interior Health Authority, and Northern Health Authority.
Conflicts of Interest: The authors declare no conflict of interest.
References
1. Health Canada. Extreme Heat Events Guidelines: Technical Guide for Health Care Workers. Chemical Policy Bureau,
Healthy Environments and Consumer Safety Branch; Health Canada: Ottawa, ON, Canada, 2011; p. 149.
2. Bai, L.; Li, Q.; Wang, J.; Lavigne, E.; Gasparrini, A.; Copes, R.; Yagouti, A.; Burnett, R.T.; Goldberg, M.S.;
Cakmak, S.; et al. Increased coronary heart disease and stroke hospitalisations from ambient temperatures in
Ontario. Heart 2018, 104, 673–679. [CrossRef] [PubMed]
3. Ordon, M.; Welk, B.; Li, Q.; Wang, J.; Lavigne, E.; Yagouti, A.; Copes, R.; Cakmak, S.; Chen, H. Ambient
Temperature and the Risk of Renal Colic: A Population-Based Study of the Impact of Demographics and
Comorbidity. J. Endourol. 2016, 30, 1138–1143. [CrossRef] [PubMed]
4. Booth, G.L.; Luo, J.; Park, A.L.; Feig, D.S.; Moineddin, R.; Ray, J.G. Influence of environmental temperature
on risk of gestational diabetes. CMAJ Can. Med. Assoc. J. 2017, 189, E682–E689. [CrossRef] [PubMed]
5. Auger, N.; Fraser, W.D.; Smargiassi, A.; Kosatsky, T. Ambient Heat and Sudden Infant Death: A Case-Crossover
Study Spanning 30 Years in Montreal, Canada. Environ. Health Perspect. 2015, 123, 712–716. [CrossRef] [PubMed]
6. He, S.; Kosatsky, T.; Smargiassi, A.; Bilodeau-Bertrand, M.; Auger, N. Heat and pregnancy-related
emergencies: Risk of placental abruption during hot weather. Environ. Int. 2018, 111, 295–300. [CrossRef]
[PubMed]
7. Auger, N.; Naimi, A.I.; Smargiassi, A.; Lo, E.; Kosatsky, T. Extreme heat and risk of early delivery among
preterm and term pregnancies. Epidemiology 2014, 25, 344–350. [CrossRef] [PubMed]
8. Misset, B.; De Jonghe, B.; Bastuji-Garin, S.; Gattolliat, O.; Boughrara, E.; Annane, D.; Hausfater, P.;
Garrouste-Orgeas, M.; Carlet, J. Mortality of patients with heatstroke admitted to intensive care units
during the 2003 heat wave in France: A national multiple-center risk-factor study. Crit. Care Med. 2006, 34,
1087–1092. [CrossRef] [PubMed]
9. Auger, N.; Bilodeau-Bertrand, M.; Labesse, M.E.; Kosatsky, T. Association of elevated ambient temperature
with death from cocaine overdose. Drug Alcohol Depend. 2017, 178, 101–105. [CrossRef] [PubMed]
10. Henderson, S.B.; Gauld, J.S.; Rauch, S.A.; McLean, K.E.; Krstic, N.; Hondula, D.M.; Kosatsky, T. A proposed
case-control framework to probabilistically classify individual deaths as expected or excess during extreme
hot weather events. Environ. Health 2016, 15, 109. [CrossRef] [PubMed]
11. Bustinza, R.; Lebel, G.; Gosselin, P.; Bélanger, D.; Chebana, F. Health impacts of the July 2010 heat wave in
Québec, Canada. BMC Public Health 2013, 13, 56. [CrossRef] [PubMed]
12. Cheng, C.S.; Campbell, M.; Li, Q.; Li, G.; Auld, H.; Day, N.; Pengelly, D.; Gingrich, S.; Klaassen, J.;
MacIver, D.; et al. Differential and combined impacts of extreme temperatures and air pollution on human
mortality in south–central Canada. Part I: Historical analysis. Air Qual. Atmos. Health 2008, 1, 209–222.
[CrossRef]
13. Bassil, K.L.; Cole, D.C.; Moineddin, R.; Lou, W.; Craig, A.M.; Schwartz, B.; Rea, E. The relationship between
temperature and ambulance response calls for heat-related illness in Toronto, Ontario, 2005. J. Epidemiol.
Community Health 2011, 65, 829–831. [CrossRef] [PubMed]
14. Bishop-Williams, K.E.; Berke, O.; Pearl, D.L.; Kelton, D.F. A spatial analysis of heat stress related emergency
room visits in rural Southern Ontario during heat waves. BMC Emerg. Med. 2015, 15, 17. [CrossRef]
[PubMed]
15. Gasparrini, A.; Guo, Y.; Hashizume, M.; Lavigne, E.; Zanobetti, A.; Schwartz, J.; Tobias, A.; Tong, S.; Rocklöv, J.;
Forsberg, B.; et al. Mortality risk attributable to high and low ambient temperature: A multicountry
observational study. Lancet 2015, 386, 369–375. [CrossRef]
16. Henderson, S.B.; Wan, V.; Kosatsky, T. Differences in heat-related mortality across four ecological regions
with diverse urban, rural, and remote populations in British Columbia, Canada. Health Place 2013, 23, 48–53.
[CrossRef] [PubMed]Int. J. Environ. Res. Public Health 2018, 15, 2048 14 of 14
17. Barreca, A.; Clay, K.; Deschenes, O.; Greenstone, M.; Shapiro, J.S. Adapting to Climate Change: The Remarkable
Decline in the US Temperature-Mortality Relationship over the Twentieth Century. J. Polit. Econ. 2016, 124,
105–159. [CrossRef]
18. Environment and Climate Change Canada. Criteria for Public Weather Alerts. Available online:
https://www.canada.ca/en/environment-climate-change/services/types-weather-forecasts-use/public/
criteria-alerts.html#heat (accessed on 3 July 2018).
19. World Meteorological Organization and World Health Organization. Heatwaves and Health: Guidance
on Warning-System Development. Available online: http://www.who.int/globalchange/publications/
heatwaves-health-guidance/en/ (accessed on 12 June 2018).
20. Henderson, S.B.; Kosatsky, T. A data-driven approach to setting trigger temperatures for heat health
emergencies. Can. J. Public Health 2012, 103, 227–230. [PubMed]
21. Sheridan, S.C.; Kalkstein, L.S. Progress in Heat Watch–Warning System Technology. Bull. Am. Meteorol. Soc.
2004, 85, 1931–1942. [CrossRef]
22. Lowe, D.; Ebi, K.L.; Forsberg, B. Heatwave early warning systems and adaptation advice to reduce human
health consequences of heatwaves. Int. J. Environ. Res. Public Health 2011, 8, 4623–4648. [CrossRef] [PubMed]
23. Hajat, S.; Kosatky, T. Heat-related mortality: A review and exploration of heterogeneity. J. Epidemiol.
Community Health 2010, 64, 753–760. [CrossRef] [PubMed]
24. R Core Team. R: A Language and Environment for Statistical Computing. Available online: https://www.r-
project.org/ (accessed on 27 June 2018).
25. Schwarzer, G. Meta: An R package for meta-analysis. R News 2007, 7, 40–45.
26. Kosatsky, T.; Henderson, S.B.; Pollock, S.L. Shifts in mortality during a hot weather event in Vancouver,
British Columbia: Rapid assessment with case-only analysis. Am. J. Public Health 2012, 102, 2367–2371.
[CrossRef] [PubMed]
27. Mackie, B. Warning Fatigue: Insights from the Australian Bushfire Context. Ph.D. Thesis, University of
Canterbury, Christchurch, New Zealand, 2013.
28. Province of British Columbia. Sub-Provincial Life Expectancy. Available online: https://www.bcstats.gov.bc.
ca/apps/VitalStatistics.aspx (accessed on 9 July 2018).
29. Fouillet, A.; Rey, G.; Laurent, F.; Pavillon, G.; Bellec, S.; Guihenneuc-Jouyaux, C.; Clavel, J.; Jougla, E.;
Hémon, D. Excess mortality related to the August 2003 heat wave in France. Int. Arch. Occup. Environ. Health
2006, 80, 16–24. [CrossRef] [PubMed]
30. Medina-Ramón, M.; Zanobetti, A.; Cavanagh, D.P.; Schwartz, J. Extreme temperatures and mortality:
Assessing effect modification by personal characteristics and specific cause of death in a multi-city case-only
analysis. Environ. Health Perspect. 2006, 114, 1331–1336. [CrossRef] [PubMed]
31. Health Canada. Heat Alert and Response Systems to Protect Health: Best Practices Guidebook.
Available online: https://www.canada.ca/en/health-canada/services/environmental-workplace-health/
reports-publications/climate-change-health/heat-alert-response-systems-protect-health-best-practices-
guidebook.html (accessed on 26 July 2018).
© 2018 by the authors. Licensee MDPI, Basel, Switzerland. This article is an open access
article distributed under the terms and conditions of the Creative Commons Attribution
(CC BY) license (http://creativecommons.org/licenses/by/4.0/).You can also read