Healthcare Service Use for Mood and Anxiety Disorders Following Acute Myocardial Infarction: A Cohort Study of the Role of Neighbourhood ...
←
→
Page content transcription
If your browser does not render page correctly, please read the page content below
International Journal of
           Environmental Research
           and Public Health

Article
Healthcare Service Use for Mood and Anxiety
Disorders Following Acute Myocardial Infarction:
A Cohort Study of the Role of Neighbourhood
Socioenvironmental Characteristics in a Largely
Rural Population
Ismael Foroughi 1 , Neeru Gupta 1, *                 and Dan Lawson Crouse 2
 1    Department of Sociology, University of New Brunswick, Fredericton, NB E3B 5A3, Canada;
      i.foroughi@unb.ca
 2    Health Effects Institute, Boston, MA 02110-1817, USA; dcrouse@healtheffects.org
 *    Correspondence: ngupta@unb.ca

 Received: 21 April 2020; Accepted: 7 July 2020; Published: 9 July 2020

 Abstract: Depression and other mood and anxiety disorders are recognized as common complications
 following cardiac events. Some studies report poorer cardiac outcomes among patients in
 socioeconomically marginalized neighbourhoods. This study aimed to describe associations between
 socioeconomic and built environment characteristics of neighbourhood environments and mental
 health service contacts following an acute myocardial infarction (AMI or heart attack) among adults in
 the province of New Brunswick, Canada. This province is characterized largely by residents in small
 towns and rural areas. A cohort of all adults aged 45 and over surviving AMI and without a recent
 record of mental disorders was identified by linking provincial medical-administrative datasets.
 Residential histories were tracked over time to assign neighbourhood measures of marginalization,
 local climate zones, and physical activity friendliness (i.e., walkability). Cox models were used
 to estimate hazard ratios (HRs) and 95% confidence intervals (CIs) for the risk of healthcare use
 for mood and anxiety disorders over the period 2003/04–2015/16 by neighbourhood characteristics.
 The baseline cohort included 13,330 post-AMI patients, among whom 32.5% were found to have
 used healthcare services for a diagnosed mood or anxiety disorder at least once during the period of
 observation. Among men, an increased risk of mental health service use was found among those living
 in areas characterized by high ethnic concentration (HR: 1.14 (95%CI: 1.03–1.25)). Among women,
 the risk was significantly higher among those in materially deprived neighbourhoods (HR: 1.16
 (95%CI: 1.01–1.33)). We found no convincing evidence of associations between this outcome and the
 other neighbourhood characteristics considered here. These results suggest that selected features of
 neighbourhood environments may increase the burden on the healthcare system for mental health
 comorbidities among adults with cardiovascular disease. Further research is needed to understand the
 differing needs of socioeconomically marginalized populations to improve mental health outcomes
 following an acute cardiac event, specifically in the context of smaller and rural communities and of
 universal healthcare coverage.

 Keywords: cardiac disorders; mental disorders; environment design; built environment; walkability;
 public health surveillance; rural population

1. Introduction
     Cardiovascular diseases, including acute myocardial infarction (AMI, also known as a heart attack),
are the leading cause of death worldwide; ensuring appropriate counselling and treatment for those

Int. J. Environ. Res. Public Health 2020, 17, 4939; doi:10.3390/ijerph17144939   www.mdpi.com/journal/ijerph
Int. J. Environ. Res. Public Health 2020, 17, 4939 2 of 12
having survived an AMI can help improve overall health and reduce the risk of another attack.
In Canada, an estimated 578,000 adults have a history of a heart attack [1]. While medical advancements
have led to improved prevention and management of AMI and other heart diseases, socioeconomic and
other factors continue to drive disparities in the impacts of these conditions. There is growing evidence
of poorer cardiac therapeutic outcomes among persons residing in lower-income neighbourhoods
compared to those residing in more affluent neighbourhoods, even in the Canadian context of
universal healthcare coverage [2,3]. Understanding the barriers and facilitators to accessing preventive
and rehabilitative healthcare services can help reduce the risks of adverse outcomes for cardiac
conditions and common comorbidities. In particular, depression and other mood and anxiety disorders
are increasingly recognized as a complication of AMI [4–6], which can lead to increased risk of
mortality [7–9]. Some research suggests that women may demonstrate a higher risk of anxiety or
depression following an AMI compared to men [10]. Interventions to address systemic barriers to
cardiac rehabilitation, such as lower health literacy, poorer social support, gendered differences in
healthcare seeking behaviours, and factors inhibiting uptake of physical activity in everyday life,
could have multiplicative benefits for reducing impacts of depression among patients who have
suffered a coronary event [2,11,12].
Most of the available literature on neighbourhood-level socioenvironmental characteristics
as predictors of health, including sociodemographic profiles of neighbourhood populations and
characteristics of built environments, is based in larger urban areas [2,12–14] or in jurisdictions with
a large supply of cardiac services [3]. Little is known about the role of neighbourhood environments in
the context of uniquely small urban and rural areas, including the Canadian Maritimes. This region of
Eastern Canada, largely characterized by numerous rural and ageing communities, consists of three
provinces: New Brunswick, Nova Scotia, and Prince Edward Island. In New Brunswick, research
has suggested that among adults living with a neurodegenerative disease, selected neighbourhood
characteristics were related to increased risk of hospitalization for comorbid conditions including
cardiometabolic diseases and mental health disorders [15]. No previous studies have examined
socioenvironmental influences on mental health service contacts among those recovering from
an acute coronary event. This study aimed to overcome this knowledge gap with the first Canadian
investigation describing the associations between neighbourhood environments and the use of
healthcare services for depression and other mood and anxiety disorders among patients surviving
myocardial infarction. Specifically, a population-based observational cohort analysis was conducted
using linked administrative and geospatial datasets to assess differentials in hospital admissions
and physician visits for mood and anxiety disorders among post-AMI patients aged 45 and over in
New Brunswick over the period 2003/04 to 2015/16 according to several physical and socioeconomic
characteristics of local neighbourhoods.
2. Materials and Methods
2.1. Study Setting
From an international perspective, socioeconomic status in Canada is high, but New Brunswick
presents poorer socioeconomic indicators than the national average (e.g., 17.1% prevalence of after-tax
low income versus 14.2% nationally) [16]. With a total population of 747,100 according to 2016 Census
data, New Brunswick is home to exclusively smaller cities and rural settlements. The province’s
population is less ethnically diverse than the Canadian average (3.4% are visible minorities compared
to 22.3% nationally) [16]. The crude AMI prevalence rate among adults was significantly higher in
New Brunswick (3.08% (95% CI: 3.04–3.12)) in 2015/16 compared to the Canadian average (2.17% (95% CI:
2.16–2.17)) [17], a pattern attributed in part to rapid population ageing (median age of 45.7 years versus
41.2 years nationally) [16] and also to higher rates of behavioural risk factors such as physical inactivity
and unhealthy diet. Approximately 1 in 10 New Brunswickers (10.54% (95% CI: 10.46–10.61)) had used
healthcare services for a mood or anxiety disorder in 2015/16, a rate somewhat higher than the nationalInt. J. Environ. Res. Public Health 2020, 17, 4939 3 of 12
average (10.05% (95% CI: 10.04–10.06)) [17]. Consistent with broadly established epidemiological
trends, the provincial rate was significantly greater among females (13.84% (95% CI: 13.72–13.95)) than
among males (7.15% (95% CI: 7.06–7.23)) [17], possibly reflecting sex-specific differences in healthcare
seeking behaviours, detection, and treatment for mental health conditions.
2.2. Data Sources
Person-level provincial administrative health datasets were linked longitudinally with area-based
socioenvironmental datasets for all residents. The pseudonymized administrative datasets included
annual case ascertainments for AMI diagnoses, case ascertainments for use of physician or hospital
services for diagnosed mood and anxiety disorders, vital statistics death records, and resident
registrations and eligibility for New Brunswick Medicare, the publicly funded insurance program
covering all essential physician and hospital services. Record linkages were performed deterministically
using patients’ (pseudonymized) Medicare numbers. Because of the universality of healthcare coverage
for all medically necessary services, the data comprised a complete enumeration of the eligible
population (apart from full-time members of the Canadian Forces and federal inmates, who have
federal healthcare coverage). The administrative health datasets were made available for research
use through a legislated data sharing agreement with the Government of New Brunswick in the
secure computing environment of the New Brunswick Institute for Research, Data and Training
(NB-IRDT), located at the University of New Brunswick [18]. Ethics approval for this study was
obtained from the Research Ethics Board of the University of New Brunswick (REB #2017-076), as part
of a larger investigation into factors affecting chronic disease prevention and management using linked
administrative datasets.
Based on annual residential postal code information, each individual was assigned several
neighbourhood-level indicators of socioenvironmental characteristics (described in detail below) from
datasets made available through the Canadian Urban Environmental Health Research Consortium
(CANUE). These datasets include standardized indicators for every postal code in Canada on
information such as land use and socioeconomic conditions [19]. Residents of New Brunswick
are required to update the residential address associated with their Medicare card every time they
move; a conversion file [20] was used to geocode six-digit postal codes to standard census geographies
by fiscal year (with each fiscal year covering the period from April 1 of a given calendar year to
March 31 of the following calendar year). In urban areas, the representative location of a six-digit
postal code corresponds typically to one side of a street in a given block or the centre of an apartment
building; in rural areas, there is much greater positional uncertainty (typically accurate within a few
kilometres) [21].
2.3. Study Population
The study population included all adults aged 45 years and older alive after a heart attack and
residing in New Brunswick; to ensure sufficient sample size, five years of data (2003/04 to 2007/08 fiscal
years) were pooled together to establish a baseline cohort. These individuals were then followed over
an average 11-year period of observation (that is, to the end of the 2015/16 fiscal year). Patients were
censored at the time of death or departure from the province, as per the vital statistics death database
and resident registry, respectively. Case ascertainments of AMI diagnoses were based on a validated
algorithm for hospitalization data from the Canadian Chronic Disease Surveillance System (CCDSS),
established among federal, provincial, and territorial partners to produce population-based estimates
of chronic disease prevalence and incidence using administrative health data [1,22]. Diagnosed AMI
cases were captured according to the coding standards of the Canadian adaptation to the International
Classification of Diseases (ICD-10-CA codes I21–I22) [23]. Several studies have assessed the validity of
hospitalization data for identifying myocardial infarction to be high (sensitivity and specificity ≥ 86%
and positive predictive value ≥ 93%) [24].Int. J. Environ. Res. Public Health 2020, 17, 4939 4 of 12
2.4. Health Service Contacts for Mood and Anxiety Disorders
The outcome of interest was patients’ use of healthcare services, including visits to a physician
(or nurse practitioner) or hospital admission, at least once in a given year for a mood or anxiety
disorder. While there are many kinds of mental illnesses, these are the most common in Canada and
worldwide, and include depression, generalized anxiety disorder, social anxiety disorder, and other
disorders usually accompanied by a change in mood, symptoms, and activities that interfere with an
individual’s everyday life [25]. Ascertainments of mood and anxiety disorders were identified from
provincial administrative health databases drawing on the CCDSS infrastructure and case definitions
(ICD-10-CA codes F30–F42, F44–F48, and F68) [23]. Excluded from the analysis were conditions with
a demonstrably different etiology such as dementias, sleep disorders, and substance use disorders.
Administrative data may not capture all cases of mental illness, or may capture cases that do not
meet all standard diagnostic criteria for mood and anxiety disorders [25]. A triangulation analysis of
prevalence estimates for mood and anxiety disorders using CCDSS data versus national household
survey findings indicated there has been increasing consistency of information over time, reinforcing
data validity [26].
2.5. Neighbourhood Socioenvironmental Characteristics
The health implications for seven different indicators of patients’ neighbourhood environments
were considered. These included four indicators of socioeconomic characteristics (i.e., material
deprivation, residential instability, ethnic concentration, population dependency) and three indicators
of physical characteristics (i.e., active living friendliness, community size, and local climate zone), each
of which is described below. First, we assigned to patients four dimensions of marginalization from the
Canadian Marginalization Index (CAN-Marg), which was developed by Matheson et al. [27] to examine
aspects of economic inequality associated with adverse health and healthcare outcomes. The CAN-Marg
dataset includes four area-based indicators: material deprivation (e.g., proportion of low-income
families, homes needing major repair, unemployment rate); residential instability (e.g., level of
crowding, residential ownership, residential mobility); population dependency (e.g., labour force
participation rate, proportion of seniors); and ethnic concentration (proportions of recent immigrants
and visible minorities). These variables were developed at the scale of census dissemination areas,
which are the smallest units of census geography, covering populations of approximately 400 to
700 people. The CAN-Marg measures have been found to be temporally and spatially stable across
Canada, and to be associated with health status and health behaviours [28,29]. The lowest two quintiles
of CAN-Marg values were defined here as socioeconomically marginalized neighbourhoods.
Next, patients were assigned values from the Canadian Active Living Environments (Can-ALE)
dataset. The Can-ALE index summarizes features of communities that may support walkability and
active living, such as densities of homes, green spaces (e.g., parks), footpaths, and transit stops [30].
Similar to the CAN-Marg data, this areal measure is based on 2006 census information by dissemination
area. After assigning an index value to each individual’s place of residence for each fiscal year,
the lowest quintile of Can-ALE values was defined as the least favourable active living environment.
Patients’ place of residence was then categorized by community size: urban versus rural.
As defined for purposes of provincial healthcare resource planning, residences were considered “rural”
if they were located more than 40 km outside of one of New Brunswick’s three main cities (Moncton,
Fredericton, or Saint John). Urban residences were those located within the catchment areas of the
three cities, each of which has a population under 150,000.
Lastly, given that there can be great variability in neighbourhood characteristics across these
two broad categories of community size, and because the densities of dwellings and intersections
(as described by the Can-ALE index) do not completely encapsulate the walkability or active living
friendliness of different neighbourhoods, the physical characteristics of local environments were
described further. For this, the recently developed local climate zone (LCZ) classification system was
used, which incorporates a combination of characteristics related to land cover and land use for humanInt. J. Environ. Res. Public Health 2020, 17, 4939 5 of 12
activity [31,32]. The LCZ system classifies dissemination areas according to “built” and “natural” zones
taking into account, among other details, building and vegetation types and heights, building and
tree spacing, fraction of sky visible from ground level, proportion of surface with impervious cover,
and areas of natural forests and wooded recreation, as derived from land cover/land use maps and
satellite images [32]. Zones range from those characterized by a very dense mix of tall buildings
that is mostly paved and has few trees (e.g., the compact high-rise design of downtown Toronto) to
those characterized by a sparse arrangement of mostly single-story buildings in a more natural setting
(e.g., the lightweight low-rise setting of a small, rural community). This system was designed to be
applicable universally to urban environments worldwide and has the potential to classify human
settlements in support of applications such as disaster mitigation, urban planning, and population
assessment [33]. In the New Brunswick context, given the absence of the lowest LCZ values on the
classification’s 20-point scale (i.e., the most compact high-rise areas), areas were grouped into those
with lower LCZ values (13 or less) versus those with higher LCZ values (14 or higher). Similar to the
other CANUE datasets, this index was developed drawing on census information for the year 2006,
which represents approximately the midpoint of the study period.
2.6. Statistical Analysis
Cox proportional hazard models were used to assess the associations between health service
contacts for mood and anxiety disorders and each of the seven area-level characteristics. To control
for recent history of common mental disorders, patients having used mental health services in the
five years preceding the AMI (that is, based on retrospective data from 1998/99 to 2006/07, depending
on the time of cohort entry) were excluded from the analysis. For all models, individuals’ age was
included as a time-varying control variable and sex as a time-invariant control variable over the period
of observation. To see if there was a sex-specific difference in the socioenvironmental correlates of
mental health risks among AMI patients, separate models for men and women were also analyzed.
Hazard ratios (HRs) and bootstrapped 95% confidence intervals (CIs) were generated for each predictor
using the Stata v15 statistical software package. Population counts were rounded to a base of five to
reinforce the confidential nature of the administrative health data.
3. Results
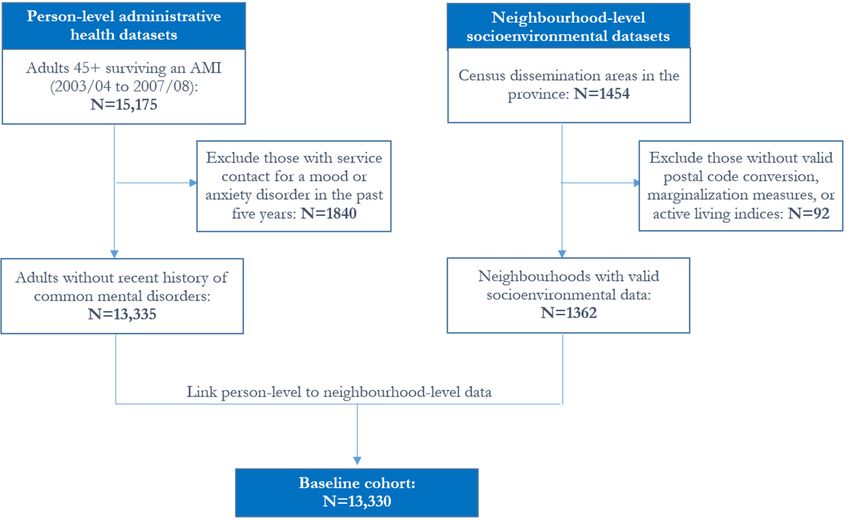
Among New Brunswickers aged 45 and over, 15,175 survived an AMI at any time over the
baseline period (2003/04 to 2007/08 fiscal years) and had complete residential history information in the
province over the average 11-year follow-up period of observation (that is, until the end of 2015/16);
after excluding individuals with a recent history of prevalent mental disorders, the cohort for analysis
included 13,330 adults residing in one of 1362 neighbourhoods (Figure 1).
Of the baseline cohort of AMI survivors, 64.3% were men and 35.7% were women. At least
two-thirds were living in neighbourhoods characterized by high material deprivation, low active living
friendliness, high neighbourhood population dependency, high neighbourhood residential instability,
and low neighbourhood ethnic concentration (Figure 2). Although half (50.5%) were living in urban
communities, in the New Brunswick context only 38.9% were living in areas categorized as more
compact high-rise urban designs.
Over the period of observation, 4330 (32.5%) of the AMI patient cohort used healthcare services at
least once for a diagnosed mood or anxiety disorder (not shown). As expected, this proportion was
higher among women (36.4%) compared to men (30.3%).Int. J. Environ. Res.
Res. Public
PublicHealth
Health2020,
2020, 17,
17, x4939
FOR PEER REVIEW 56 of 12
11
Int. J. Environ. Res. Public Health 2020, 17, x FOR PEER REVIEW 5 of 11
Figure 1. Flow
Figure 1. Flowchart forfor
chart the creation
the creationof the
thecohort
cohortanalysis
analysis file from linked
linked administrativehealth
health and
Figure 1. Flow chart for the creation ofofthe cohort analysis file from
file from linkedadministrative and
administrative health and
geo-environmental
geo-environmental
geo-environmental datasets.
datasets.Note:
datasets. Note:Counts
Note: Countsmay
Counts maynot
may not add
not add up
add up due
up to controlled
due to
due to controlledrounding.
controlled rounding.AMI:
rounding. AMI: acute
AMI:acute
acute
myocardial
myocardial
myocardial infarction.
infarction.
infarction.
0%0% 20%
20% 40%
40% 60%
60% 80%
80% 100%
100%
Sex
Sex Female:36%
Female: 36% Male:
Male:64%
64%
Age
Age group
group 45-64years:
45-64 years:39%
39% 65-74 years:
65-74 years:24%
24% 7575years
yearsand
andover: 37%
over: 37%
Community size Urban: 50% Rural: 50%
Community size Urban: 50% Rural: 50%
Neighbourhood material deprivation Low: 17% High: 83%
Neighbourhood material deprivation Low: 17% High: 83%
Neighbourhood dependency Low: 14% High: 86%
Neighbourhood dependency Low: 14% High: 86%
Neighbourhood residential instability Low: 34% High: 66%
Neighbourhood residential instability Low: 34% High: 66%
Neighbourhood ethnic concentration Low: 74% High: 26%
Neighbourhood ethnic concentration Low: 74% High: 26%
Neighbourhood active living friendliness Low: 78% High: 22%
Neighbourhood active living friendliness Low: 78% High: 22%
Local climate zone More dense urban: 39% Sparsely built: 61%
Local climate zone More dense urban: 39% Sparsely built: 61%
Figure 2. Percentage distribution of the adult population aged 45 and over with prior AMI by
individual and neighbourhood-level
Figure 2.2.Percentage
Percentage distribution
distribution of the characteristics,
of the
adultadult
population New
population Brunswick,
aged aged
45 and45 Canada.
and
over with Note:
over with
prior Individual
AMI prior AMIandby
by individual
area-based
individual
and characteristics are
and neighbourhood-level
neighbourhood-level those at the time of
characteristics,
characteristics, patient
New Brunswick, entry to
New Brunswick, the
Canada. Note: cohort
Canada. (N = 13,330
Note: and
Individual over
Individual the
and
area-based
baseline period
characteristics 2003/04
area-based characteristics to
are those at the2007/08).
are time
thoseofatpatient
the time of to
entry patient
the cohort to =the
entry(N cohort
13,330 over(Nthe
= 13,330
baselineover the
period
baselinetoperiod
2003/04 2003/04 to 2007/08).
2007/08).Int. J. Environ. Res. Public Health 2020, 17, 4939 7 of 12
Table 1 presents the results from the hazard models for the associations between healthcare use
for mood and anxiety disorders and each of the neighbourhood characteristics. Findings showed
significantly increased risk of using health services for mood and anxiety disorders among AMI
patients aged 45 and over living in neighbourhoods characterized by high ethnic concentration
(HR: 1.11 (95% CI: 1.03–1.19), p < 0.05) after adjusting for age, sex, and size of home community.
Other characteristics of local environments, including material deprivation and residential instability,
were not found to be significantly associated with health service contacts for mental health disorders.
As expected, the risk was lower among adults aged 75 years and over compared to their younger
counterparts. The patient’s sex was significantly associated with the outcome of interest, with females
having approximately 58% (HR: 1.58 (95% CI: 1.48–1.68), p < 0.05) higher risk of healthcare use for
a mood or anxiety disorder compared to males, after controlling for age and the different measures of
neighbourhood environments.
Among women alone (Table 1, model 2), and after adjusting for age and size of home community,
neighbourhood-level material deprivation was significantly associated with increased risk of health
service use for common mental illnesses (HR: 1.16 (95% CI: 1.01–1.33), p < 0.05). Among males alone
(Table 1, model 3), only neighbourhood ethnic concentration was found to be independently associated
with increased mental health service use (HR: 1.14 (95% CI: 1.03–1.25), p < 0.05).Int. J. Environ. Res. Public Health 2020, 17, 4939 8 of 12
Table 1. Adjusted hazard ratios (HRs) and 95% confidence intervals (CIs) for associations between individual and neighbourhood characteristics and risk of healthcare
use for mood and anxiety disorders among AMI patients aged 45 and over; total and by sex.
(1) All Patients (n = 13,330) (2) Females (n = 4755) (3) Males (n = 8580)
Characteristic
HR Lower CI Upper CI HR Lower CI Upper CI HR Lower CI Upper CI
Sex
Female (ref: Male) 1.58 * 1.48 1.68 – – – – – –
Age group
65–74 years (ref: 45–64 years) 0.95 0.88 1.03 0.91 0.80 1.03 0.97 0.88 1.07
75+ years 0.94 * 0.87 1.00 0.81 * 0.72 0.91 1.05 0.96 1.16
Community size
Urban (ref: Rural) 0.91 * 0.85 0.97 0.95 0.85 1.06 0.88 * 0.80 0.96
Neighbourhood material deprivation
High (ref: Low) 1.03 0.95 1.12 1.16 * 1.01 1.33 0.95 0.85 1.06
Neighbourhood population dependency
High (ref: Low) 1.03 0.94 1.14 0.95 0.82 1.11 1.09 0.96 1.23
Neighbourhood residential instability
High (ref: Low) 1.04 0.97 1.11 1.03 0.92 1.15 1.04 0.95 1.13
Neighbourhood ethnic concentration
High (ref: Low) 1.11 * 1.03 1.19 1.07 0.95 1.20 1.14 * 1.03 1.25
Neighbourhood active living friendliness
High (ref: Low) 1.01 0.92 1.10 1.01 0.88 1.15 1.00 0.89 1.12
Local climate zone
Compact high-rise (ref: Lightweight low-rise) 1.01 0.94 1.08 1.07 0.96 1.19 0.97 0.89 1.05
* p < 0.05; ref = reference category. Counts may not add up due to controlled rounding.Int. J. Environ. Res. Public Health 2020, 17, 4939 9 of 12
4. Discussion
This study represented the first assessment of the role of neighbourhood environments on the
burden to a publicly funded healthcare system for mental health comorbidities among patients
recovering from AMI. Drawing on linked person-level administrative and geospatial datasets tracking
individuals’ healthcare service contacts over an average 11-year period, and controlling for prior
records of mental disorders, selected socioenvironmental characteristics of local communities were
found to be significantly associated with greater risk of healthcare use for mood and anxiety disorders
among post-AMI patients aged 45 and over in the province of New Brunswick, one of Canada’s
most rural populations. However, the impact of specific neighbourhood characteristics varied by sex.
Among men aged 45 and over, neighbourhood ethnic concentration was significantly associated with
increased mental health service use (HR: 1.14 (95% CI: 1.03–1.25)), whereas among women it was
neighbourhood material deprivation that played an independent role (HR: 1.16 (95% CI: 1.01–1.33)).
The findings of this study are generally consistent with research elsewhere that has reported links
between different measures of neighbourhood marginalization with the risk of depression among
adults [34], and with the risk of hospital admission for depression and other mood and anxiety disorders
among adults with a neurodegenerative disease [15]. Living in areas of higher ethnic concentration or
higher material deprivation has been associated with increased social vulnerability and associated
health-risk behaviours contributing to poorer physical and mental health, including physical inactivity,
binge drinking, and tobacco use [27]. The influential role of neighbourhood ethnic concentration
was ascertained even in this study setting of relative ethnic homogeneity. While there is growing
recognition of the importance of considering neighbourhood-level exposures in health research, studies
specifically looking at community influences on health among older adults are limited and, where
available, have been largely cross-sectional in design [35]. In particular, the LCZ classification system
has been largely limited to analyses of urban heat islands, but its value for applications to city planning
is increasingly recognized [32] and how it relates to human health is a new area of research.
The present results further reinforce the need for better integration of sex and gender in population
health research. For example, Petkovic et al.’s analysis of recent systematic reviews documented
that less than 30% of reviews reported on sex or gender in the results [36]. In this study, given
that men numerically outweighed women in the target population (as expected), the statistical
models including both sexes revealed only those substantive patterns in which neighbourhood
characteristics were associated with poorer health outcomes that were predominantly observed among
men (i.e., neighbourhood ethnic concentration). Using a split-sex analysis amplified cautions that
unless explicit attention is paid to sex and gender in study designs, decisions based on the research
evidence may inadvertently contribute to gender gaps by inadequately responding to different needs
of disadvantaged women and men with chronic illness [37].
A certain underestimation of the prevalence of mental health service use in this study is likely. While
increasing mental health literacy and declining stigma towards mental health disorders may be resulting
in increased service use and improved recording of treatment over time [26], the administrative health
datasets used here lacked information on mental health service use from exclusively community-based
settings, private settings, or outside the province. Also lacking were data on individual risk and
protective health-related behaviours and individual socioeconomic position. The present research
relied on area-based socioenvironmental measures, categorizing all patients residing within a given
census-defined boundary in the year with the same set of neighbourhood-level indicators. Given that
these indicators (from the CAN-Marg, Can-ALE, and LCZ datasets) were available only for the census
year 2006, it was assumed that they remained relatively stable over the study period. In a study
from another Canadian province using different neighbourhood walkability data during 12 years of
follow-up, Creatore et al. [13] found that most neighbourhoods remained in the same quintile and 99%
remained within one quintile of their baseline assignment. In the context of uniquely smaller urban
and rural settlements such as New Brunswick, indicators of active living environments may be little
more than a marker for the urban cores.Int. J. Environ. Res. Public Health 2020, 17, 4939 10 of 12
Notwithstanding the above-noted limitations, strengths of this study included the
population-based nature of the data, which captured all adults in the province with prior AMI,
controlling for recent records of common mental disorders, and considering many different dimensions
of built environments and neighbourhood social and economic deprivation. The availability of annually
updated residential postal codes allowed for incorporating time-varying contextual covariates in the
statistical analyses.
5. Conclusions
Despite universal healthcare coverage, selected local characteristics of neighbourhood
environments were found to be significantly associated with increased health service contacts for mental
health comorbidities among AMI patients aged 45 and over residing in a Canadian province of uniquely
smaller urban and rural settlements. Among women, living in a materially deprived neighbourhood was
significantly associated with increased mental health service use; among men, living in a neighbourhood
characterized by ethnic concentration exercised an independent influence. These findings suggest
that strategies aiming to improve detection and treatment of mental disorders need to consider the
different needs of women and men across socioenvironmental settings. Further research is needed to
understand the role of community situations to improve mental health outcomes following an acute
cardiac event in the context of population ageing.
Author Contributions: Conceptualization, N.G. and D.L.C.; Data curation and software, I.F.; Analysis and writing,
I.F., N.G., and D.L.C.; Project administration, N.G. All authors have read and agreed to the published version of
the manuscript.
Funding: This research was funded by the New Brunswick Health Research Foundation (Bridge Grant 2018/19)
and the Strategy for Patient-Oriented Research (Maritime SPOR Support Unit).
Acknowledgments: Some of the results from this study were presented at the 48th Annual Scientific and
Educational Meeting of the Canadian Association of Gerontology (Moncton, Canada, 24–26 October 2019).
De-identified linkable datasets used for the analysis were accessed in the secure computing facility of the New
Brunswick Institute for Research, Data and Training (NB-IRDT), located at the University of New Brunswick
in Fredericton, Canada. The services and activities of the NB-IRDT are supported by the Government of New
Brunswick. The Can-Marg, Can-ALE, and LCZ datasets were made available through the Canadian Urban
Environmental Health Research Consortium (CANUE).
Conflicts of Interest: The authors declare no competing interests. The funders and partners had no role in the
design, execution, interpretation, or writing of the study.
References
1. Public Health Agency of Canada. Report from the Canadian Chronic Disease Surveillance System: Heart Disease
in Canada, 2018; Public Health Agency of Canada: Ottawa, ON, Canada, 2018.
2. Lemstra, M.E.; Alsabbagh, W.; Rajakumar, R.J.; Rogers, M.; Blackburn, D. Neighbourhood income and
cardiac rehabilitation access as determinants of nonattendance and noncompletion. Can. J. Cardiol. 2013, 29,
1599–1603. [CrossRef]
3. Blais, C.; Hamel, D.; Rinfret, S. Impact of socioeconomic deprivation and area of residence on access to
coronary revascularization and mortality after a first acute myocardial infarction in Québec. Can. J. Cardiol.
2012, 28, 169–177. [CrossRef]
4. Trajanovska, A.S.; Kostov, J.; Perevska, Z. Depression in survivors of acute myocardial infarction.
Mater. Socio Medica 2019, 31, 110–114. [CrossRef] [PubMed]
5. Larsen, K.K. Depression following myocardial infarction–an overseen complication with prognostic
importance. Dan. Med. J. 2013, 60, B4689. [PubMed]
6. Echols, M.R.; O’Connor, C.M. Depression after myocardial infarction. Curr. Hear. Fail. Rep. 2010, 7, 185–193.
[CrossRef] [PubMed]
7. Frasure-Smith, N. Depression following myocardial infarction. Impact on 6-month survival. JAMA 1993,
270, 1819–1825. [CrossRef]Int. J. Environ. Res. Public Health 2020, 17, 4939 11 of 12
8. Lesperance, F.; Frasure-Smith, N.; Talajic, M.; Bourassa, M.G. Five-year risk of cardiac mortality in relation to
initial severity and one-year changes in depression symptoms after myocardial infarction. Circulation 2002,
105, 1049–1053. [CrossRef]
9. Carney, R.M.; Blumenthal, J.A.; Catellier, D.; E Freedland, K.; Berkman, L.F.; Watkins, L.L.; Czajkowski, S.M.;
Hayano, J.; Jaffe, A.S. Depression as a risk factor for mortality after acute myocardial infarction. Am. J. Cardiol.
2003, 92, 1277–1281. [CrossRef]
10. Serpytis, P.; Navickas, P.; Lukaviciute, L.; Navickas, A.; Aranauskas, R.; Serpytis, R.; Deksnyte, A.;
Glaveckaite, S.; Petrulioniene, Z.; Samalavicius, R. Gender-based differences in anxiety and depression
following acute myocardial infarction. Arq. Bras. de Cardiol. 2018, 111, 676–683. [CrossRef]
11. Janzon, E.; Abidi, T.; Bahtsevani, C. Can physical activity be used as a tool to reduce depression in patients
after a cardiac event? What is the evidence? A systematic literature study. Scand. J. Psychol. 2015, 56, 175–181.
[CrossRef]
12. Hajna, S.; Kestens, Y.; Daskalopoulou, S.S.; Joseph, L.; Thierry, B.; Sherman, M.; Trudeau, L.; Rabasa-Lhoret, R.;
Meissner, L.; Bacon, S.L.; et al. Neighbourhood walkability and home neighbourhood-based physical activity:
An observational study of adults with type 2 diabetes. BMC Public Health 2016, 16, 957. [CrossRef]
13. Creatore, M.I.; Glazier, R.H.; Moineddin, R.; Fazli, G.S.; Johns, A.; Gozdyra, P.; I Matheson, F.;
Kaufman-Shriqui, V.; Rosella, L.C.; Manuel, D.G.; et al. Association of neighborhood walkability with change
in overweight, obesity, and diabetes. JAMA 2016, 315, 2211. [CrossRef]
14. Collins, P.; Tait, J.; Fein, A.; Dunn, J.R. Residential moves, neighbourhood walkability, and physical activity:
A longitudinal pilot study in Ontario Canada. BMC Public Health 2018, 18, 933. [CrossRef] [PubMed]
15. Crouse, D.L.; Foroughi, I.; Gupta, N. Neighbourhood environments and the risk of hospital admission for
cardiometabolic and mental health comorbidities in multiple sclerosis. Mult. Scler. J. 2020. [CrossRef]
16. Statistics Canada. Census Profile. 2016 Census. Statistics Canada Catalogue No. 98-316-X2016001; Statistics
Canada: Ottawa, ON, Canada, 2017.
17. Public Health Agency of Canada. Public Health Infobase: Canadian Chronic Disease Surveillance System [Online
Database]; Public Health Agency of Canada: Ottawa, ON, Canada, 2019.
18. Ayles, J.; McDonald, T. Key factors in the establishment of an academia-government center of public sector
administrative data and policy research. Int. J. Popul. Data Sci. 2018, 3. [CrossRef]
19. Doiron, D.; Setton, E.; Seed, E.; Shooshtari, M.; Brook, J. The Canadian Urban Environmental Health Research
Consortium (CANUE): A national data linkage initiative. Int. J. Popul. Data Sci. 2018, 3. [CrossRef]
20. Statistics Canada. Postal Code Conversion File Plus (PCCF+) Version 6D, Reference Guide. Catalogue
No. 82-F0086-XDB; Statistics Canada: Ottawa, ON, Canada, 2016.
21. Khan, S.; Pinault, L.; Tjepkema, M.; Wilkins, R. Positional accuracy of geocoding from residential postal
codes versus full street addresses. Public Health Rep. 2018, 29, 3–9.
22. Hamm, N.C.; Pelletier, L.; Ellison, J.; Tennenhouse, L.; Reimer, K.; Paterson, J.M.; Puchtinger, R.;
Bartholomew, S.; Phillips, K.A.M.; Lix, L.M.; et al. Trends in chronic disease incidence rates from the
Canadian Chronic Disease Surveillance System. Health Promot. Chronic Dis. Prev. Can. 2019, 39, 216–224.
[CrossRef]
23. Canadian Institute for Health Information. International Statistical Classification of Diseases and Related Health
Problems, 10th Revision, Canada (ICD-10-CA); Canadian Institute for Health Information: Ottawa, ON,
Canada, 2009.
24. McCormick, N.; Lacaille, D.; Bhole, V.; Avina-Zubieta, J.A. Validity of myocardial infarction diagnoses in
administrative databases: A systematic review. PLoS ONE 2014, 9, e92286. [CrossRef] [PubMed]
25. Public Health Agency of Canada. Report from the Canadian Chronic Disease Surveillance System: Mood and
Anxiety Disorders in Canada, 2016; Public Health Agency of Canada: Ottawa, ON, Canada, 2016.
26. O’Donnell, S.; Vanderloo, S.; McRae, L.; Onysko, J.; Patten, S.; Pelletier, L. Comparison of the estimated
prevalence of mood and/or anxiety disorders in Canada between self-report and administrative data.
Epidemiol. Psychiatr. Sci. 2016, 25, 360–369. [CrossRef]
27. I Matheson, F.; Dunn, J.R.; Smith, K.L.W.; Moineddin, R.; Glazier, R.H. Development of the Canadian
Marginalization Index: A new tool for the study of inequality. Can. J. Public Health 2012, 103, S12–S16.Int. J. Environ. Res. Public Health 2020, 17, 4939 12 of 12
28. Christidis, T.; Erickson, A.C.; Pappin, A.J.; Crouse, D.L.; Pinault, L.; Weichenthal, S.; Brook, J.R.;
Van Donkelaar, A.; Hystad, P.; Martin, R.V.; et al. Low concentrations of fine particle air pollution and
mortality in the Canadian Community Health Survey cohort. Environ. Health 2019, 18, 84–86. [CrossRef]
[PubMed]
29. Scott, G.M.; Best, C.; Fung, K.; Gupta, M.; Sommer, D.D.; Szeto, C.; Micomonaco, D.C. Impact of
marginalization on tobacco use in individuals diagnosed with head and neck Cancer. J. Otolaryngol.-Head
Neck Surg. 2019, 48, 54. [CrossRef] [PubMed]
30. Hermann, T.; Gleckner, W.; A Wasfi, R.; Thierry, B.; Kestens, Y.; A Ross, N. A pan-Canadian measure of active
living environments using open data. Public Health Rep. 2019, 30, 16–25.
31. Ching, J.; Mills, G.; Bechtel, B.; See, L.; Feddema, J.; Wang, X.; Ren, C.; Brousse, O.; Martilli, A.;
Neophytou, M.; tet al. WUDAPT: An urban weather, climate, and environmental modeling infrastructure for
the anthropocene. Bull. Am. Meteorol. Soc. 2018, 99, 1907–1924. [CrossRef]
32. Stewart, I.D.; Oke, T.R. Local climate zones for urban temperature studies. Bull. Am. Meteorol. Soc. 2012, 93,
1879–1900. [CrossRef]
33. Qiu, C.; Mou, L.; Schmitt, M.; Zhu, X.X. Local climate zone-based urban land cover classification from
multi-seasonal Sentinel-2 images with a recurrent residual network. ISPRS J. Photogramm. Remote. Sens.
2019, 154, 151–162. [CrossRef] [PubMed]
34. Cohen-Cline, H.; A A Beresford, S.; Barrington, W.E.; Matsueda, R.L.; Wakefield, J.; E Duncan, G. Associations
between neighbourhood characteristics and depression: A twin study. J. Epidemiol. Community Health 2018,
72, 202–207. [CrossRef]
35. Yen, I.H.; Michael, Y.L.; Perdue, L. Neighborhood environment in studies of health of older adults.
Am. J. Prev. Med. 2009, 37, 455–463. [CrossRef]
36. Petkovic, J.; Trawin, J.; Dewidar, O.; Yoganathan, M.; Tugwell, P.; Welch, V. Sex/gender reporting and analysis
in Campbell and Cochrane systematic reviews: A cross-sectional methods study. Syst. Rev. 2018, 7, 113.
[CrossRef]
37. Gupta, N.; Crouse, D.L.; Balram, A. Individual and community-level income and the risk of diabetes
rehospitalization among women and men: A Canadian population-based cohort study. BMC Public Health
2020, 20, 60. [CrossRef] [PubMed]
© 2020 by the authors. Licensee MDPI, Basel, Switzerland. This article is an open access
article distributed under the terms and conditions of the Creative Commons Attribution
(CC BY) license (http://creativecommons.org/licenses/by/4.0/).You can also read