The Study of Health-Related Fitness Normative Scores for Nepalese Older Adults - MDPI
←
→
Page content transcription
If your browser does not render page correctly, please read the page content below
International Journal of
           Environmental Research
           and Public Health

Article
The Study of Health-Related Fitness Normative
Scores for Nepalese Older Adults
Jung Kyu Kim 1 , Won Il Son 2 , Ye Jung Sim 1 , Ju Sung Lee 3 and Kamala Oli Saud 1, *
 1    Exercise Physiology Lab, Department of Leisure Sports, College of Humanities, Social Science and Design,
      Sports, Kangwon National University, 346 Jungang-ro, Samcheok-si, Gangwon-do 25913, Korea;
      jkkim67@kangwon.ac.kr (J.K.K.); syjim22@kangwon.ac.kr (Y.J.S.)
 2    Physical Education Measurement and Evaluation Lab, Department of Leisure Sports, College of Humanities,
      Social Science and Design, Sports, Kangwon National University, 346 Jungang-ro, Samcheok-si,
      Gangwon-do 25913, Korea; son91@kangwon.ac.kr
 3    Department of Sports Sciece, Kangwon National University, 1 Kangwon Daehaggil, Chuncheoun-si,
      Gangwon-do 24341, Korea; jsleetime@kangwon.ac.kr
 *    Correspondence: kamalaolisaud@gmail.com

 Received: 11 March 2020; Accepted: 14 April 2020; Published: 15 April 2020

 Abstract: Physical fitness tests are important to maintain and promote the health status of people.
 The purpose of this study was to develop health-related fitness evaluation norms according to the age
 and gender of Nepalese older adults. One thousand nine subjects (449 males, 560 females) above
 60 years, residing in 19 wards (rural and urban) of Dhangadhi Sub-Metropolitan City participated in
 this study. The test included the PAR-Q (Physical Activity Readiness Questionnaire), social aspects
 questionnaire, blood pressure test, height, weight, BMI (body mass index), percent body fat, and four
 physical fitness components (grip strength, 1-minute sit-to-stand, sit and reach, and 2-minute step
 tests). Mean, SD, and fitness evaluation norms for each component were obtained after the main test
 and statistical analyses. This study showed higher BMI and percent body fat in female age groups
 than in male age groups. Grip strength, relative grip strength, sit-to-stand, and 2-minute steps scores
 were better in male age groups than in female age groups, but in contrast, flexibility was better in
 female age groups. This study may help the related sectors to assess physical fitness, identify fitness
 levels, and develop appropriate physical activities or exercise programs for older adults based on age.

 Keywords: older adults; health-related fitness test; evaluation norms; awards norms; Nepal

1. Introduction
     Aging is a natural phenomenon and an inevitable process. Population ageing has been considered
as one of the important demographic phenomena that impact directly or indirectly on health-care
expenditure and the kinds of formal and informal care services. Developing nations like Nepal have
not yet succeeded in managing appropriate health-care systems and establishing physical activity to
ensure health and a high quality of life for older adults.
     Nepalese society is in a phase of modernization that is changing the age structure of the country
with a shift towards older ages through declining fertility, relatively controlled adult mortality [1], and
improved health interventions [2]. According to the national census, there were 1.5 million people
in Nepal over 60 years of age in 2001 and 2.1 million in 2011, which constitutes 6.5% and 8.1% of
the total population in the country, respectively [3,4]. During the years 1991–2001, the annual elderly
population growth rate was 3.39%, higher than the annual population growth rate of 2.3%, which
indicates the start of aging dynamics in Nepal [1,5]. Because of this, declining health is an issue. It
is imperative to examine quantifiable outcomes of habitual physical activity if the contribution of
physical activity to the health of the aging population is to be better understood.

Int. J. Environ. Res. Public Health 2020, 17, 2723; doi:10.3390/ijerph17082723     www.mdpi.com/journal/ijerph
Int. J. Environ. Res. Public Health 2020, 17, 2723 2 of 15
Physical fitness is the ability of body systems that function efficiently to perform activities of
daily living, respond in emergency situations, and enjoy sports and leisure activities [6]. It is one of
the important indices of health that helps people to carry out daily activities safely and independently
without undue fatigue [7]. A new fitness concept, health-related fitness, has been introduced on
the basis of relationships between physical activities, fitness, and health [8]. Health-related fitness refers
to the components of fitness (cardiorespiratory endurance, muscular strength, muscular endurance,
and flexibility) [7] that are affected by habitual physical activity and are related to various health
outcomes. Lower levels of fitness are associated with all-cause mortality, a high risk of cardiovascular
disease, cancer, functional disability, and arterial stiffness [9–16]. Individuals having an appropriate
level of health-related fitness may work efficiently, reduce the risk of disease and injury, look their
physical best, and participate and enjoy physical activity [17]. Fitness, in various forms, increases
performance and improves safety [18] and leads to greater reserve capacity to resist physical stress [19].
Improvements in physical fitness through appropriate physical activities in an older adult should
enable them to maintain and promote health and well-being [20,21] into later years of life.
Physical fitness testing is a highly visible and important part of physical fitness programs. It is
important to monitor fitness to evaluate risk factors for health hazards in older adults and to ensure
the safety of starting new activities. In Nepal, information on the health condition of older adults is
still insufficient and no study on health-related fitness tests of older adults was found in the literature.
The purpose of this study was to develop health-related fitness norms according to age and gender of
older adults, with the expectation that our research might provide useful information for targeting
effective physical activity interventions towards people at risk for declining health and to improve
the health status of the general population.
2. Materials and Methods
Prior to the study commencing, approval for the research with an ethical code 2076/077 was
obtained by the Dhangadhi Sub-Metropolitan Urban Health Centre and Dhangadhi Sub-Metropolitan
City, Nepal. Thirty volunteers were recruited in the combined efforts of the Sub-Metropolitan City and
Sudur Paschimanchal Campus. This study was conducted from the last week of July to the third week of
August in 2019. Four days of training were provided to the volunteers. A permanent health assistant for
the study period was provided by the Urban Health Centre, Dhangadhi Sub-Metropolitan City. A local
health assistant and volunteers were provided by the health post of each ward of the Sub-Metropolitan
City. Advertising was run through local FM radio and TV spots in the representative sectors sharing
information about the test, dates, places, and times starting a week before the tests commenced. On test
day, after fully briefing participants about the nature and purpose of the study, a completed Physical
Activity Readiness Questionnaire and written informed consent were received from each participant.
Completion of the social aspects questionnaires and overseeing of the tests were performed by trained
volunteers. Before each test, a trained volunteer explained and demonstrated the task and made sure
that the task could be completed without any physical risk to the participant. Volunteers helped
the participants in doing a warm-up consisting of head turns and half circles, single arm crossovers
and chest stretches, and calf and hamstring stretches after the body composition tests and before
the physical fitness tests [22]. The test unit was always prepared for immediate first aid for injuries
and sudden illness during the tests.
2.1. Characteristics of the Fitness Test
Physical factors necessary to carry out the activities of daily living were included. The test
included mainly health-related fitness factors (body composition, muscle strength and endurance,
flexibility and cardiorespiratory endurance). It was intended to be field-based and low cost. Fitness
test components were selected for having a low risk of injury during testing.Int. J. Environ. Res. Public Health 2020, 17, 2723 3 of 15
2.2. Participants
A field-based cross-sectional study including 1009 subjects, (449 males, 560 females) above
60 years, residing in 19 wards (rural and urban) of Dhangadhi Sub-Metropolitan City participated in
the health-related physical fitness test. Participants completed the blood pressure test after resting
5–10 min. Participants with any problems identified in the Physical Activity Readiness Questionnaire
(PAR-Q); having systolic pressure greater than 160 mmHg and diastolic pressure greater than 100 mmHg;
or having an implantable electrical device such as a pacemaker, defibrillator, or nerve stimulator were
excluded from the other tests.
After completing the blood pressure test, the five remaining tests were completed in the following
order to minimize fatigue: body composition analyses, 1-min sit-to-stand, grip strength, and
flexibility [22].
2.3. Body Composition Tests
The Body Composition Analyzer (Inbody 470, Korea) was used to assess weight, body mass index
(BMI), and percent body fat. BMI is body weight in kilograms (kg) divided by height in meters squared
(m2 ). Percent body fat is the total mass of fat divided by total body mass and multiplied by 100, which
includes essential body fat and storage body fat. A stadiometer was used to measure height.
2.4. Hand Grip Strength Test
A digital grip strength dynamometer (TKK 5401; Takei, Tokyo, Japan) was used to assess upper
body strength. Participants were asked to stand and hold the dynamometer by their testing hand,
which was held slightly away from the other parts of the body, and with the grip meter indicator facing
outward. The measurement was recorded after squeezing the handle of the dynamometer as hard as
they could without swinging the dynamometer [23].
2.5. Sit and Reach Test
A trunk flexibility box was used to assess body flexibility. Participants were asked to sit with
bare feet, legs extended, toes pointing up, and feet approximately hip-wide, and with the soles of
the feet against the base of the measuring device. Then, they were asked them to push the slide slowly
forward, as far as they could, by placing one hand on top of the other and without lifting their knee
from the ground. The measurement was recorded while in a static position for a couple of seconds at
the point of greatest reach [24].
2.6. Sit-to-Stand Test
A standard chair without arm supports was used to assess lower body strength and muscle
endurance. Participants were asked to stand up from and sit down on the chair with their feet resting
on the floor and their hands crossed at the wrists and held stationary on their shoulders; they were
asked to repeat this procedure as many times as possible within one minute at a participant-defined
pace. The participant was informed when 30 and 15 s were left in the test. The number of completed
repetitions was counted considering standing as being in full extension (knee and hip extension) and
sitting as being in a position with their knees at 90◦ flexion [25].
2.7. Two-Minute Step Test
A two-minute step test was preformed to assess cardiorespiratory endurance. Participants were
asked to stand up straight behind poles with rubber bands. A rubber band was adjusted at the level
corresponding to midway between the patella and iliac crest. The subject was then asked to march
in place for two minutes, lifting their knees to the height of the rubber band. Resting or sitting on
a chair placed behind the participant was allowed if needed. The participant was notified when 1 min
was completed and when 30 seconds were remaining, and participants were given verbal motivation.Int. J. Environ. Res. Public Health 2020, 17, 2723 4 of 15
The test was stopped after two minutes of stepping, and the total number of repetitions of the right
knee reaching the rubber band level in two minutes was recorded [26].
2.8. Statistical Procedure
Descriptive statistical analysis was used to analyze average and standard deviation by age group
and gender of older adults. The Shapiro–Wilk test was completed for the normality test. Cajori’s
5-grade evaluation norms [27] were used to develop health-related physical fitness norms for the tested
components on the basis of age group and gender. Percentile was used to develop fitness awards and
certificates of recognition.
3. Results
The general characteristics of the participants are presented in Table 1. Mean and standard
deviations for anthropometric measurements height, weight, body mass index (BMI), and percent
body fat are presented in Tables 2–6 and the health-related physical fitness components grip strength,
relative grip strength (grip strength calculation considering weight), 1-min sit-to-stand, sit and reach,
and 2-minute steps are presented in Tables 7–12.
Table 1. General characteristics of the participants.
Characteristics Sub-Characteristics No. of Participants Percent (%)
Male 449 44.50
Gender
Female 560 55.50
Brahman 199 19.72
Chettri 183 18.14
Janjati 457 45.29
Ethnic Group
Dalit 101 10.01
Madeshi 4 0.40
Other 65 6.44
Illiterate 731 72.45
Non-Formal 129 12.78
Basic 91 9.02
Education
Secondary 44 4.36
Under-Graduate 7 0.69
Graduate 7 0.69
Married 774 76.71
Marital Status Unmarried 0 0.00
Widow/Widower 235 23.29
Small with Children 62 6.14
Family Type Small without Children 88 8.72
Joint 859 85.13
Non 950 94.15
* Tobacco Intake Past 9 0.89
Current 50 4.96
No 862 85.43
Drinking Habit
Yes 147 14.57
Rural 705 69.87
Covered Area
Urban 304 30.13
Within six months 87 8.62
Regular Health
Within twelve months 127 12.58
Check-up
Never 795 78.79
* Tobacco intake include both smoke and smokeless tobacco.Int. J. Environ. Res. Public Health 2020, 17, 2723 5 of 15
Table 2. Height based on age group and gender, Unit: cm.
Male Female
Age Group
n M SD n M SD
60–64 121 152.9 8.15 198 152.1 8.72
64–69 140 151.3 8.45 185 152.4 8.52
70–74 85 151.4 8.16 101 150.8 8.84
75–79 66 151.2 8.41 50 153.5 7.73
80+ 37 148.4 9.12 26 154.0 8.46
M = mean; SD = standard deviation.
Table 3. Weight based on age group and gender, Unit: kg.
Male Female
Age Group
n M SD n M SD
60–64 121 52.5 11.25 188 52.0 11.41
64–69 140 48.5 10.93 185 48.5 11.76
70–74 85 47.6 8.49 101 46.1 10.80
75–79 66 46.8 11.00 50 48.5 10.53
80+ 37 43.3 9.87 26 47.0 10.09
M = mean; SD = standard deviation.
Table 4. Body mass index (BMI) based on age group and gender before log transformation, Unit: kg/m2 .
Male Female
Age Group
n M SD n M SD
60–64 121 21.7 3.59 198 22.9 4.91
64–69 140 20.9 3.65 185 20.9 4.12
70–74 85 20.5 3.05 101 20.6 4.00
75–79 66 19.2 3.92 50 20.2 3.89
80+ 37 19.0 3.41 26 19.3 3.00
M = mean; SD = standard deviation.
Table 5. BMI based on age group and gender after log transformation, Unit: kg/m2 .
Male Female
Age Group
n M SD n M SD
60–64 121 3.06 0.61 198 3.11 0.21
64–69 140 3.02 0.17 185 3.02 0.20
70–74 85 3.01 0.14 101 3.01 0.19
75–79 66 19.2 3.92 50 20.2 3.89
80+ 37 19.0 3.41 26 19.3 3.00
M = mean; SD = standard deviation; age groups 60–64, 65–69, and 70–74 are transformed log data.Int. J. Environ. Res. Public Health 2020, 17, 2723 6 of 15
Table 6. Percent body fat based on age group and gender, Unit: %.
Male Female
Age Group
n M SD n M SD
60–64 121 23.1 7.90 198 34.3 9.95
64–69 140 23.4 7.80 185 32.2 9.07
70–74 85 23.6 7.80 101 31.6 9.46
75–79 66 23.7 7.90 50 31.3 9.24
80+ 37 23.8 8.00 26 29.8 8.95
M = mean; SD = standard deviation.
Table 7. Grip strength based on age group and gender, Unit: kg.
Male Female
Age Group
n M SD n M SD
60–64 121 26.9 6.91 198 17.7 4.26
64–69 140 23.0 6.37 185 16.0 4.26
70–74 85 22.4 6.29 101 15.3 4.30
75–79 66 21.4 7.01 50 14.5 4.62
80+ 37 17.2 6.13 26 12.6 3.75
M = mean; SD = standard deviation; dominant hand’s score was calculated as mean and standard deviation.
Table 8. Relative grip strength based on age group and gender, Unit: %.
Male Female
Age Group
n M SD n M SD
60–64 121 49.3 12.20 198 36.6 11.03
64–69 140 45.1 12.72 185 36.2 10.65
70–74 85 45.0 12.77 101 35.7 10.44
75–79 66 43.2 13.10 50 34.8 10.59
80+ 37 36.3 13.13 26 32.8 10.63
M = mean; SD = standard deviation; relative grip strength was calculated considering the weight.
Table 9. Sit and reach based on age group and gender before log transformation. Unit: cm.
Male Female
Age Group
n M SD n M SD
60–64 121 7.1 5.47 198 14.8 5.81
64–69 140 5.73 5.27 185 14.3 6.43
70–74 85 5.2 5.07 101 13.1 5.5
75–79 66 4.08 3.7 50 10.8 5.9
80+ 37 3.98 3.58 26 10 2.10
M = mean; SD = standard deviation.Int. J. Environ. Res. Public Health 2020, 17, 2723 7 of 15
Table 10. Sit and reach based on age group and gender after log transformation. Unit: cm.
Male Female
Age Group
n M SD n M SD
60–64 121 1.5 1.16 198 2.5 0.80
64–69 140 0.5 0.55 185 2.4 0.83
70–74 85 0.9 1.36 101 2.4 0.73
75–79 66 0.8 1.17 50 2.1 0.95
80+ 37 0.8 1.2 26 2.1 0.79
M = mean, SD = standard deviation.
Table 11. One-minute sit-to-stand based on age group and gender, Unit: reps.
Male Female
Age Group
n M SD n M SD
60–64 121 27.3 7.24 198 22.7 7.86
64–69 140 25.5 8.10 185 20.7 7.06
70–74 85 23.4 8.52 101 20.0 5.61
75–79 66 22.8 8.04 50 17.9 6.90
80+ 37 21.0 7.09 26 16.0 7.26
M = mean; SD = standard deviation.
Table 12. Two-minute steps based on age group and gender, Unit: reps.
Male Female
Age Group
n M SD n M SD
60–64 121 57.7 18.96 198 44.8 16.39
64–69 140 56.2 19.18 185 42.3 15.74
70–74 85 49.5 18.48 101 41.9 11.85
75–79 66 44.5 18.60 50 37.7 13.90
80+ 37 42.5 19.33 26 34.5 13.73
M = mean; SD = standard deviation.
Table 1 shows 55.50% of the study population were female and 45.29% were janjati. Nearly 73%
of the participants were illiterate and only 0.69% were graduates. Table 1 also shows that 23.29%
of the participants were widowed and 85.13% were living in joint families. Nearly 95% of study
group were non-smokers and nearly 86% were non-drinkers. Nearly 70% of the participants were
from rural areas of Dhangadhi Sub-Metropolitan City. Table 1 also shows that nearly 78.79% of
the study population never had a health check-up and only 8.62% had a health check-up within the last
six months.
As indicated in Tables 2–12, gradual declines in scores were observed over the 5-year age spans
for both males and females in all the tests except height and weight in both males and females and
percent body fat in males. Height was similar in both male and female age groups. Weight was similar
in both males and females from the 60–64 and 70–74 year age groups but females’ average weight was
higher in the 75–79 and 80+ age groups than the that of the same male age groups. BMI and percent
body fat were higher in the female age groups than those in the male age groups and showed gradual
declines in the female age groups as age increased. The percent body fat remained almost constant
for all age groups of males. Grip strength and relative grip strength scores showed a gradual decline
in the 5-year age spans and were higher in all male age groups than those of the female age groups.
The result showed a gradual decline in sit-to-stand scores in both male and female age groups as age
increased. Male showed better sit-to-stand scores in all age groups than those of female age groups.
We also saw a gradual decline in 2-minute step scores in both male and female age groups as ageInt. J. Environ. Res. Public Health 2020, 17, 2723 8 of 15
increased. Male scores were better in all age groups than those of female age groups. Flexibility also
declined gradually in all age groups as the age increased. In contrast with other test results, flexibility
was better in all female age groups than that of male age groups. Reported diagnoses were mainly
high blood pressure, diabetes, and arthritis, but some participants had heart disease.
3.1. Fitness Evaluation Norms
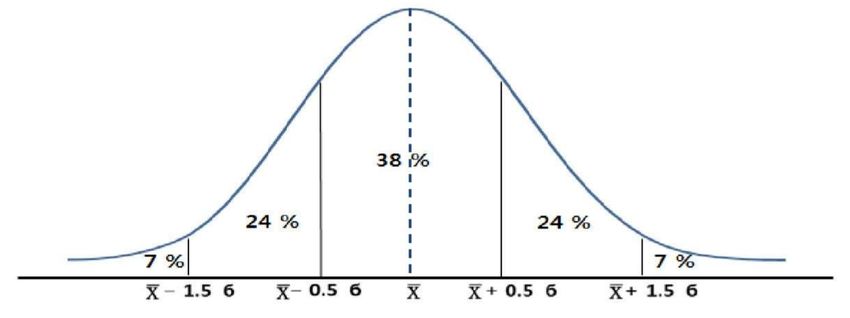
As mentioned above, Cajori’s 5-grade evaluation norms were used to develop older adults’
health-related fitness norms for the tested components on the basis of age group and gender. For
the anthropometric measurements, such as BMI and percent body fat, the 5-grade relative evaluation
was obesity (7%) if there was mean + 1.5σ or above and over weight (24%) if there was mean +
(0.5σ~1.5σ). It was normal (38%) if there was mean ± 0.5σ. It was evaluated as thin (24%) when
included in the range of mean + (−0.5σ to −1.5σ) and very thin (7%) when included below the range of
mean −1.5σ. In contrast, for health-related fitness components such as grip strength, sit and reach,
sit-to-stand, and 2-minute steps, the 5-grade relative evaluation was excellent (7%) if there was mean +
1.5σ or above and very good (24%) if there was mean + (0.5σ~1.5σ). It was normal (38%) if there was
mean ± 0.5σ. It was poor (24%) when included in the range of mean + (−0.5σ to −1.5σ) and very poor
(7%) when included below the range of mean −1.5σ (Figure 1). The evaluation norms calculated by
applying Cajori’s 5-grade evaluation norms are presented in Tables 13–19.
Figure 1. Cajori 5-grade evaluation norms.
Table 13. BMI 5-grade relative evaluation norms, Unit: kg/m2 .
Gender Age Group Obesity Over Weight Normal Thin Very Thin
60–64 27.1 23.5~27.1 19.9~23.5 16.3~19.9 16.3
65–69 26.4 22.7~26.4 19.1~22.7 15.4~19.1 15.4
Male 70–74 25.1 22.1~25.1 19.0~22.1 16.0~19.0 16.0
75–79 25.1 22.1~25.1 18.3~22.1 14.3~18.3 14.3
80+ 24.1 20.7~24.1 17.3~20.7 13.9~17.3 13.9
60–64 30.2 25.3~30.2 20.4~25.3 15.5~20.4 15.5
65–69 27.0 22.9~27.0 18.8~22.9 14.7~18.8 14.7
Female 70–74 26.6 22.6~26.6 18.6~22.6 14.6~18.6 14.6
75–79 26.0 21.1~26.0 18.2~22.1 14.3~18.2 14.3
80+ 23.8 20.8~23.8 17.8~20.8 14.8~17.8 14.8Int. J. Environ. Res. Public Health 2020, 17, 2723 9 of 15
Table 14. Percent body fat 5-grade relative evaluation norms, Unit: %.
Gender Age Group Obesity Over Weight Normal Thin Very Thin
60–64 35.0 27.1~35.0 19.2~27.1 11.3~19.2 11.3
65–69 35.1 27.3~35.1 19.5~27.3 11.7~19.5 11.7
Male 70–74 35.3 27.5~35.3 19.7~27.5 11.9~19.7 11.9
75–79 35.6 27.7~35.6 19.8~27.7 11.9~19.8 11.9
80+ 35.8 27.8~35.8 19.8~27.8 11.8~19.8 11.8
60–64 49.3 39.3~49.3 29.4~39.3 19.4~29.4 19.4
65–69 45.8 36.7~45.8 27.7~36.7 18.6~27.7 18.6
Female 70–74 45.8 36.3~45.8 26.8~36.3 17.4~26.8 17.4
75–79 45.2 36.0~45.2 26.7~36.0 17.5~26.7 17.5
80+ 43.2 34.2~43.2 25.3~34.2 16.3~25.3 16.3
Table 15. Grip strength 5-grade relative evaluation norms, Unit: kg.
Gender Age Group Excellent Very Good Good Poor Very Poor
60–64 37.3 30.4~37.3 23.4~30.4 16.5~23.4 16.5
65–69 32.6 26.2~32.6 19.9~26.2 13.5~19.9 13.5
Male 70–74 31.8 25.5~31.8 19.3~25.5 13.0~19.3 13.0
75–79 31.8 24.8~31.8 17.9~24.8 10.9~17.9 10.9
80+ 26.4 20.3~26.4 14.2~20.3 8.0~14.2 8.0
60–64 24.1 19.8~24.1 15.5~19.8 11.3~15.5 11.3
65–69 22.4 18.1~22.4 13.9~18.1 9.6~13.9 9.6
Female 70–74 21.8 17.5~21.8 13.2~17.5 8.9~13.2 8.9
75–79 21.5 16.8~21.5 12.2~16.8 7.6~12.2 7.6
80+ 18.2 14.5~18.2 10.7~14.5 7.0~10.7 7.0
Table 16. Relative grip strength 5-grade relative evaluation norms, Unit: %.
Gender Age Group Excellent Very Good Good Poor Very Poor
60–64 67.6 55.4~67.6 43.2~55.4 31.0~43.2 31.0
65–69 64.2 51.5~64.2 38.7~51.5 26.0~38.7 26.0
Male 70–74 64.2 51.4~64.2 38.6~51.4 25.9~38.6 25.9
75–79 62.9 49.8~62.9 36.7~49.8 23.6~36.7 23.6
80+ 56.0 42.8~56.0 29.7~42.8 16.6~29.7 16.6
60–64 53.2 42.1~53.2 31.1~42.1 20.1~31.1 20.1
65–69 52.2 41.5~52.2 30.9~41.5 20.2~30.9 20.2
Female 70–74 51.4 40.9~51.4 30.5~40.9 20.0~30.5 20.0
75–79 50.7 40.1~50.7 29.6~40.1 19.0~29.6 19.0
80+ 48.8 38.1~48.8 27.5~38.1 16.9~27.5 16.96
Table 17. Sit and reach 5-grade relative evaluation norms, Unit: cm.
Gender Age Group Excellent Very Good Good Poor Very Poor
60–64 15.3 9.8~15.3 4.4~9.8 −1.1~4.4 −1.1
65–69 13.6 8.4~13.6 3.1~8.4 −2.2~3.1 −2.2
Male 70–74 12.8 7.7~12.8 2.7~7.7 −2.4~2.7 −2.4
75–79 9.6 5.9~9.6 2.2~5.9 −1.5~2.2 −1.5
80+ 9.4 5.8~9.4 2.2~5.8 −1.4~2.2 −1.4
60–64 23.5 17.7~23.5 11.~17.7 6.1~11.9 6.1
65–69 23.9 17.5~23.9 11.1~17.5 4.7~11.1 4.7
Female 70–74 21.4 15.9~21.4 10.4~15.9 4.9~10.4 4.9
75–79 19.7 13.8~19.7 7.9~13.8 2.0~7.9 2.0
80+ 13.2 11.1~13.2 9.0~11.1 6.9~9.0 6.9Int. J. Environ. Res. Public Health 2020, 17, 2723 10 of 15
Table 18. One-minute sit-to-stand 5-grade relative evaluation norms, Unit: reps.
Gender Age Group Excellent Very Good Good Poor Very Poor
60–64 38 31~38 24~31 17~24 17
65–69 38 30~38 22~30 13~22 13
Male 70–74 36 28~36 19~28 11~19 11
75–79 35 27~35 19~27 11~19 11
80+ 32 25~32 18~25 10~18 10
60–64 35 27~35 19~27 11~19 11
65–69 31 24~31 17~24 10~17 10
Female 70–74 28 23~28 17~23 12~17 12
75–79 28 21~28 15~21 8~15 8
80+ 27 20~27 12~20 5~12 5
Table 19. Two-minute steps 5-grade relative evaluation norms, Unit: reps.
Gender Age Group Excellent Very Good Good Poor Very Poor
60–64 86 67~86 48~67 29~48 29
65–69 85 66~85 40~59 27~47 27
Male 70–74 77 59~77 40~59 22~40 22
75–79 72 54~72 35~54 17~35 17
80+ 72 52~72 33~52 14~33 14
60–64 69 53~69 37~53 20~37 20
65–69 66 50~66 35~50 19~35 19
Female 70–74 60 48~60 36~48 24~36 24
75–79 59 45~59 31~45 17~31 17
80+ 55 41~55 28~41 14~28 14
3.2. Stages of Fitness Awards or Certificates for Older Adult
Recognition for achievement is considered as a motivation for those who want improvement in
physical fitness. One of the main reasons for the development of the fitness awards was to provide
motivation for those using the test. It is a means of self-assessment that may assure a greater degree
of personal safety and the proper determination of exercise intensity. It can motivate individuals to
take the test, use the test for the development of a personal strategy to improve physical fitness, and
commit themselves to continue the physical activities to maintain their well-being.
Health-related physical fitness awards for Nepalese older adults was developed on the basis of
the percentiles (70th, 50th, and 30th) of each test item by gender and age as shown in Table 20 [28].
Participants will get a medal award or certificate of recognition only after meeting the fitness
award criteria.Int. J. Environ. Res. Public Health 2020, 17, 2723 11 of 15
Table 20. Older adult health-related fitness award norms.
Fitness Award Award Award Norms
- Body Composition (BMI and % Body
Gold Fat) excluded
Awards - All health-related physical components should
be at least 70th percentile (above 30%)
Older Adult Health-Related - Body Composition (BMI and % Body
Physical Fitness Award Norms Silver Fat) excluded
Award - All health-related physical components should
be equal or above 50th percentile
- Body Composition should be in
Bronze the recommended range
Award - All health-related physical components should
be equal or above 30th percentile (below 30%)
7% < male % body fat < 35%
16% < female % body fat < 32%
Body Composition Option
18 < male BMI < 25
18 < male BMI < 25
Body composition scores (BMI and percent body fat) were excluded in the gold award. For
the gold award, all the health-related fitness test components should be at least in the 70th percentile.
Except body composition, all health-related fitness test components must be equal or above the 50th
percentile and below the 70th percentile for the silver award. The bronze medal is certified if the body
composition is in the recommended range. BMI must be 18 kg/m2 to 25 kg/m2 in both males and
females, and percent body fat should be 7%– 35% for males and 16%– 32% for females. All four
health-related fitness tests must be above the 30th percentile and below the 50th percentile.
4. Discussion
Maintaining independence in older adults becomes important due to the challenges of
the demographic shift [29]. A fitness test is a combination of a sequence of exercises that assesses
overall health and physical status of an individual. It is known to be the initial phase in the design of
a suitable exercise program based on a baseline score for general health and fitness purposes [30].
In this study, we determined norms of health-related physical fitness components based on gender
and age groups for older adults of Nepal. Selected test components are easy and safe to assess for
inactive and very active older adults. These test components are the best to assess health-related
physical fitness in a country like Nepal because they are inexpensive, space efficient, and transportable
as they do not require advanced devices or separate room.
This is the first study in the physical fitness field in Nepal. It is centered only in the single
Sub-Metropolitan City of the far western development region of Nepal. The analysis shows an
interesting factor that BMI data in specific age groups (60–64, 65–69, 70–74), and sit and reach data in
all age groups were not in normal distribution in both genders. Further studies in every age group,
children, adolescents, adults, and even in older adults, are needed. In addition, studies covering all
altitudes and areas of Nepal should be completed in the future.
The basic body functions, such as strength, endurance, flexibility, and balance on extremities, are
all important to sustain physical independence at older ages [31]. A reduction in lean body mass and
an increase in fat mass may increase mortality risk in older adults [32]. Thus, maintaining body a mass
index (BMI) at a healthy level with more muscular mass than fat mass is essential.Int. J. Environ. Res. Public Health 2020, 17, 2723 12 of 15
Generally, fat and lean soft tissues change gradually with age and are believed to be associated
primarily with imbalances between energy intake and expenditure due to an increasingly sedentary
lifestyle [33]. Our study shows relative stability of percent body fat in older adult males but a decrease
with age in female older adults, similar to Baumgartner et al. [33]. The World Health Organization
(WHO) had recommended body mass index (BMI) greater than 23 kg/m2 and less than 28 kg/m2 as
normal BMI for older adults [34]; which is higher than most BMI values found in this study. Overweight
is not associated with an increased risk of mortality. In contrast, risk of mortality increases in older
adults with BMI values less than 23 kg/m2 [32], which shows a poor health status in the older adults
of Nepal.
In this study, analysis of grip strength, sit-to-stand (STS), and 2-minute steps by gender shows
higher grip strength in males at all ages, and analysis by age group shows a gradual decline in grip
strength in both genders, similar to other studies [25,31,35–46]. Our results show lower grip strength
in Nepalese older adults than in older adults in other countries [37,38,40–42] and show higher relative
grip strength in older females in Nepal than in Korean female older adults [42]. Relative grip strength
is calculated considering weight [47], that is the reason for a higher relative grip strength in Nepalese
females. The sit-to-stand test was done for 1 min similar to [25,43,44]. Nepal’s life expectancy is
70.2 years (68.8 years and 71.6 years for males and female, respectively) [48] and it is hard to find
healthy 80+ older adults [49]. The 1-minute STS test is better to determine lower body muscular
strength and endurance in an older adult below the age of 80 years [25]. In addition, STS performance
was significantly associated with standing, good balance, coordination, and aerobic capacity that cover
several components of physical fitness [43,50–52]. This study does not asses the balance test separately.
Thus, the 1-minute sit-to-stand test was selected for lower body strength and endurance, balance, and
coordination. Lower body muscular strength and endurance were also found poorer than in other
countries [25,43].
Aerobic exercise capacity is also one of the fundamental components of health-related physical
fitness tests. Among many modes of a cardiorespiratory endurance test, the 2-minute step test
introduced by Rikli and Jones as part of the Senior Fitness Test in 1999 is easy to conduct in almost any
setting [31,35]. In comparison to other studies [31,41,42,45,46], cardiorespiratory endurance was also
found to be poor in Nepalese older adults. Sit and reach, one of the popular field-test components of
Health Related Physical Fitness Test (HRPFT) to measure flexibility in the lower back and hamstring
muscles, was assessed in this study [53]. Female flexibility was similar to that of Korean female older
adults and poorer than that of male older adults [40,42].
Some important findings for the participants from Nepal are as follows: a) very poor BMI, even
lower than the baseline of the average recommended by the WHO for older adults; b) with increasing
age, both genders showed a declining score in muscular strength and endurance, flexibility, and
cardiorespiratory endurance with poor results in comparison to other countries; c) in every test except
flexibility, males had higher scores with better results in comparison to women from the same age
group; d) 72.45% of people were illiterate; e) 78.79% of people did not get regular health check-ups and
more of the older adult population lived in rural areas than urban areas. Poor fitness scores compared
to other countries shows a lower level of physical activity and exercises in older adults of Nepal.
A higher percentage of illiteracy and lack of regular health check-ups suggests a poor awareness status
about health and physical activities. Poor BMI values show a higher risk of mortality in older adults of
Nepal. Considering the finding of this study: a) Administrators, physical educators, instructors, and
health instructors should encourage older adults to do physical activities and exercise as recommended
by the WHO [54]; b) Regular awareness programs about physical activities, good health, and quality of
life should be providedl c) A wide range of activities should be identified and arranged according to
older adults’ interests and needs; and d) Fitness should be tested regularly as per norms.
Cross-sectional design, covering only health-related fitness components, and testing only in
the Terai region of Nepal are the limitations of this study. Despite these limitations, this study includedInt. J. Environ. Res. Public Health 2020, 17, 2723 13 of 15
both urban and rural areas of Sub-Metropolitan City and all the major ethnic groups of Nepal. A body
composition analyzer (Inbody, Korea) was use to assess BMI and percent body fat.
The results of this study could be used as approximate indicative values for comparisons among
the same health-related fitness scores of older adults from other developing Asian countries similar to
Nepal. In addition, the scores can be used as benchmark values for health-related fitness evaluations
of older adults of Nepal.
5. Conclusions
This study may help the health and physical education sector to develop appropriate physical
activities or exercise programs for older adults. It may help to identify the fitness level of an individual
and help fitness instructors to develop suitable physical activity interventions for older adults based on
their age. In addition, an awards system may encourage individuals to participate in physical activities
or exercise continuously, which helps lead to a better and more independent life in upcoming years.
Longitudinal studies along with functional fitness studies on older adults and adult fitness studies are
necessary in the future.
Author Contributions: Conceptualization, J.K.K., W.I.S. and K.O.S.; methodology, J.K.K., W.I.S. and K.O.S.;
formal analysis, J.K.K., W.I.S., K.O.S., Y.J.S. and J.S.L.; writing—original draft preparation, J.K.K. and K.O.S.;
writing—review & editing, J.K.K., W.I.S., K.O.S., Y.J.S. and J.S.L. All authors have read and agreed to the published
version of the manuscript.
Funding: This research was funded by Dhangadhi Sub-Metropolitan City, Kailali, Nepal.
Acknowledgments: We acknowledge support of National Fitness Award 100, Samcheok-si, Gangwon-do, Korea,
and Urban Health, Dhangadhi Sub-Metropolitan City, Kailali, Nepal. We further acknowledge support of Sudur
Paschimanchal Academy, Cricket Academy, and volunteers of Dhangadhi Sub-Metropolitan City, Kailali, Nepal.
Conflicts of Interest: The authors declare no conflict of interest. The funders had no role in the design of the study;
in the collection, analyses, or interpretation of data; in the writing of the manuscript, or in the decision to publish
the results.
References
1. Central Bureau of Statistics. Population Monograph of Nepal 2014; National Planning Commission Secretariat:
Kathmandu, Nepal, 2014; Volume 1.
2. A Healthy Majority. Available online: http://archive.nepalitimes.com/news.php?id=18348#.XmhPQqgzaUk
(accessed on 8 July 2011).
3. Senior Citizens Act. Available online: www.lawcommission.gov.np%202063 (accessed on 24 November 2006).
4. Central Bureau of Statistics. National Population and Housing Census 2011, National Report; Planning
Commission Secretariat: Kathmandu, Nepal, 2012.
5. Study on Developing Information Base on Elderly Population of Nepal; Nepal Public Health Foundation:
Kathmandu, Nepal, 2013.
6. Corbin, C.; Masurier, G.L. Fitness for Life, 6th ed.; Human Kinetics: Champaign, IL, USA, 2014.
7. Pescatello, L.S. American College of Sports Medicine (ACSM). ACSM’s Guidelines for Exercise Testing and
Prescription, 9th ed.; Olters Kluwer; Lippincott Williams & Wilkins Health: Philadelphia, PA, USA, 2014.
8. Bouchard, C.; Shephard, R.J.; Stephens, T.; Sutton, J.R.; McPherson, B.D. Exercise, Fitness, and Health:
A Consensus of Current Knowledge; Human Kinetics: Champaign, IL, USA, 1990.
9. Blair, S.N. Physical fitness and all-cause mortality. JAMA 1989, 262, 2395. [CrossRef] [PubMed]
10. García-Hermoso, A.; Cavero-Redondo, I.; Ramírez-Vélez, R.; Ruiz, J.R.; Ortega, F.B.; Lee, D.-C.;
Martínez-Vizcaíno, V. Muscular strength as a predictor of all-cause mortality in an apparently healthy
population: A systematic review and meta-analysis of data from approximately 2 million men and women.
Arch. Phys. Med. Rehabil. 2018, 99, 2100–2113. [CrossRef] [PubMed]
11. Sui, X.; LaMonte, M.J.; Blair, S.N. Cardiorespiratory fitness as a predictor of nonfatal cardiovascular events in
asymptomatic women and men. Am. J. Epidemiol. 2007, 165, 1413–1423. [CrossRef] [PubMed]
12. Yamamoto, K. Human flexibility and arterial stiffness. J. Phys. Fitness Sports Med. 2017, 6, 1–5. [CrossRef]Int. J. Environ. Res. Public Health 2020, 17, 2723 14 of 15
13. Peterson, M.D.; Duchowny, K.; Meng, Q.; Wang, Y.; Chen, X.; Zhao, Y. Low normalized grip strength is
a biomarker for cardiometabolic disease and physical disabilities among U.S. and Chinese adults. J. Gerontol.
Ser. A. 2017, 72, 1525–1531. [CrossRef]
14. Sawada, S.S.; Lee, I.-M.; Naito, H.; Kakigi, R.; Goto, S.; Kanazawa, M.; Blair, S.N. Cardiorespiratory fitness,
body mass index, and cancer mortality: A cohort study of Japanese men. BMC Public Health 2014, 14, 1012.
[CrossRef]
15. Roshanravan, B.; Patel, K.V.; Fried, L.F.; Robinson-Cohen, C.; de Boer, I.H.; Harris, T. Association of muscle
endurance, fatigability, and strength with functional limitation and mortality in the health aging and body
composition study. J. Gerontol. Ser. A Biol. Sci. Med. Sci. 2016, 72, 284–291. [CrossRef]
16. Yamamoto, K.; Gando, Y. Can body flexibility predict arterial stiffening? J. Osteopor. Phys. Act. 2018, 6, 2.
[CrossRef]
17. Huang, Y.C.; Malina, R.M. Physical activity and health-related fitness in Taiwanese adolescents. J. Physiol.
Anthropol. Appl. Hum. Sci. 2002, 21, 11–19. [CrossRef]
18. Sharkey, B.J. Physiology of Fitness; Human Kinetics: Champaign, IL, USA, 1997.
19. Astrand, P.O. Human physical fitness with special reference to sex and age. Physiol. Rev. 1956, 36, 307–335.
[CrossRef]
20. Chodzko-Zajko, W.J.; Proctor, D.N.; Fiatarone-Singh, M.A.; Minson, C.T.; Nigg, C.R.; Salem, G.J. American
College of Sports Medicine position stand. Exercise and physical activity for older adults. Med. Sci.
Sports Exerc. 2009, 41, 1510–1530. [CrossRef] [PubMed]
21. Nelson, M.E.; Rejeski, W.J.; Blair, S.N.; Duncan, P.W.; Judge, J.O.; King, A.C.; Macera, C.A.;
Castaneda-Sceppa, C. Physical activity and public health in older adults: Recommendation from the American
College of Sports Medicine and the American Heart Association. Med. Sci. Sports Exerc. 2007, 39, 1435–1445.
[CrossRef] [PubMed]
22. Rikli, R.E.; Jones, C.J. Senior Fitness Test Manual; Human Kineties: Champaign, IL, USA, 2001.
23. Yu, R.; Ong, S.; Cheung, O.; Leung, J.; Woo, J. Reference Values of Grip Strength, Prevalence of Low Grip
Strength, and Factors Affecting Grip Strength Values in Chinese Adults. J. Am. Med. Dir. Assoc. 2017, 18,
551.e9–551.e16. [CrossRef]
24. Lopez-Minarro, P.A.; Andujar, P.S.D.B.; Rodrnguez-Garcia, P.L. A comparison of the sit-and-reach test and
the back-saver sit-and-reach test in university students. J. Sports Sci. Med. 2009, 8, 116–122.
25. Strassmann, A.; Steurer-Stey, C.; Lana, K.D.; Zoller, M.; Turk, A.J.; Suter, P.; Puhan, M.A. Population-based
reference values for 1-min sit-to-stand test. Int. J. Public Health 2013, 58, 949–953. [CrossRef]
26. Rikli, R.E.; Jones, C.J. Development and Validation of Criterion-Referenced Clinically Relevant Fitness
Standards for Maintaining Physical Independence in Late Years. Gerontologist 2012, 53, 255–267. [CrossRef]
27. Heunghwan, K. Measurement Evaluation of Physical Education; Yonsei University Publication: Seoul, Korea,
1982; pp. 480–481.
28. Report on Results of Physical Fitness Measurement and Development of Additional Components; National Fitness
Award; Korea Institute of Sport Science: Seoul, Korea, 2018.
29. Grady, P.A. Advancing the health of our aging population: A lead role for nursing science. Nurs. Outlook
2011, 59, 207–209. [CrossRef]
30. National Strength and Conditioning Association. Essentials of Personal Training, 2nd ed.; Human Kinetics:
Champaign, IL, USA, 2017.
31. Rikli, R.E.; Jones, C.J. Functional fitness normative scores for community-residing older adults, ages 60–94.
J. Aging Phys. Act. 1999, 7, 162–181. [CrossRef]
32. Winter, J.E.; Macinnis, R.J.; Wattanapenpaiboon, N.; Nowson, C.A. BMI and all-cause mortality in older
adults: A meta-analysis. Am. J. Clin. Nutr. 2014, 99, 875–890. [CrossRef]
33. Baungartner, R.N.; Stauber, P.M.; McHugh, D.; Koehler, K.M.; Garry, P.J. Cross-sectional age differences in
body composition in persons 60+ years of age. J. Gerontol. A Biol. Med. Sci. 1995, 50, M307–M316. [CrossRef]
34. Rios-Marquez, A.C.; Perez-Zepeda, M.U.; Gonzalez-Lara, M. Body mass index in older adults: Controversial
issues. J. Lat. Am. Geriat. Med. 2016, 2, 67–70.
35. Rikli, R.E.; Jones, C.J. The development and validation of a functional fitness test for community-residing
older adults. J. Aging Phys. Act. 1999, 7, 129–161. [CrossRef]Int. J. Environ. Res. Public Health 2020, 17, 2723 15 of 15
36. Massy-Westropp, N.M.; Gill, T.K.; Taylor, A.W.; Bohannon, R.W.; Hill, C.L. Hand grip strength: Age and
gender stratified normative data in a population-based study. BMC Res. Notes 2011, 14, 127. [CrossRef]
[PubMed]
37. Angst, F.; Drerup, S.; Werle, S.; Herren, D.B.; Simmen, B.R.; Goldhahn, J. Prediction of grip and key pinch
strength in 978 healthy subjects. BMC Musculoskelet. Disord. 2010, 11, 94. [CrossRef]
38. Bohannon, R.W.; Peolsson, A.; Massy-Westropp, N.; Desrosiers, J.; Bear-Lehman, J. Reference values for adult
grip strength measured with a Jamar dynamometer: A descriptive meta-analysis. Physiotherapy 2006, 92,
11–15. [CrossRef]
39. Bassy, E.J.; Harries, U.J. Normal values for handgrip strength in 920 men and women over 65 years, and
longitudinal changes over 4 years in 620 survivors. Clin. Sci. 1993, 84, 331–337. [CrossRef]
40. Yoo, S.H.; Nho, H.S. Measurement on the physical fitness of daily living and development of index for
the elderly women. Korean J. Phys. Educ. 2001, 40, 565–574.
41. Kim, C.H.; Bae, Y.J.; Lee, W.Y. The study of criterion for fitness in Korean elderly. Korean J. Phys. Educ. 2000,
39, 453–466.
42. Choi, K.J.; Go, B.G.; Song, H.S.; Kim, K.J.; Park, S.J.; Cho, J.H.; Yi, K.O.; Shin, S.Y.; Park, J.H.; Lee, G.S.
The Development of physical fitness test battery and evaluation criteria of it for Korean elderly person.
Korean J. Meas. Eval. Phys. Educ. Sport Sci. 2014, 16, 15–30.
43. Ritchie, C.; Trost, S.G.; Brown, W.; Armit, C. Reliability and validity of physical fitness field tests for adults
aged 55 to 70 years. J. Sci. Med. Sport 2005, 8, 61–70. [CrossRef]
44. Mortia, A.A.; Bisca, G.W.; Machado, F.V.C.; Hernandes, N.A.; Pitta, F.; Probst, V.S. Best protocol for the Sit to
Stand Test in Subject With COPD. Respir. Care 2018, 63, 1040–1049. [CrossRef]
45. Cicioglu, I. Assessment of physical fitness levels of elderly Turkish males over 60 years. Coll. Antropol. 2010,
34, 1323–1327. [PubMed]
46. Milanovi, Z.; Panteli, S.; Trajkovi, N.; Sporiš, G.; Kosti, R.; James, N. Age-related decrease in physical activity
and functional fitness among elderly men and women. Clin. Interv. Aging 2013, 8, 549–556. [CrossRef]
[PubMed]
47. Development of National Fitness Awards for Adolescence; National Fitness Award; Korea Institute of Sport
Science: Seoul, Korea, 2018.
48. Life Expectancy in Nepal. Available online: https://www.worldlifeexpectancy.com/nepal-life-expectancy
(accessed on 29 November 2019).
49. Health Profile Nepal. Available online: https://www.worldlifeexpectancy.com/country-health-profile/nepal
(accessed on 4 November 2019).
50. Schenkman, M.; Hughes, M.A.; Samsa, G.; Studenski, S. The relative importance of strength and balance in
chair rise by functionally impaired older individuals. J. Am. Geriatr. Soc. 1996, 44, 1441–1446. [CrossRef]
51. Thapa, P.B.; Gideon, P.; Fought, R.L.; Kormicki, M.; Ray, W.A. Comparison of clinical and biomechanical
measures of balance and mobility in elderly nursing home residents. J. Am. Geriatr. Soc. 1994, 42, 493–500.
[CrossRef]
52. Hardy, R.; Cooper, R.; Shah, I.; Harridge, S.; Guralnik, J.; Kuh, D. Is chair rise performance a useful measure
of leg power? Aging Clin. Exp. Res. 2010, 22, 412–418. [CrossRef]
53. Hui, S.S.; Yuen, P.Y. Validity of the modified back-saver sit-and-reach test: A comparison with other protocols.
Med. Sci. Sports Exerc. 2000, 32, 1655–1659. [CrossRef]
54. Global Recommendations on Physical Activities for Health. Available online: https://www.ncbi.nlm.nih.gov/
books/NBK305057/ (accessed on 7 April 2020).
© 2020 by the authors. Licensee MDPI, Basel, Switzerland. This article is an open access
article distributed under the terms and conditions of the Creative Commons Attribution
(CC BY) license (http://creativecommons.org/licenses/by/4.0/).You can also read


