Relationships among types of activity engagement and insomnia symptoms among older adults - BMC Geriatrics
←
→
Page content transcription
If your browser does not render page correctly, please read the page content below
Kim et al. BMC Geriatrics    (2021) 21:87
https://doi.org/10.1186/s12877-021-02042-y

 RESEARCH ARTICLE                                                                                                                                  Open Access

Relationships among types of activity
engagement and insomnia symptoms
among older adults
Da Eun Kim1* , Tonya J. Roberts2 and Chooza Moon3

  Abstract
  Background: An increasing awareness exists that lack of activity engagement is associated with insomnia
  symptoms. However, the majority of studies have focused on the association between a single type of activity
  engagement and insomnia symptoms.
  Methods: This is a cross-sectional study using secondary data from the Health and Retirement Study examining the
  relationships among different types of activity engagement and insomnia symptoms among older adults. The
  sample for this study included 3321 older adults who responded to survey modules on activity engagement and
  insomnia symptoms in 2016. Activity engagement was measured using items for three types of activities (i.e., social,
  cognitive, and physical) validated in this study. Insomnia symptoms were measured using four items (i.e., difficulty
  of falling asleep, waking up during the night, waking up too early, and feeling rested). Independent t-tests were
  conducted to identify the differences in insomnia symptoms according to activity engagement level. Regressions
  were conducted to examine the associations among three types of activity engagement and insomnia symptoms
  after adjusting for covariates such as demographics, chronic disease, activities of daily living difficulty, cognitive
  function, sleep disorder, loneliness, and caregiving.
  Results: The respondents in the high-level social, cognitive, and physical activity engagement groups were found
  to show fewer insomnia symptoms. Furthermore, higher social (β = − 0.04, p = 0.040) and cognitive (β = − 0.06, p =
  0.007) activity engagements were associated with fewer insomnia symptoms even after adjusting for other types of
  activity engagement and all covariates.
  Conclusions: This study suggests that older adults with higher social and cognitive activity engagements may be
  likely to have fewer insomnia symptoms. Based on these results, future research is needed to develop multi-
  component intervention programs that can encourage older adults to engage in these activities.
  Keywords: Sleep, Leisure activities, Exercise, Aged

* Correspondence: daeunkim@knu.ac.kr
1
 College of Nursing and Research Institute of Nursing Science, Kyungpook
National University, Daegu, Republic of Korea
Full list of author information is available at the end of the article

                                       © The Author(s). 2021, corrected publication 2021. Open Access This article is licensed under a Creative Commons Attribution
                                       4.0 International License, which permits use, sharing, adaptation, distribution and reproduction in any medium or format, as
                                       long as you give appropriate credit to the original author(s) and the source, provide a link to the Creative Commons licence,
                                       and indicate if changes were made. The images or other third party material in this article are included in the article's Creative
                                       Commons licence, unless indicated otherwise in a credit line to the material. If material is not included in the article's Creative
                                       Commons licence and your intended use is not permitted by statutory regulation or exceeds the permitted use, you will need
                                       to obtain permission directly from the copyright holder. To view a copy of this licence, visit http://creativecommons.org/
                                       licenses/by/4.0/. The Creative Commons Public Domain Dedication waiver (http://creativecommons.org/publicdomain/zero/1.
                                       0/) applies to the data made available in this article, unless otherwise stated in a credit line to the data.
Kim et al. BMC Geriatrics (2021) 21:87 Page 2 of 10 Background Accordingly, there is a growing body of research Insomnia symptoms are recognized as a significant examining the association of sleep and different types of symptom in older adults. Insomnia symptoms are activity engagement. A previous study has concluded defined as complaints of disturbed sleep including diffi- that social participation including religious services, culty initiating sleep, difficulty maintaining sleep, early volunteer work, and organized group meetings is posi- morning awakening, and nonrestorative or poor-quality tively associated with sleep patterns among older adults sleep [1]. Insomnia symptoms are more prevalent in [18]. Cognitive activity such as playing games and knit- older adults than in other age groups, and approximately ting or sewing shows a significant association with fewer 50% of older adults report these symptoms [2]. Insomnia sleep disturbances [19]. In addition, more physical activ- symptoms are associated with adverse outcomes such as ity engagement is associated with higher sleep quality frailty and poor physical and mental health quality of life and better sleep patterns in older adults [20, 21]. How- [3, 4]. Furthermore, people with insomnia symptoms are ever, the majority of previous studies have focused on a more prone to cardiovascular disease, neurologic disease, single type of activity when they examined the relation- and pain [5]. Therefore, fully understanding the factors ship between activity engagement and sleep complaints that influence insomnia symptoms among older adults is among older adults. The association of insomnia symp- imperative. toms with engagement in multiple types of activities Evidence increasingly shows that insomnia symptoms should be examined together because older adults in older adults are associated with a lack of activity engage in various types of activities in their daily lives. It engagement [6]. According to the two-process model of can contribute to a more holistic understanding of the sleep regulation, activity is related to two internal bio- impact of activity engagement on insomnia symptoms. logical sleep–wake mechanisms. The first one is the cir- The overall purpose of this study is to examine the cadian rhythm which synchronizes the sleep–wake relationships among different types of activity engage- rhythm with local time based on external stimuli [7]. ment and insomnia symptoms in older adults. The spe- Structured schedules of activity during the daytime serve cific aims are to compare insomnia symptoms according as external time cues (i.e., Zeitgebers) to continuously to the types of activity engagement (i.e., social, cognitive, regulate the sleep–wake rhythm [7] and increase slow- and physical) and to identify the relationships among wave sleep [8]. The second one is sleep–wake homeosta- different types of activity engagement and insomnia sis, which is maintained by the generation of homeo- symptoms after controlling for other types of activity static sleep pressure or sleep need accumulated by engagement in community-dwelling older adults. wakefulness during the daytime [7]. In particular, phys- ical activity may increase sleep-promoting substance ad- Methods enosine, which increases the homeostatic drive to sleep Study design and dataset [9]. Furthermore, activity engagement may be a modifi- This study is a cross-sectional secondary data analysis able factor that could be targeted for developing inter- using a dataset derived from a population-based longitu- ventions to reduce insomnia among older adults. dinal study, the Health and Retirement Study (HRS). However, the relationship between activity engagement The HRS is sponsored by the National Institute on and insomnia symptoms must be better understood. Aging (grant number NIA U01AG009740) and con- The Senescent Sleep Model, a conceptual model for ducted by the University of Michigan, Ann Arbor, MI, describing factors influencing sleep complaints in older USA. Data can be obtained from the HRS website, persons, states that multiple factors including physical https://hrs.isr.umich.edu. HRS data are collected every 2 and psychosocial factors affect sleep complaints in differ- years beginning in 1992 from Americans who are not in- ent ways [10]. Activity engagement is one factor that can stitutionalized and are over the age of 50 years. Further be related to sleep. Engaging in different types of activ- information about the study design has been published ities can affect sleep through different mechanisms. For by Sonnega et al. [22]. The core dataset collected in example, social activity may reduce loneliness [11] and 2016 was used to conduct data analysis in the current stress [12], which can affect sleep complaints [13]. More- study. over, cognitive activity can provide cognitive stimulation that may reduce sleep complaints among older adults Sample [14]. Also, physical activity can lead to an increase in The inclusion criteria for the present study were partici- core body temperature, which can facilitate initiation of pants who are ≥65 years of age and who responded to sleep [15] and improve sleep through the anxiolytic the items for activity engagement in psychosocial and effects of physical activity [16]. Furthermore, physical lifestyle questionnaires and items for insomnia symp- activity, which may lead to energy expenditure, requires toms in 2016. The core HRS interviews, which include body restoration and better sleep [17]. items about insomnia symptoms, have been conducted
Kim et al. BMC Geriatrics   (2021) 21:87                                                                             Page 3 of 10

every 2 years since 1992. In the case of items for activity     factor model was determined as the final factor structure of
engagement, the HRS started to collect activity data as         the activity engagement questionnaires (see Additional file 1):
part of the psychosocial and lifestyle questionnaires in        social activity (six items: volunteer work with children,
the core dataset from a randomly selected sample of             charity work, educational course, sport or social club, nonre-
50% of the participants in 2006. Those who were inter-          ligious organization, and community arts group), cognitive
viewed in 2006 responded to the questionnaires again in         activity (five items: word games, cards or chess, writing, knit-
2010 and 2014 [23]. The remaining 50% of the partici-           ting, and hobby or project), and physical activity (three items:
pants have been administered psychosocial and lifestyle         maintenance or gardening, playing sports or exercise, and
questionnaires every 4 years beginning 2008 (i.e., 2008,        walking for 20 min). In the three-factor model, seven items
2012, and 2016). Thus, the participants who were inter-         which did not adequately load (< 0.40) were excluded. The
viewed for the activity engagement items in 2016 were           construct validity of the three-factor structure with a total of
about 50% of the total participants in the core HRS             14 activity items was verified using confirmative factor
interviews. The final sample in this study included 3321        analysis. Results indicated that this three-factor model was
persons.                                                        appropriate with an acceptable fit (comparative fit index =
                                                                0.968, Tucker–Lewis index = 0.960, RMSEA = 0.066, and
Measurements                                                    SRMR = 0.048) [26]. The more sensible index of internal
Insomnia symptoms                                               consistency, coefficient omega, which adheres to the congen-
Respondents were asked about their insomnia symptoms            eric model to estimate reliability, was calculated because the
using four items: 1) how often trouble falling asleep, 2)       assumptions of the essentially tau-equivalent model were not
how often trouble with waking up during the night, 3)           met in the data of the current study [27]. Coefficient omega
how often trouble with waking up too early and not be-          was 0.89, 0.72, and 0.68 for social, cognitive, and physical
ing able to fall asleep again, 4) how often feel really         activities, respectively. This indicates an acceptable reliability
rested when waking up in the morning (nonrestorative            (≥ 0.60). The mean score of the items in each subscale,
sleep). Each item was scored on a three-point Likert            ranging from 1 to 3, was calculated. A higher score indicated
scale from 1 (most of the time) to 3 (rarely or never).         higher activity engagement.
The first three items were reverse-coded and a summed
total score was then calculated based on the coding             Covariates
methods in a previous study [24]. The total insomnia            Variables that are recognized as precipitating and per-
symptom score ranged from 3 to 12, with a higher score          petuating risk factors for insomnia symptoms were in-
indicating more insomnia symptoms.                              cluded as covariates in this study based on the
                                                                Senescent Sleep Model [10], a model that has been
Activity engagement                                             used in many studies to identify the key factors that
In the HRS, respondents were asked how often they               influence sleep among older adults. Precipitating fac-
engaged in different types of activities using 21 items in      tors included were 1) chronic diseases including heart
the HRS psychosocial and lifestyle questionnaires. Each         disease, stroke, Alzheimer’s disease, dementia, hyper-
item was scored on a Likert scale of 1 (never) to 7             tension, pain, arthritis, cancer, diabetes, and incontin-
(daily). The data showed skewness (range, − 2.69–4.97)          ence [24]; 2) difficulty with activities of daily living
and non-normality (p < 0.001) when the Shapiro–Wilk             (ADL); 3) cognitive function; and 4) primary sleep
test was conducted, which indicated that the midpoint           disorders (e.g., sleep apnea, restless legs, and other
response categories (e.g., 3, 4, and 5) may not provide         diseases). Respondents were classified as having ADL
sufficient information. The response categories were col-       difficulty if they reported difficulties in performing
lapsed to 1 (never), 2 (not in the last month–several           one or more of the following basic tasks: dressing,
times a week), and 3 (daily) because never or daily             walking across a room, bathing, eating, getting in or
engaging in activities indicates either a clear absence of      out of bed, and toileting as defined by Katz and
engagement or frequent engagement [25]. The explora-            Akpom [28]. Cognitive function was measured by a
tory factor analysis (EFA) was then performed with the          modified version of the Telephone Instrument for
oblimin rotation to examine the factor structure of the         Cognitive Status (TICS). This instrument consists of
21 items. The weighted least square mean and variance           (a) an immediate word recall test (10 points), (b) a
(WLSMV) adjusted estimation was used considering that           delayed recall test (10 points), (c) a serial 7 s subtrac-
the variables are categorized. In the EFA, the number of        tion test (5 points), (d) a backward counting test (2
factors with eigenvalues greater than 1.00 was six (6.29,       points), (e) naming tasks (e.g., date and naming the
1.71, 1.44, 1.33, 1.22, and 1.03, respectively). In the cases   president and vice president; 6 points), and (f)
of four, five, and six-factor models, at least one factor       vocabulary questions (2 points). The total cognitive
did not have more than three items. Therefore, a three-         function score was calculated by summing all points,
Kim et al. BMC Geriatrics (2021) 21:87 Page 4 of 10
which ranges from 0 to 35. A lower total score indi- Results
cates lower cognitive function. A total score of 8 or General characteristics of the sample
less was suggested as the cutoff score for cognitive Table 1 describes the general characteristics of the sam-
impairment [29]. ple. The mean age of the 3321 older adults was 75.62
Loneliness and caregiving were the perpetuating years (range, 65–98), and almost 60% were female. Most
factors included. Loneliness was measured using 11 respondents were Caucasian (80.7%) and almost 55%
items drawn from the revised UCLA Loneliness Scale were married. Also, approximately 48.9% graduated from
[30]. Each item was rated on a Likert scale of 1 (hardly college or had higher educational attainment. The aver-
ever or never) to 3 (often). Each score, ranging from 1 to age number of chronic diseases was 3.11 (range, 0–9).
3, was averaged with a higher score indicating greater Almost 81% of the respondents reported no difficulty
loneliness. Caregiving was measured using one dichot- with any ADL tasks. The average score of the modified
omous question (0, never; 1, at least sometimes), “How version of the TICS for the cognitive function was 21.54
often do you care for a sick or disabled adult?” Demo- (range, 1–34). Moreover, approximately 13.1% had sleep
graphic variables such as age, sex, race, marital status, disorders (e.g., sleep apnea, restless legs, or other). The
and education level were included. average score for loneliness was 1.52 (range, 1–3). Al-
most one-third of the respondents (30.9%) were care-
givers for adults.
Statistical analysis
Independent t-tests were used to analyze the differences Activity engagement and insomnia symptoms of the
in insomnia symptoms according to the general charac- sample
teristics and each type of activity engagement. In case of The overall activity engagement and insomnia symptoms
activity engagement, the respondents were classified into of the sample were examined (Table 1). The mean activ-
two groups according to the median value of each type ity engagement scores for the social, cognitive, and phys-
of activity engagement. For example, respondents with ical activity items were 1.39 (range, 1–3), 1.63 (range, 1–
higher and lower social activity engagements than the 3), and 1.95 (range, 1–3), respectively. The mean score
median value of social activity engagement scores (≥ for insomnia symptoms was 6.72 (range, 4–12). Histo-
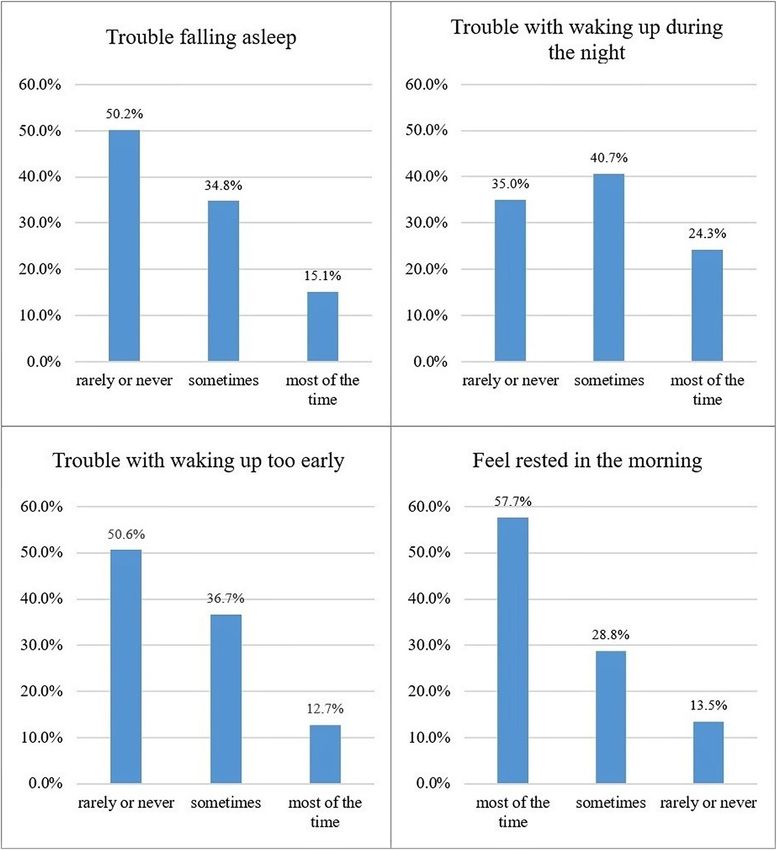
1.33 and < 1.33 points, respectively) were classified into grams of each insomnia symptom were presented in
the high and low social activity engagement groups, re- Fig. 1.
spectively. In addition, the median values of the cogni-
tive and physical activity engagement scores were 1.60 Comparison of insomnia symptoms according to general
and 2.00 points, respectively. characteristics
Multiple linear regressions were conducted to examine The insomnia symptoms were compared according to
the associations among the different types of activity the general characteristics of the respondents (Table 1).
engagement and insomnia symptoms, controlling for Respondents who are male, Caucasian, and married
covariates. The covariates were included step-by-step showed fewer insomnia symptoms. However, respon-
according to the type of covariates (e.g., demographics, dents who graduated from high school or lower and had
precipitating factors, and perpetuating factors) to exam- at least one chronic disease reported more insomnia
ine the changes in the relationship between activity en- symptoms. Furthermore, respondents with one or more
gagement and insomnia symptoms caused by adjusting ADL difficulty and sleep disorder and those in the high-
for covariates. The maximum likelihood estimation with level loneliness group showed more insomnia symptoms.
the robust standard error (MLR) was used to adjust the
non-normal distribution of the dependent variable and Comparison of insomnia symptoms by each type of
deal with missing values. Ordinal logistic regressions activity engagement
were also conducted to examine the association of the The comparison of the insomnia symptoms by levels of
different types of activity engagement with each insom- each type of activity engagement is presented in Table 2.
nia symptom, considering that each insomnia symptom The independent t-test showed that the respondents
is an ordered categorical-dependent variable (i.e., most with higher social activity engagement (t = 7.43,
of the time, sometimes, and rarely or never). p < 0.001), higher cognitive activity engagement (t =
Descriptive statistics and independent t-test were per- 5.57, p < 0.001), and higher physical activity engagement
formed using IBM SPSS Statistics, ver. 26.0 (IBM Corp., (t = 7.20, p < 0.001) had fewer insomnia symptoms.
Armonk, NY, USA). Factor analyses, calculation of
omega coefficient, multiple linear regressions, and Regression analysis
ordinal logistic regressions were performed using Mplus Regression models are presented in Table 3. The regres-
ver. 8.3 (Muthén & Muthén, Los Angeles, CA, USA). sion model, after adjusting for other types of activity andKim et al. BMC Geriatrics (2021) 21:87 Page 5 of 10
Table 1 Descriptive characteristics of the sample (N = 3321)
Variables Categories n (%) Mean (SD) Range Insomnia symptom score
Mean t (p)
(SD)
Age (years) 75.62 (7.15) 65–98
65 to 74 1504 (45.3) 6.71 (2.10) −0.23 (0.819)
75 or older 1817 (54.7) 6.73 (2.02)
Sex Male 1317 (39.7) 6.46 (2.04) 6.01 (< 0.001)
Female 2004 (60.3) 6.89 (2.05)
Race Caucasian 2679 (80.7) 6.67 (2.04) 2.72 (0.007)
Other 639 (19.3) 6.92 (2.11)
Marital status Married 1829 (55.1) 6.55 (2.02) 5.34 (< 0.001)
Other (e.g., separated, divorced, widowed, or never married) 1489 (44.9) 6.93 (2.08)
Level of education High school or lower 1695 (51.1) 6.92 (2.05) 5.71 (< 0.001)
College or higher 1619 (48.9) 6.51 (2.05)
Number of chronic diseases 3.11 (1.61) 0–9
None 141 (4.2) 5.93 (1.61) −5.89 (< 0.001)
1 or more 3179 (95.8) 6.76 (2.07)
ADL difficulty One or more difficulties 626 (18.9) 7.49 (2.16) −9.97 (< 0.001)
No difficulty 2689 (81.1) 6.55 (1.99)
Cognitive function 21.54 (4.90) 1–34
Cognitive impairment (modified TICS score ≤ 8) 35 (1.1) 6.54 (1.82) 0.52 (0.604)
No cognitive impairment (modified TICS score > 8) 3265 (98.9) 6.72 (2.06)
Sleep disorder Sleep disorder 431 (13.1) 6.94 (2.23) −2.22 (0.027)
No sleep disorder 2860 (86.9) 6.68 (2.03)
Loneliness 1.52 (0.42) 1–3
High level (> 1.45)a 1489 (45.8) 7.16 (2.11) −11.51 (< 0.001)
Low level (≤ 1.45)a 1761 (54.2) 6.34 (1.93)
Caregiving At least sometimes 1002 (30.9) 6.70 (2.00) 0.30 (0.767)
No 2241 (69.1) 6.73 (2.09)
Activity engagement Social activity 1.39 (0.34) 1–3
Cognitive activity 1.63 (0.38) 1–3
Physical activity 1.95 (0.45) 1–3
Insomnia symptom score 6.72 (2.06) 4–12
ADL activities of daily living, SD standard deviation, TICS telephone instrument for cognitive status
There are several variables with missing values including race, marital status, number of chronic diseases, ADL difficulty, cognitive function, sleep disorder,
loneliness, and caregiving.
a
Total respondents were classified into two groups (high level vs. low level) according to the median value of the revised UCLA loneliness score (1.45)
all covariates, showed that respondents with higher greater loneliness (β = 0.20, p < 0.001) was associated
social activity engagement were more likely to report with more insomnia symptoms.
fewer insomnia symptoms (β = − 0.04, p = 0.040). Like- Regression models according to the subtypes of insom-
wise, those with higher cognitive activity engagement nia symptoms were also presented (Table 4). Negative
were more likely to report fewer insomnia symptoms standardized coefficients indicate that higher values of
(β = − 0.06, p = 0.007), while engaging in physical activity the explanatory variable are associated with less severe
was not significantly associated with total insomnia insomnia symptoms. Respondents with higher social ac-
symptom score (β = − 0.04, p = 0.062). Older respondents tivity engagement showed lower odds of more trouble
(β = − 0.05, p = 0.012) and male (β = − 0.10, p < 0.001) falling asleep (OR = 0.71, 95% CI = 0.56–0.91). Those
were more likely to report fewer insomnia symptoms. with higher cognitive activity engagement had lower
Regarding precipitating factors, respondents with odds of more trouble falling asleep (OR = 0.77, 95% CI =
chronic disease (β = 0.05, p < 0.001) and ADL difficulty 0.62–0.96) and more trouble with waking up too early
(β = 0.11, p < 0.001) were more likely to report more in- (OR = 0.68, 95% CI = 0.55–0.85). Furthermore, those
somnia symptoms. In case of perpetuating factors, with higher physical activity engagement were less likelyKim et al. BMC Geriatrics (2021) 21:87 Page 6 of 10
Fig. 1 Histograms of each insomnia symptom
to report more nonrestorative sleep (OR = 0.69, 95% CI = reporting higher social, cognitive, and physical activity
0.57–0.82). engagements had fewer insomnia symptoms compared
to people with lower activity engagement. Further-
Discussion more, higher social, cognitive, and physical activity
The purpose of this study was to examine the rela- engagements were found to be associated with fewer
tionships among the different types of activity engage- insomnia symptoms, adjusting for other types of activity en-
ment and insomnia symptoms in older adults. The gagement, demographic factors, and precipitating factors.
results of this study suggested that older adults However, after including perpetuating factors (e.g.,Kim et al. BMC Geriatrics (2021) 21:87 Page 7 of 10
Table 2 Comparison of insomnia symptoms by each type of activity engagement (N = 3321)
Types of Group Insomnia symptoms
activity
Mean (SD) t p
Social activity High-level group (n = 1833) 6.48 (2.00) 7.43 < 0.001
Low-level group (n = 1479) 7.01 (2.09)
Cognitive activity High-level group (n = 2008) 6.56 (2.02) 5.57 < 0.001
Low-level group (n = 1306) 6.96 (2.10)
Physical activity High-level group (n = 2198) 6.54 (2.00) 7.20 < 0.001
Low-level group (n = 1107) 7.08 (2.12)
SD standard deviation
Total respondents were classified into two groups (high level vs. low level) according to the median value of each type of activity engagement
loneliness and caregiving) as covariates in the analysis, research demonstrated that older adults who reported
higher social and cognitive activity engagements were engaging in social activities such as religious services,
found to be associated with fewer insomnia symptoms, but clubs, classes, or other organized activities were signifi-
physical activity engagement was not associated with the cantly less likely to show insomnia symptoms [31].
total insomnia symptom score. Social activity engagement may contribute to improved
Consistent with previous literature, the findings of this sleep by providing older adults with social support and
study suggest that higher social activity engagement was encouragement to engage in positive health behaviors
associated with fewer insomnia symptoms. Previous such as doctor visits [18] because older adults with
Table 3 Results of multiple linear regression analysis (N = 3321)
Variables Model 1 Model 2a Model 3b Model 4c
β (SE) p β (SE) p β (SE) p β (SE) p
Types of activity Social activity −0.07 (0.02) < 0.001 −0.05 (0.02) 0.008 −0.04 0.026 − 0.04 0.040
(0.02) (0.02)
Cognitive activity −0.04 (0.02) 0.034 −0.07 (0.02) 0.001 −0.06 0.003 −0.06 0.007
(0.02) (0.02)
Physical activity −0.10 (0.02) < 0.001 −0.09 (0.02) < −0.05 0.011 −0.04 0.062
0.001 (0.02) (0.02)
Demographics Age (years) −0.04 (0.02) 0.020 −0.07 < −0.05 0.012
(0.02) 0.001 (0.02)
Male (ref: female) −0.10 (0.02) < −0.09 < −0.10 <
0.001 (0.02) 0.001 (0.02) 0.001
Caucasian (ref: other) −0.02 (0.02) 0.307 −0.01 0.765 −0.02 0.305
(0.02) (0.02)
Married (ref: other) −0.04 (0.02) 0.022 −0.03 0.073 −0.01 0.506
(0.02) (0.02)
College or higher (ref: high school or −0.04 (0.02) 0.018 −0.04 0.048 −0.03 0.073
lower) (0.02) (0.02)
Precipitating Chronic disease (ref: no) 0.06 (0.01) < 0.05 (0.01) <
factors 0.001 0.001
ADL difficulty (ref: no) 0.13 (0.02) < 0.11 (0.02) <
0.001 0.001
Cognitive function −0.04 0.080 −0.01 0.717
(0.02) (0.02)
Sleep disorder (ref: no) 0.03 (0.02) 0.122 0.02 (0.02) 0.208
Perpetuating Loneliness 0.20 (0.02) <
factors 0.001
Caregiving (ref: no) 0.03 (0.02) 0.063
ADL activities of daily living, β standardized coefficient, ref reference, SE standard error
Bold indicates statistical significance
a
Adjusted for demographics
b
Adjusted for demographics and precipitating factors
c
Adjusted for demographics, precipitating factors, and perpetuating factorsKim et al. BMC Geriatrics (2021) 21:87 Page 8 of 10
Table 4 Results of ordinal logistic regression analyses by types of insomnia symptoms (N = 3321)
Variables Trouble falling asleep Trouble with waking Trouble with waking Nonrestorative sleep
up during the night up too early
β (SE) OR 95% β (SE) OR 95% β (SE) OR 95% β (SE) OR 95%
CI CI CI CI
Types of activity Social activity −0.06* 0.71 0.56– − 0.03 0.83 0.66– −0.02 0.88 0.69– 0.01 1.07 0.83–
(0.02) 0.91 (0.02) 1.05 (0.02) 1.12 (0.02) 1.39
Cognitive activity −0.05* 0.77 0.62– −0.02 0.92 0.74– −0.08** 0.68 0.55– −0.04 0.84 0.67–
(0.02) 0.96 (0.02) 1.14 (0.02) 0.85 (0.02) 1.05
Physical activity −0.03 0.87 0.73– −0.00 0.99 0.84– 0.02 1.07 0.90– −0.09** 0.69 0.57–
(0.02) 1.03 (0.02) 1.17 (0.02) 1.28 (0.02) 0.82
Demographics Age (years) −0.04 0.99 0.98– −0.02 1.00 0.99– −0.02 0.99 0.98– −0.05* 0.99 0.98–
(0.02) 1.00 (0.02) 1.01 (0.02) 1.01 (0.02) 1.00
Male (ref: female) −0.20** 0.47 0.40– −0.04* 0.86 0.74– −0.07** 0.78 0.66– −0.01 0.96 0.82–
(0.02) 0.55 (0.02) 0.99 (0.02) 0.91 (0.02) 1.13
Caucasian (ref: other) −0.04* 0.81 0.68– 0.01 1.04 0.87– −0.02 0.89 0.74– 0.00 1.01 0.84–
(0.02) 0.98 (0.02) 1.24 (0.02) 1.07 (0.02) 1.22
Married (ref: other) −0.01 0.98 0.84– −0.01 0.95 0.83– −0.01 0.97 0.83– −0.01 0.97 0.83–
(0.02) 1.14 (0.02) 1.10 (0.02) 1.12 (0.02) 1.13
College or higher (ref: high −0.04 0.87 0.75– −0.01 0.98 0.85– −0.05* 0.84 0.72– −0.03 0.91 0.78–
school or lower) (0.02) 1.02 (0.02) 1.14 (0.02) 0.97 (0.02) 1.06
Precipitating Chronic disease (ref: no) 0.06* 1.73 1.19– 0.04* 1.41 1.02– 0.06* 1.66 1.14– 0.03 1.27 0.87–
factors (0.02) 2.50 (0.02) 1.95 (0.02) 2.41 (0.02) 1.87
ADL difficulty (ref: no) 0.05* 1.31 1.08– 0.07** 1.42 1.18– 0.09** 1.55 1.28– 0.09** 1.60 1.32–
(0.02) 1.57 (0.02) 1.70 (0.02) 1.87 (0.02) 1.92
Cognitive function −0.02 0.99 0.98– 0.04* 1.02 1.00– −0.01 1.00 0.98– −0.03 0.99 0.97–
(0.02) 1.01 (0.02) 1.03 (0.02) 1.01 (0.02) 1.01
Sleep disorder (ref: no) 0.04 1.23 1.00– 0.02 1.13 0.92– −0.02 0.89 0.72– 0.03 1.20 0.97–
(0.02) 1.51 (0.02) 1.38 (0.02) 1.10 (0.02) 1.48
Perpetuating Loneliness 0.14** 1.85 1.56– 0.11** 1.59 1.35– 0.12** 1.69 1.42– 0.23** 2.79 2.35–
factors (0.02) 2.19 (0.02) 1.87 (0.02) 2.00 (0.02) 3.32
Caregiving (ref: no) 0.05* 1.24 1.06– 0.01 1.05 0.90– 0.01 1.06 0.90– 0.03 1.13 0.96–
(0.02) 1.45 (0.02) 1.22 (0.02) 1.24 (0.02) 1.33
*
p < 0.05, **p < 0.001
ADL activities of daily living, β standardized coefficient, CI confidence interval, OR odds ratio, ref reference, SE standard error
The higher value of dependent variables indicates more severe insomnia symptom
medical problems are more likely to have sleep distur- affect sleep complaints in older adults [37]. Especially,
bances [32]. Moreover, previous studies have demon- cognitive stimulation through cognitively challenging ac-
strated that social activity engagement is associated with tivities may enhance connections between neurons in
lower feelings of loneliness [11, 33], which can predict the brain, which can result in improving or maintaining
sleep complaints among older adults [10]. Therefore, cognitive ability [38]. Subsequent studies need to be con-
social activity engagement should be promoted for better ducted to identify the mediating role of cognitive func-
sleep. tion in the relationship between cognitive activity and
Likewise, cognitive activity engagement should be insomnia symptoms. Such studies can contribute to
given more attention to reduce insomnia symptoms. In identifying the mechanisms that influence insomnia
this study, higher cognitive activity engagement among symptoms.
older adults showed a significant association with fewer In this study, older adults with higher physical activity
insomnia symptoms. This is consistent with a previous engagement reported fewer insomnia symptoms. How-
research that showed mental activity, such as playing ever, no significant association was found between phys-
chess or card games that exercises memory, is associated ical activity engagement and total insomnia symptom
with fewer sleep disturbances [19]. Exposure to cognitive score after controlling for other types of activity and all
stimuli could trigger homeostatic increases in the need covariates. These findings imply that physical activity en-
for sleep [19, 34]. Moreover, cognitive activity engage- gagement is significantly associated with fewer insomnia
ment is associated with a reduced risk of incidences of symptoms, but the extent to which physical activity en-
dementia and cognitive impairment [35, 36], which can gagement predicts insomnia symptoms is less than thatKim et al. BMC Geriatrics (2021) 21:87 Page 9 of 10
of the other factors studied here. In particular, given that and insomnia symptoms cannot be examined because
physical activity did not show a significant association this is a cross-sectional study. Therefore, future research
with insomnia symptoms because the perpetuating fac- should consider a prospective longitudinal design with
tors (e.g., loneliness and caregiving) were controlled, comprehensive measures. Further, the difference in the
physical activity may affect sleep by interacting with insomnia symptoms between high- and low-level activity
these factors rather than affecting it independently. engagement groups showed less than 1 in all three types
Meanwhile, the data of this study indicate that lower of activities. However, it is difficult to examine the clin-
physical activity engagement is associated with nonres- ical significance of activity engagement because the
torative sleep among subtypes of insomnia symptoms. questionnaire for assessing insomnia symptoms used in
This is consistent with a previous research that showed this study was not a clinical screening tool for insomnia.
positive associations between regular exercise and lower
prevalence of nonrestorative sleep [39]. Considering that Conclusions
the positive effects of physical activity on sleep have The findings of this study show that older adults with
been presented in multiple previous studies [20, 21], a higher social, cognitive, and physical activity engage-
further thorough investigation is needed to clarify the re- ments reported fewer insomnia symptoms. However,
lationship between physical activity and insomnia only social and cognitive activity engagements were as-
symptoms. sociated with fewer insomnia symptoms after controlling
The association between the type of activity engage- for other types of activity engagement and all covariates.
ment and insomnia symptoms was observed to be atten- These results may provide practical information for de-
uated in this study as the covariates were controlled in veloping multicomponent activity engagement strategies
the regression analyses. Considering that insomnia is a for improving insomnia among older adults. Particularly,
multifactorial geriatric syndrome affected by various fac- these findings are noteworthy because the effect of mul-
tors [10], the association between insomnia symptoms tiple types of activity engagement on insomnia symp-
and covariates may attenuate the effects. Sex, race, mari- toms, which had yet to be studied in depth until now,
tal status, education level, chronic disease, ADL diffi- was studied using a nationally representative sample of
culty, sleep disorder, and loneliness were found to be older adults.
significantly associated with insomnia symptoms in this
study. Further longitudinal studies should be conducted Supplementary Information
to examine the direction of the association among these The online version contains supplementary material available at https://doi.
org/10.1186/s12877-021-02042-y.
related variables, activity engagement, and insomnia
symptoms.
Additional file 1.
The results of the present study have important prac-
tical implications for developing activity programs to re-
Abbreviations
duce insomnia symptoms among community-dwelling ADL: Activities of daily living; CFA: Confirmative factor analysis;
older adults. Multicomponent activity programs includ- EFA: Exploratory factor analysis; HRS: Health and Retirement Study;
ing those activities need to be developed for older adults MLR: Maximum likelihood estimation with robust standard error;
ref: Reference; RMSEA: Root mean squared error of approximation;
because social and cognitive activities are associated with SRMR: Standardized root mean square residual; TICS: Telephone Instrument
fewer insomnia symptoms. In addition, it is important to for Cognitive Status; WLSMV: Weighted least square mean and variance
support older adults to engage in activities to the extent
Acknowledgements
that they are able considering that each older adult has a Dr. Roger Brown is thanked and acknowledged for excellent professional
different level of functional impairment and specific psy- comments on data analysis.
chosocial challenges. Likewise, older adults with greater
Authors’ contributions
engagement in personally meaningful activities showed DEK and TJR contributed to the conception and design of the study. DEK
better psychosocial well-being and health-related quality performed the statistical analysis and drafted the manuscript. TJR and CM
of life [40]. Therefore, an individualized activity program interpreted the data and critically reviewed the manuscript. TJR supervised
the whole study process. All authors read and approved the final manuscript.
focused on individual needs and preferences should be
developed. Funding
This study has some limitations. First, variables that There are no sources of funding to be declared.
had been previously investigated were used because this
Availability of data and materials
is a secondary analysis study. For example, other sleep The datasets from the Health and Retirement Study are publicly available
dimensions (e.g., sleep duration and sleep efficiency), online: https://hrs.isr.umich.edu/data-products
quality of activity engagement, and specific information
Ethics approval and consent to participate
about the activity items were not investigated. Second, The original HRS study received institutional review board (IRB) approval, and
causal relationships among types of activity engagement informed consent was obtained from study participants or their surrogates.Kim et al. BMC Geriatrics (2021) 21:87 Page 10 of 10
The data is de-identified and the researchers do not have access to links that between men and women. Sleep Disord. 2014. https://doi.org/10.1155/
would connect the data to the individuals from whom they were derived. 2014/595208.
This study was deemed exempt by the IRB at the University of Wisconsin- 20. Du S, Dong J, Zhang H, Jin S, Xu G, Liu Z, et al. Taichi exercise for self-rated
Madison (IRB 2019–1307). sleep quality in older people: a systematic review and meta-analysis. Int J
Nurs Stud. 2015;52(1):368–79.
21. Dzierzewski JM, Buman MP, Giacobbi PR Jr, Roberts BL, Aiken-Morgan AT,
Consent for publication
Marsiske M, et al. Exercise and sleep in community-dwelling older adults:
Not applicable.
evidence for a reciprocal relationship. J Sleep Res. 2014;23(1):61–8.
22. Sonnega A, Faul JD, Ofstedal MB, Langa KM, Phillips JW, Weir DR. Cohort
Competing interests profile: the health and retirement study (HRS). Int J Epidemiol. 2014;43(2):
The authors declare no competing interests. 576–85.
23. Smith J, Ryan LH, Fisher GG, Sonnega A, Weir DR. HRS Psychosocial and
Author details lifestyle questionnaire 2006-2016. Survey research center, Institute for Social
1 Research, University of Michigan. 2016. https://hrs.isr.umich.edu/
College of Nursing and Research Institute of Nursing Science, Kyungpook
National University, Daegu, Republic of Korea. 2School of Nursing, University publications/biblio/9066. Accessed 15 Sept 2019.
of Wisconsin-Madison, Madison, WI, USA. 3College of Nursing, University of 24. Kaufmann CN, Mojtabai R, Hock RS, Thorpe RJ Jr, Canham SL, Chen L-Y,
Iowa, Iowa City, IA, USA. et al. Racial/ethnic differences in insomnia trajectories among US older
adults. Am J Geriatr Psychiatry. 2016;24(7):575–84.
Received: 5 June 2020 Accepted: 20 January 2021 25. Amano T, Park S, Morrow-Howell N. The association between cognitive
impairment and patterns of activity engagement among older adults. Res
Aging. 2018;40(7):645–67.
26. Hu L, Bentler PM. Cutoff criteria for fit indexes in covariance structure
References analysis: conventional criteria versus new alternatives. Struct Equ Model.
1. Bloom HG, Ahmed I, Alessi CA, Ancoli-Israel S, Buysse DJ, Kryger MH, et al. 1999;6(1):1–55.
Evidence-based recommendations for the assessment and management of 27. Dunn TJ, Baguley T, Brunsden V. From alpha to omega: a practical solution
sleep disorders in older persons. J Am Geriatr Soc. 2009;57(5):761–89. to the pervasive problem of internal consistency estimation. Br J Psychol.
2. Crowley K. Sleep and sleep disorders in older adults. Neuropsychol Rev. 2014;105(3):399–412.
2011;21(1):41–53. 28. Katz S, Akpom CA. A measure of primary sociobiological functions. Int J
3. Reid KJ, Martinovich Z, Finkel S, Statsinger J, Golden R, Harter K, et al. Sleep: Health Serv. 1976;6(3):493–508.
a marker of physical and mental health in the elderly. Am J Geriatr 29. Herzog AR, Wallace RB. Measures of cognitive functioning in the AHEAD
Psychiatry. 2006;14(10):860–6. Study. J Gerontol Ser B: Psychol Sci Soc Sci. 1997;52B(Special):37–48.
4. Vaz Fragoso CA, Gahbauer EA, Van Ness PH, Gill TM. Sleep–wake 30. Russell D, Peplau LA, Cutrona CE. The revised UCLA loneliness scale:
disturbances and frailty in community-living older persons. J Am Geriatr concurrent and discriminant validity evidence. J Pers Soc Psychol. 1980;
Soc. 2009;57(11):2094–100. 39(3):472.
5. Taylor DJ, Mallory LJ, Lichstein KL, Durrence HH, Riedel BW, Bush AJ. 31. Endeshaw YW, Yoo W. Association between social and physical activities
Comorbidity of chronic insomnia with medical problems. Sleep. 2007;30(2): and insomnia symptoms among community-dwelling older adults. J Aging
213–8. Health. 2016;28(6):1073–89.
6. Ohayon MM, Zulley J, Guilleminault C, Smirne S, Priest RG. How age and 32. Foley D, Ancoli-Israel S, Britz P, Walsh J. Sleep disturbances and chronic
daytime activities are related to insomnia in the general population: disease in older adults: results of the 2003 National Sleep Foundation sleep
consequences for older people. J Am Geriatr Soc. 2001;49(4):360–6. in America survey. J Psychosom Res. 2004;56(5):497–502.
7. Borbély AA, Daan S, Wirz-Justice A, Deboer T. The two-process model of 33. Queen TL, Stawski RS, Ryan LH, Smith J. Loneliness in a day: activity
sleep regulation: a reappraisal. J Sleep Res. 2016;25(2):131–43. engagement, time alone, and experienced emotions. Psychol Aging. 2014;
8. Naylor E, Penev PD, Orbeta L, Janssen I, Ortiz R, Colecchia EF, et al. Daily 29(2):297–305.
social and physical activity increases slow-wave sleep and daytime 34. Cirelli C. Brain plasticity, sleep and aging. Gerontol. 2012;58(5):441–5.
neuropsychological performance in the elderly. Sleep. 2000;23(1):1–9. 35. Wilson R, Scherr P, Schneider J, Tang Y, Bennett D. Relation of cognitive
9. Dworak M, Diel P, Voss S, Hollmann W, Strüder HK. Intense exercise activity to risk of developing Alzheimer disease. Neurol. 2007;69(20):1911–20.
increases adenosine concentrations in rat brain: implications for a 36. Lee Y, Chi I, Palinkas LA. Retirement, leisure activity engagement, and
homeostatic sleep drive. Neuroscience. 2007;150(4):789–95. cognition among older adults in the United States. J Aging Health. 2019;
10. Vaz Fragoso CA, Gill TM. Sleep complaints in community-living older 31(7):1212–34.
persons: a multifactorial geriatric syndrome. J Am Geriatr Soc. 2007;55(11): 37. da Silva RAPC. Sleep disturbances and mild cognitive impairment: a review.
1853–66. Sleep Sci. 2015;8(1):36–41.
11. McHugh Power JE, Steptoe A, Kee F, Lawlor BA. Loneliness and social 38. Vance DE, Webb NM, Marceaux JC, Viamonte SM, Foote AW, Ball KK. Mental
engagement in older adults: a bivariate dual change score analysis. Psychol stimulation, neural plasticity, and aging: directions for nursing research and
Aging. 2019;34(1):152. practice. J Neurosci Nurs. 2008;40(4):241–9.
12. Thoits PA. Mechanisms linking social ties and support to physical and 39. Wakasugi M, Kazama JJ, Narita I, Iseki K, Moriyama T, Yamagata K, et al.
mental health. J Health Soc Behav. 2011;52(2):145–61. Association between combined lifestyle factors and non-restorative sleep in
13. Kurina LM, Knutson KL, Hawkley LC, Cacioppo JT, Lauderdale DS, Ober C. Japan: a cross-sectional study based on a Japanese health database. PLoS
Loneliness is associated with sleep fragmentation in a communal society. One. 2014;9(9):e108718.
Sleep. 2011;34(11):1519–26. 40. Eakman AM, Carlson ME, Clark FA. The meaningful activity participation
14. Haimov I, Hanuka E, Horowitz Y. Chronic insomnia and cognitive assessment: a measure of engagement in personally valued activities. Int J
functioning among older adults. Behav Sleep Med. 2008;6(1):32–54. Aging Hum Dev. 2010;70(4):299–317.
15. Passos GS. Is exercise an alternative treatment for chronic insomnia? Clin
[online]. 2012;67(6):653–60.
16. Youngstedt SD. Effects of exercise on sleep. Clin Sports Med. 2005;24(2): Publisher’s Note
355–65. Springer Nature remains neutral with regard to jurisdictional claims in
17. Montgomery P, Dennis JA. Physical exercise for sleep problems in adults published maps and institutional affiliations.
aged 60+. Cochrane Database Syst Rev. 2002;4. https://link.springer.com/
article/10.1186/s12889-020-09855-3.
18. Chen J-H, Lauderdale DS, Waite LJ. Social participation and older adults'
sleep. Soc Sci Med. 2016;149:164–73.
19. Hellström A, Hellström P, Willman A, Fagerström C. Association between
sleep disturbances and leisure activities in the elderly: a comparisonYou can also read