Changes and influences on adolescent drinking in New Zealand - April 2020
←
→
Page content transcription
If your browser does not render page correctly, please read the page content below

Changes and influences
on adolescent drinking
in New Zealand

April 2020
Prepared for Te Hiringa Hauora/Health Promotion Agency by:

Taisia Huckle, Jose S. Romeo and Sally Casswell,
SHORE & Whariki Research Centre, Massey University

ISBN: 978-0-478-44984-6

Citation: Huckle, T., Romeo, J. S., & Casswell, S. (2020). Changes and influences on adolescent
drinking in New Zealand. Wellington: Health Promotion Agency.

Acknowledgements
Te Hiringa Hauora would like to thank those respondents who took the time to participate in this
research.

Copyright
The copyright owner of this publication is Te Hiringa Hauora. Te Hiringa Hauora permits the
reproduction of material from this publication without prior notification, provided that fair
representation is made of the material and Te Hiringa Hauora is acknowledged as the source.

Disclaimer
This research has been carried out by an independent party under contract to Te Hiringa Hauora.
The views, observations and analysis expressed in this report are those of the authors and are not
to be attributed to Te Hiringa Hauora.

This document has not been externally peer reviewed.

The document is available at: www.hpa.org.nz/our-work/research/publications

Any queries regarding this report should be directed to Te Hiringa Hauora at the following address:
Te Hiringa Hauora/Health Promotion Agency
PO Box 2142
Wellington 6140
New Zealand
www.hpa.org.nz
enquiries@hpa.org.nz

NZBN 9429041905333

April 2020

Changes and influences on adolescent drinking
                in New Zealand

          SHORE & Whariki Research Centre
                  College of Health
                 Massey University
               Auckland, New Zealand
                  www.shore.ac.nz

                                                1
Contents

Acknowledgements ............................................................................................................... 3
Executive summary ............................................................................................................... 4
Introduction ........................................................................................................................... 6
Methodology ....................................................................................................................... 10
   Measures ........................................................................................................................ 12
   Analysis ........................................................................................................................... 14
Results ................................................................................................................................ 16
   Average drinking patterns (Aim 1 & 2) ............................................................................. 16
   Trajectories (Aim 3) ......................................................................................................... 19
Discussion .......................................................................................................................... 23
Conclusion and implications ................................................................................................ 26
References ......................................................................................................................... 27
Appendices ......................................................................................................................... 30

                                                                                                                                         2
Acknowledgements
This report was prepared by Taisia Huckle, Jose S. Romeo and Sally Casswell, SHORE &
Whariki Research Centre, Massey University. We gratefully acknowledge Te Hiringa
Hauora/Health Promotion Agency for both funding and providing feedback on this report and
all the New Zealanders who gave their time to take part in the surveys. We also
acknowledge Health Research Council of New Zealand funding.
3Executive summary
Key messages
• Longitudinal survey data were used to track drinking patterns among
adolescents (16 to 17-year-olds) and the wider population (16 to 65-year-olds)
from 2011 to 2015.
• By the time they were 20 to 21-years-old, adolescents had decreased the
quantity of alcohol they drank on a typical occasion compared to when they
were 16 to 17-years-old (but still drank at a high risk level).
• The decrease was largely driven by a decline in drinking among heavier
drinkers, rather than a population level shift.
• While certain measures (eg, tobacco smoking and cannabis use) were
associated with heavier drinking, change over time in these measures did not
explain the decrease in adolescent drinking.
The study
Adolescent drinking has declined in many high-income countries since the 2000s, mainly
among adolescents under 18-years-old. There is currently no consensus as to why declines
have occurred. Little is known about whether adolescent levels of consumption have
declined due to wider collective changes in drinking (Pape, Rossow, & Brunborg, 2018).
Further, there is a range of factors that may specifically influence adolescents’ consumption.
This study used three waves of longitudinal data covering the period 2011 through 2015 to
understand what factors may have been influencing change in adolescent drinking in New
Zealand.
It assessed if adolescents’ drinking behaviour has changed similarly/differently from adults.
Both average drinking patterns and drinking trajectory analysis were used to do so. The
study also explored specific factors that may be related to declines in drinking trajectories.
Results
When average drinking patterns were assessed, the quantity of alcohol consumed on a
typical drinking occasion decreased over the three survey waves, with younger age groups
decreasing more than the older age groups.
Those who were heavy drinkers at survey wave 1 decreased the most over the three survey
data points.
4Among the 16 to 17-year-olds (at wave 1), this meant that the decline in heavier drinking
translated through to emergent adulthood (at wave 3: 20 to 21-years-old).
This finding denotes a departure from previous New Zealand longitudinal trajectories where
the quantities of alcohol consumed have increased in transition from adolescence through to
emergent adulthood.
Although declines were found in the heavier drinking trajectories, most drinkers still
consumed alcohol at levels of around six drinks or above by wave 3, placing them at high
risk of experiencing the harmful effects of alcohol.
It appears that adolescent changes in consumption are not simply reflecting those found
among the wider population. Changes over time differed among 16 to 17-year-olds relative
to those aged 16 to 65-years-old. Further, the changes over time among 16 to 17-year-olds
did not appear to be explained by a collective shift in consumption (defined here as different
consumption levels moving in the same direction).
The analysis looked at a range of measures to understand drinking trajectory membership,
including policy, social and behavioural factors. The analysis also considered whether
change in these variables predicted membership to the trajectory with the greatest decrease.
• For 16 to 17-year-olds, being socially supplied by a friend and using cannabis or
smoking tobacco were among the measures that predicted membership to the
heavier drinking trajectory.
• In addition to using cannabis or smoking tobacco, for the 16 to 65-year-olds, late-
night purchasing, ethnicity and liking alcohol adverts were also important in predicting
membership to the heavier drinking trajectory.
• No clear patterns were found when changes in these measures were modelled to try
and explain membership to the trajectory with the greatest decrease.
Implications
This study raises broad and important questions of what measures research needs to look at
in order to understand declines in adolescent drinking. The findings from this study may
provide some support for a culture of early alcohol maturity. Heavy drinking declined as 16 to
17-year-olds reached 20 to 21-years-old which is earlier than generally found previously.
Going beyond alcohol‐specific factors may also be useful, for example, considering the
effects of broader societal changes such as investigating lifestyle changes, a more in-depth
assessment of the effects of social media, or a better understanding of generational
differences and influences.
5Introduction
Adolescent drinking has declined in many high-income countries since the 2000s, mainly
among adolescents under 18-years-old (Pape et al., 2018). Heavier drinking is now less
likely and average levels of consumption have declined. Such trends have been found in
numerous European countries, in the US, Australia and New Zealand (Pape et al., 2018;
Raninen & Livingston, 2018). In New Zealand, comparable cross-sectional surveys have
documented a significant decline in heavier drinking. The New Zealand Health Survey found
the prevalence of hazardous drinking (AUDIT score 8+) among adolescents aged 15 to 17
declined from 19.5% in 2006/07 to 11.5% by 2015/16 (however there was variation in
between these years) (Alcohol Healthwatch, 2018). A national school-based survey found a
decline in binge drinking 1 in the last four weeks among 15 to 16-year-olds, from 34% in 2007
to 23% in 2012 (Clark et al., 2013).
There is currently no consensus as to why declines have occurred in high-income countries
including New Zealand. While some studies have assessed possible factors that might be
affecting declines among adolescents, no conclusions have been drawn. Little is known
about whether adolescent levels of consumption have declined due to wider collective
changes in drinking (Pape et al., 2018). Further, there are a range of factors that may
specifically influence teenagers’ consumption. Therefore, developing evidence and
extending our understanding as to the mechanisms driving this change would be useful to
inform governments’ and policy makers’ efforts to support and maintain it.
Collective declines in drinking?
The theory of drinking collectivity states that when total consumption (per capita) increases
or decreases, all groups of drinkers change their alcohol consumption in the same direction,
via social diffusion processes (Oldham et al., 2019; Pape et al., 2018). In New Zealand, per
capita consumption has generally been declining (Alcohol Available for Consumption, from
Stats NZ, 2019). It is possible that this wider context has influenced adolescent declines in
consumption in New Zealand.
Most studies that have assessed declining adolescent consumption have not included
respondents who were aged 18+ (Pape et al., 2018). As such, little is known about whether
or not adolescent declines are simply reflective of patterns in the wider population. One
study, from England, analysed if declines in the number of drinks in the past week among 11
to 15-year-olds were in line with changes in total consumption. It found that declines in
consumption in all percentiles among the 11 to 15-year-olds were in line with mean
decreases in population consumption, although the relationship was more pronounced in
moderate drinkers (Oldham et al., 2019). A study from Australia assessed age-specific
trends among both adults and adolescents. It found that declines in mean average
1 Defined as five or more drinks in one 4-hr session.
6consumption 2 were concentrated among adolescents and young adults and that this was
likely to be a driver of the decline in total consumption (Livingston, Callinan, Raninen,
Pennay, & Dietze, 2018).
Some studies have looked at whether there have been collective shifts in drinking among
adolescents across the consumption distribution ie, if different levels of consumption (heavy
versus light drinkers) have all been changing in the same direction. A study from England
among those aged 11 to 15 between 2001 and 2016 found that the number of drinks in the
past week declined across the consumption distribution, suggesting a collective shift, but
that the magnitude of decline decreased proportionally less among the lightest, moderate
and very heaviest youth drinkers (Oldham et al., 2019). Other studies, from Scandinavia
(Norway and Sweden) have also found evidence of a collective shift in drinking declines
among adolescents (Brunborg, Bye, & Rossow, 2014; Norström & Svensson, 2014;
Raninen, Livingston, & Leifman, 2014). On the other hand, different studies from Sweden
have not (Hallgren, Leifman, & Andréasson, 2012; Zeebari, Lundin, Dickman, & Hallgren,
2017). One study found that the heaviest 5-10% of drinkers aged 15 to 16 and 18 to 19 did
not reduce their average consumption or binge drinking relative to other consumption levels
(Hallgren et al., 2012). A literature review from 2018 reported that currently there are too few
studies to draw conclusions about collective shifts either way (Pape et al., 2018).
Specific factors contributing to declines
It is also possible that there are factors specifically operating on adolescents to reduce their
drinking levels. Changes in alcohol policy including decreased affordability (eg, Baška,
Madarasová-Gecková, Bašková, & Krajčovič, 2016; Bhattacharya, 2016), increased
purchase age (eg, Andersen, Rasmussen, Bendtsen, Due, & Holstein, 2014) or shorter
trading hours (White et al., 2018) have all been found to contribute to decreases in some
adolescent drinking patterns. However, policy changes have not necessarily occurred in all
jurisdictions where adolescent drinking has declined therefore do not wholly explain the
cross-national nature of the declines (Pape et al., 2018).
In Australia and England, there is some evidence that adolescents are becoming less
approving of binge drinking (Fuller & Hawkins, 2013; Livingston & Callinan, 2017). A
qualitative study published in 2019 found that a culture change may have occurred among
young people where drinking and intoxication have lost their symbolic power as a rite of
passage into adulthood. The study also suggested that there was less peer pressure to drink
and more room for competing activities (Törrönen, Roumeliotis, Samuelsson, Kraus, &
Room, 2019).
Changes to permissive parental and/or social environment/friends’ attitudes or behaviours
may also be related to declining adolescent drinking trends. In Finland, a decline in heavy
2 Defined as the average volume of pure alcohol consumed by drinkers in the week before responding
to the survey.
7episodic drinking 3 among 15 to 16-year-olds between 1999–2015, was best explained by
increased difficulty in obtaining alcohol, an increase in parents knowing where the young
person was on Friday nights and a decrease in risk associated with going out with friends to
drink (Raitasalo, Simonen, Tigerstedt, Mäkelä, & Tapanainen, 2018). A study from Australia
found that reductions in parent favourable attitudes and availability of substances (alcohol,
tobacco and cannabis) were related to declines in lifetime use but not past month alcohol
use from 1995 to 2015 (Toumbourou et al., 2018).
There are indications that the decline in drinking could be part of a wider trend in health
consciousness among adolescents. A New Zealand study found cannabis use (ever)
decreased between 2001 and 2012 (as did the proportions who never used other illegal
psychoactive drugs) (Ball et al., 2019). Tobacco smoking has also been declining among
adolescents in many high-income countries (World Health Organization, 2014) and health-
oriented adolescents have been found to drink much less (Pennay et al., 2018). A qualitative
study from Sweden found that adolescents may also be more concerned with putting public
health risk messages into practice (Törrönen et al., 2019).
Longitudinal data versus cross-sectional data
Most studies conducted, including those reviewed above, have assessed adolescent
declines in consumption using cross-sectional data. There is a lack of recent longitudinal
studies, that can be used to shed light on alcohol consumption through developmental
stages among adolescents and young people.
Studies analysing longitudinal drinking trajectories from New Zealand, although limited in
number, have been conducted. These studies were, however, undertaken using data prior to
the trend of declining adolescent consumption during the 2000s. A study using data from the
Christchurch Health and Developmental Study found that all adolescents, across different
trajectories, increased their consumption as they aged from 14 through to 16-years-old
(Boden, Newton-Howes, Foulds, Spittlehouse, & Cook, 2019). Another study, among older
adolescents and young adults, found that quantity consumed on a typical drinking occasion
increased up until 21-years-old, after which most trajectories declined (Casswell, Pledger, &
Pratap, 2002).
The study
Adolescent drinking behaviour is changing and there is a need for more research to
understand why drinking levels are declining among adolescents. Most studies conducted in
this area have used cross-sectional data and there is a lack of longitudinal studies.
3 Defined as the number of times 6+ drinks were consumed during the past 30 days.
8This study used three waves of longitudinal data, collected between 2011 to 2015, to
understand what factors may have influenced change in adolescent drinking in New
Zealand. It assessed whether adolescents’ drinking behaviour has changed differently from
adults and if change has occurred at different drinking levels. The study used both average
drinking patterns and drinking trajectory analysis. The study also explored specific factors
that may be related to declines in drinking.
Aims
1. To determine if, and what, changes in drinking behaviour have occurred from 2011 to
2015, by age group in New Zealand.
2. To determine if adolescents’ drinking behaviour has changed differently from adults.
3. To determine trajectories of drinking patterns among adolescents (16 to 17-year-
olds) and the general population (16 to 65-years-old) and to explore measures that
predict a) trajectory membership and b) how changes in underlying factors predict
membership to the trajectory with the greatest rate of decrease.
9Methodology
Sample
Recruitment
This research used data previously collected as part of the International Alcohol Control
(IAC) Study 4. A cohort design with random replenishment samples was used. Survey
samples of drinkers aged 16 to 65 were collected in 2011, 2013 and 2015. Independent
samples of adolescents aged 16 to 19 were also collected in 2012, 2013 and 2015 (and 16
to 17-year-olds were used from these samples, to reflect adolescent underage drinkers).
For the 16 to 65-year-old sample, a national stratified sample of residential landline numbers
comprised the sample frame, including published and unpublished landline numbers in 2011.
All respondents were followed-up in 2013 and 2015 and those lost to follow-up were
replenished randomly (in 2013 and 2015 the random replenishment samples also included
randomly generated cell phone numbers). The process was the same for the samples of 16
to 19-year-olds collected in 2012, 2013 and 2015.
Once a household was recognised as residential, numerous call backs were made at
different times of the day and days of the week in order to attempt to reach the household.
Once a household was contacted, eligible individuals were enumerated, and one respondent
was selected at random by the computer/tablet. A screening interview established eligibility
for participation in the study (drinking in the last six months and 16 to 65-years-old). To
acknowledge the time respondents gave to the study, respondents were given koha at each
wave.
Baseline response rates
Considerable effort was put into minimising refusals in the baseline data collection and
thereby maximising the response rate. Baseline response rates were 70% (2012) for the
adolescent sample and 60% for the 16 to 65-year-old sample (2011).
Longitudinal follow-up and attrition
Baseline respondents were followed-up in two subsequent waves in 2013 and 2015. This
meant for the adolescent survey, follow-up waves were one year and then two years apart.
For the 16 to 65-year-old sample, the follow-up waves were each two years apart.
Respondents were also contacted in-between waves to try to minimise attrition.
Attrition for the adolescent sample was 23% at 2013 and 46% by 2015. Attrition for the 16 to
65-year-old sample was 33% at 2013 and 45% by 2015. A greater number of heavier
4 https://www.iacstudy.org/
10drinkers (defined as 6+ drinks of 12.7 ml ethanol) were lost to follow-up, as compared to
lighter drinkers, however, the difference was not significant. Heavier drinkers were lost in
relatively similar proportions across age, gender and ethnicity groups.
Multiple imputation
Multiple imputation via chained equations was used to control for any bias due to attrition
(Deng, Hillygus, Reiter, Si, & Zheng, 2013). This was done separately for the 16 to 19-year-
old sample and the 16 to 65-year-old sample. Respondents who completed a survey at wave
1 were imputed for any future waves, if they had missing data, to allow for a complete
longitudinal sample 2011 through 2015 (or 2012 through 2015 in the case of the adolescent
sample). All data, including replenishment samples, were used to inform the imputation
(replenishment samples were not included directly in the analysis, only to inform the
imputation).
One hundred imputed datasets were used for each sample (aged 16 to 17 and 16 to 65). For
a full description of how the multiple imputation was undertaken see Appendix 1.
Sample sizes
The sample sizes at baseline were n = 412 for the 16 to 17-year-olds and n = 1,996 for the
16 to 65-year-olds.
How the survey data relate to the study aims
We analysed longitudinal survey data from two separate samples: a) 16 to 17-year-olds
(from an adolescent only sample) and b) 16 to 65-year-olds, to provide a comparison for the
16 to 17-year-olds.
For aim 1 & 2 (average drinking patterns)
• We used the 16 to 65-year-old sample to determine if, and what, changes in
drinking behaviour occurred from 2011 to 2015 by age group in New Zealand and
if average patterns of adolescents’ drinking behaviour changed differently from
adults.
For aim 3 (trajectories)
• We used the 16 to 17-year-olds from the adolescent-specific sample and the 16
to 65-year-old sample separately to determine trajectories of quantity of alcohol
consumed on a typical drinking occasion.
11Measures
Outcome measures
Frequency of drinking and the quantity of alcohol consumed on a typical drinking occasion
were collected using a within‐location beverage‐specific framework developed for National
New Zealand Alcohol Surveys (Casswell, Huckle, & Pledger, 2002). This measure has also
been used internationally as part of the IAC Study (Huckle et al., 2018).
The measure first asks about typical frequency of drinking in all locations in which drinking
occurs. The locations need to be linked to a physical setting and be mutually exclusive. The
measure next asks beverage‐specific questions for each location in which respondents
drink. Respondents report their consumption of different beverages in their own terms and
interviewers code these by using containers and glass sizes in which alcohol is commonly
served and sold. In this way, respondents do not have to ‘calculate’ and report their
consumption in terms of standard drinks which is likely to introduce error. Calculation of the
quantity of millilitres of ethanol can be made using the appropriate assumptions regarding
alcohol content for each beverage and container size (based on best available data) (Huckle
et al., 2018). These measures have been shown to account for around 90% of the alcohol
available in New Zealand (Casswell, Huckle et al., 2002; Huckle et al., 2018).
Quantity of alcohol consumed on a typical drinking occasion: the quantity of ethanol in
millilitres (mls) consumed on a typical drinking occasion in the past six months.
Frequency of drinking: the number of drinking occasions in the past six months.
Explanatory measures
Policy measures
Underage access to alcohol
Respondents under 18-years-old reported how often they were asked to show age
identification when purchasing alcohol. This variable was measured on a scale of 1: none of
the time, to 10: all of the time. For the analysis, if frequency of being asked for identification
was 6 or above then this was coded 1 (most/all of the time), otherwise coded as 0.
Physical availability
Respondents were asked to report how much time it took them to travel to the usual place
where they purchased or obtained alcohol. Time to access alcohol was coded as ‘1’ if five
minutes or less, or ‘0’ if more than five minutes.
Marketing exposure and liking
Respondents were asked to rate, on a scale from 1-10, how often they had noticed things
that promoted alcohol in the last six months and how they felt about alcohol adverts on the
12whole; if they liked or disliked them. For both of these measures, if respondents reported 6-
10 their response was coded as yes (1) (noticed or liked alcohol adverts) and if their
response was 1-5, this was coded as no (0).
Late purchasing
Respondents reported the times at which they had purchased alcohol from on and off-
licensed premises. If respondents purchased from on-premises after 3am their response
was coded as yes (late purchaser), otherwise coded as no. If respondents purchased after
11pm from off-premises their response was coded as yes (1) (late purchaser), otherwise
coded as no (0). In some instances, late purchasing from on and off-premises was combined
to maximise numbers for analysis (and where this occurred is denoted later in the report).
Affordability
Respondents were asked to rate, on a scale from 1-10, how affordable alcohol was to them
currently, with 1 being very unaffordable and 10 being very affordable. If respondents
reported 6-10 their response were coded as yes (1) (perceived alcohol to be affordable) and
if 1-5 was coded as no (0).
Social mechanisms
Permissive parental and/or social environment/friends
Measures of social supply of alcohol were used as an indicator to measure permissive
parental and or social environment/friends. Respondents under 18-years-old, the legal
purchase age, were asked if they were supplied alcohol socially by parent/caregiver
(yes/no), supplied alcohol socially by a friend (yes/no), and supplied alcohol socially by
another relative (yes/no). These measures were included in the analysis for 2012 only. As
the analysis was longitudinal, in the follow-up surveys, the 16 to 17-year-olds became legally
permitted to purchase, making social supply less relevant.
Indicators of health consciousness - other health behaviours
Tobacco use
Respondent reports of tobacco smoking were assessed by asking respondents if they “had
ever smoked cigarettes or tobacco at all, even just a few puffs?”, and if so, “how often do
you now smoke?” (response options: you don't smoke now, at least once a day, at least
once a week, at least once a month, less often than once a month). Respondent responses
were then re-coded as yes (1) (current smoker at any frequency) otherwise no (0).
Cannabis use
Respondents were asked “Have you ever tried marijuana?” and if yes, “How often in the last
six months have you used marijuana?” (response options ranged from never to daily).
Responses were re-coded as yes (1) (current user at any frequency) otherwise no (0).
13Satisfaction with health Respondents were asked to rate, on a scale from 0-10 (an 11 point scale), how satisfied they were with their health, with 0 being completely dissatisfied and 10 being completely satisfied. Respondent responses of 6-10 were coded as satisfied and 0-5 coded as unsatisfied. Other measures Respondents were also asked if they had received help to reduce their level of drinking in the last six months. Reponses options were coded as yes (1) and no (0). Demographics Demographic variables collected included age, gender, ethnicity (multi-response but prioritised for analysis) and education (categorised as
All the analyses were carried out by combining the model results over approximately 100
imputed datasets.

Once the respondents had been assigned to a trajectory group, ordinal logistic regression
models were used to find variables to predict group membership. As the assumption of
proportionality did not hold, adjacent-category logit regression models were used when
modelling more than two groups. Socio-demographic variables, policy measures, social
mechanisms and other health behaviours observed at the first wave were used to predict
whether a respondent belonged to a trajectory group with heavier consumption. Additionally,
some interactions were tested among the socio-demographic covariates, but they were not
significant. A second set of logistic regression models was used for assessing if the changes
in these measures were related to trajectory membership (specifically the trajectory that
showed the greatest rate of decrease). The estimated trajectory membership (groups) was
treated as the outcome. For a full description of the trajectory analysis see Appendix 1.

                                                                                          15
Results
Composition of the samples by age group, prioritised ethnicity, gender and education are
reported in Table 1 (see Appendix 2).
Average drinking patterns (Aim 1 & 2)
The following section presents results from the 16 to 65-year-old sample only and reports if,
and what, changes in average drinking patterns occurred over the waves 2011, 2013 and
2015, by age group. It also explores if average patterns of adolescents’ drinking behaviour
changed differently from adults. All measures refer to the past six months.
Quantity of alcohol consumed on a typical drinking occasion over the
survey waves
The average quantity of alcohol consumed on a typical drinking occasion in the past six
months declined significantly over the survey waves among 16 to 65-year-olds. In terms of
number of drinks, the decline was from 4.7 drinks at wave 1, to 4.2 drinks at wave 2 to 3.5
drinks at wave 3. A drink was defined here as 12.7 millilitres of ethanol.
Average quantity 5 by age group
The figures below report age group “at wave 1”. For example, as the data are longitudinal,
the 16 to 17-year-olds in 2011 were 20 or 21-years-old by 2015.
The average quantity of alcohol consumed on a typical drinking occasion was higher among
the younger age groups relative to the older age groups. Significant decreases in the
average quantity consumed were found between 2011 and 2015 for drinkers in all age
groups in the past six months, except the 55+ group. The size of the decrease was greater
for adolescents and young people (16 to 17, 18 to 19 and 20 to 24-years-old) relative to the
older age groups (Figure 1).
Average quantity by age group and gender
Male drinkers aged 20 to 24 and 25 to 44 showed a significant decrease in the average
quantity of alcohol consumed on a typical drinking occasion in the past six months in 2011
compared with 2015 (Figure 2). There were no statistically significant differences for female
drinkers.
5 Average quantity refers to the average quantity consumed on a typical drinking occasion.
16Figure 1: Average quantity of alcohol consumed on a typical drinking occasion by age group over
the survey waves.
Figure 2: Average quantity of alcohol consumed on a typical drinking occasion by age group and
gender over the survey waves.
Frequency of drinking over the survey waves
There was no significant change in frequency of drinking in the past six months among 16 to
65-year-olds. Drinking frequency was around three times a week at each survey wave.
Average frequency was higher among the older age groups, in particular those aged 45 to
1754 and 55+, relative to the younger age groups. For drinkers aged 16 to 17, an increase in
frequency was found between 2011 and 2013. No other significant changes were found for
any other age groups (Figure 3).
Figure 3: Average frequency of drinking by age group over the survey waves.
The average frequency of drinking among females of all age groups was observed to be
lower than their male counterparts. Female drinkers aged 16 to 17 significantly increased
their frequency between 2011 and 2013, whereas male drinkers aged 16 to 17 did not. No
other significant changes in frequency were found (Figure 4).
Figure 4: Average frequency of drinking by age group and gender over the survey waves.
18Trajectories (Aim 3)
The following section presents trajectories of drinking patterns using separate samples of 16
to 17-year-old drinkers and 16 to 65-year-old drinkers and the factors that predicted
trajectory membership.
The trajectory analysis focused on the quantity of alcohol consumed on a typical drinking
occasion given this measure is related to acute harm. Further, the only increase in frequency
of drinking found in Aim 1 & 2 was for the 16 to 17-year-olds (at first measurement) and this
was most likely because they became legally able to purchase by the second and third
surveys.
Models aiming to determine how changes in measures predicted membership to the
trajectory with the greatest rate of decrease showed no clear patterns for any of the
trajectories (see Appendix 4, Table 4 for tabulated results and further description).
Trajectories for 16 to 17-year-olds
Two trajectories were identified among male drinkers aged 16 to 17. Group 1 (32% of the
sample) was comprised of drinkers that increased from an average of 1.8 drinks 6 to 3.4
drinks. Group 2 (68%) was comprised of heavier drinkers who decreased from an average of
8.1 drinks in 2012 to 6.5 drinks in 2015 (Figure 5).
Figure 5: Trajectories for 16 to 17-year-old male drinkers: quantity of alcohol consumed on a
typical drinking occasion.
6 Defined as 10g or 12.7ml of ethanol.
19Factors that predicted membership to Group 2 (compared to Group 1) among young males,
were if at wave 1 (year 2012) they were supplied alcohol socially by a friend, if they smoked
tobacco or used cannabis. No other variables included in the model were significant (eg,
underage access, physical availability, marketing exposure and liking, affordability,
satisfaction with health or level of education). See Appendix 3 for tabulated results (Table 2).
Three trajectories were identified for female drinkers aged 16 to 17. Group 1 (6%) and Group
2 (44%) were statistically stable over time. Drinkers in Group 1 consumed on average 1
drink in 2012 to 1.4 drinks in 2015. For drinkers in Group 2 it was 2.8 drinks in 2012 to 3.2
drinks in 2015. Group 3 (50%) decreased from on average 8.6 drinks in 2012 to 5.5 drinks in
2015 (Figure 6).
Figure 6: Trajectories for 16 to 17-year-old female drinkers: quantity of alcohol consumed on a
typical drinking occasion.
Female drinkers aged 16 to 17 were more likely to be heavier drinkers if they were Māori,
and at wave 1 were supplied alcohol socially by a friend and/or smoked tobacco. They were
more likely to be in lower quantity group if they were of Asian ethnicity (see Appendix 3 for
model results - Table 2).
Trajectories for 16 to 65-year-olds
Three trajectories were identified for male drinkers aged 16 to 65. Group 1 (30%) decreased
from an average of 2.1 drinks in 2011 to 1.8 drinks in 2015; Group 2 (53%) decreased from
on average 5 drinks to 3.8 drinks. Group 3 (17%) were heavier drinkers that decreased at a
greater rate relative to the other trajectories (from on average 13.1 drinks in 2011 to 7.8
drinks in 2015) (Figure 7).
20Figure 7: Trajectories for 16 to 65-year-old male drinkers: quantity of alcohol consumed on a
typical drinking occasion.
Male drinkers aged 16 to 65 were more likely to be heavier drinkers if they were Māori or
Pasifika, and at wave 1, liked alcohol advertising, purchased from off-premises after 11pm,
smoked tobacco or used cannabis. Males were more likely to be in a lower quantity group if
they were of older age and had higher education (see Appendix 3, Table 3 for model
results).
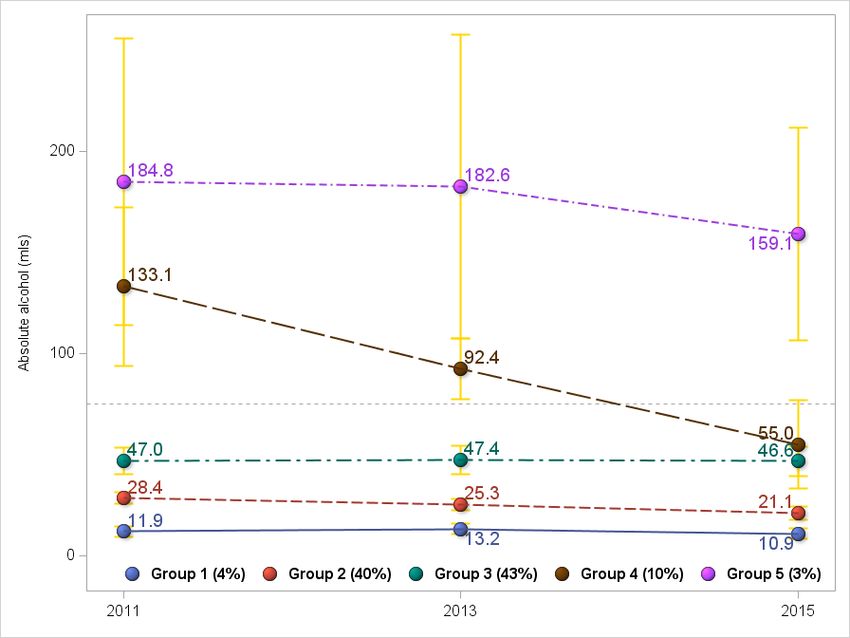
Five trajectories were identified for female drinkers aged 16 to 65. Group 1 (4%) was
statistically stable (at around 1 drink) over the time. Group 2 (40%) decreased from 2.2
drinks in 2011 to 1.7 drinks in 2015. Group 3 (43%) was statistically stable (at an average of
around 3.7 drinks). Group 4 (10%) decreased from on average 10.5 drinks in 2011 to 4.3
drinks in 2015 and Group 5 (3%) was statistically stable at on average 14.5 drinks to 12.5
drinks (ie, was comprised of heavier drinkers) (Figure 8).
Female drinkers aged 16 to 65 were more likely to be in a higher quantity group if they were
Māori or Pasifika, and, at wave 1, liked alcohol advertising, smoked tobacco or used
cannabis. Females were more likely in a lower quantity group if they were satisfied with their
health, were of older age and had medium or high education, relative to lower education
(see Appendix 3, Table 3 for model results).
21Figure 8: Trajectories for 16 to 65-year-old female drinkers: quantity of alcohol consumed on a
typical drinking occasion.
22Discussion
Most international studies assessing declines in adolescent consumption have used cross-
sectional data. The current study utilised longitudinal data to assess both average drinking
patterns and drinking trajectories. The two types of analysis revealed different findings 7.
Average consumption
When average drinking patterns were assessed it was found that average quantity of alcohol
consumed on a typical drinking occasion (Aims 1 & 2) decreased over the three survey
waves. Younger age groups decreased their typical occasion quantity more than the older
age groups. This finding is in keeping with a cross-sectional study that found that decreases
in average consumption between 2001 and 2014 were concentrated in the younger groups
in the Australian population (Livingston et al., 2018).
Longitudinal trajectories
The longitudinal trajectory analysis (Aim 3) found that the decline in quantity of alcohol
consumed on a typical drinking occasion was concentrated among the heavier drinking
trajectories. This was the case for both males and females.
For the 16 to 17-year-olds (at wave 1) who aged through to 20 to 21-years-old (by wave 3),
the decline seen among the heaviest drinkers denotes a departure from the usual behaviour
(in transition from adolescence through to emergent adulthood) found previously. Prior New
Zealand research using longitudinal trajectory analysis found that quantities increased
through adolescence for all trajectories (Boden et al., 2019). Similarly, increases in quantity
trajectories have been found up to 21-years-old (Casswell, Pledger et al., 2002).
The previous studies were undertaken prior to the more recent trend of declining adolescent
consumption. The findings from the current study suggest that declines in heavier drinking
among the 16 to 17-year-olds (at wave 1) are translating through to emergent adulthood (20
to 21-years-old). A recent trajectory analysis from New York found a small decrease in the
average drinks consumed per day between emergent adulthood (around age 23) and young
adulthood (age 33 years) (Windle, 2020). However, in the current study we found decreases
by age 20 to 21-years-old.
Although declines occurred among the heavier drinking trajectories, drinkers in these
trajectories were still at high-risk of experiencing harm. Most heavier drinking trajectories still
remained at the level of drinking around 6+ drinks on a typical drinking occasion by wave 3.
7The difference in findings between the average quantity of alcohol consumed on a typical drinking
occasion and the trajectory analysis is related to the relative size of the trajectory groups and the
homogeneity (heterogeneity) within (between) the groups.
23Consuming at these levels places drinkers at high-risk for a range of injuries and alcohol-
related diseases including cancer (Babor et al., 2010; National Health and Medical Research
Council, 2009).
A collective shift in drinking
This study looked broadly to understand if a collective shift occurred as we did not set out to
empirically test this theory. The results from the 16 to 17-year-old trajectories provided no
evidence of a collective shift. Within the 16 to 17-year-olds, while the heavier trajectory
declined, the lighter trajectories increased (for males) or remained stable (for females)
meaning there was a narrowing of the gap between the groups.
These findings differ from some international studies that have found evidence for
adolescents’ consumption declining at all levels (Brunborg et al., 2014; Norström &
Svensson, 2014; Oldham et al., 2019; Raninen et al., 2014). However, these studies have
used cross-sectional data and not longitudinal data trajectories and so direct comparison is
not possible. It also appears that adolescents are not simply reflecting changes found among
drinkers in the general population, as the 16 to 17-year-old trajectories differed from those
among the 16 to 65-year-olds.
Other possible explanatory factors
One aspect of the study was to try to explain drinking trajectory membership (Aim 3).
Variables available were those related to policy, social mechanisms, indicators of health
consciousness and demographics.
Some variables were found to predict membership to the heavier drinking trajectory for the
16 to 17-year-olds. These included ethnicity, tobacco or cannabis use (for males only) and
social mechanisms, specifically the social supply of alcohol by a friend. These are some of
the same variables that have been shown to predict heavier drinking in other New Zealand
research (eg, Huckle, Huakau, Sweetsur, Huisman, & Casswell, 2008; Meiklejohn, Connor,
& Kypri, 2012). However, the change in these explanatory variables over the survey waves
had limited ability to explain membership to the trajectory with the greatest rate of decrease
(which was often the heavier drinking trajectory), as no clear patterns were revealed.
For the 16 to 65-year-olds, liking of alcohol adverts was also important in predicting
membership to the heavier drinking trajectory. In New Zealand, and elsewhere, published
research on alcohol advertising has mainly focussed on young people (Chambers et al.,
2018; Jernigan, Noel, Landon, Thornton, & Lobstein, 2017; Lin, Casswell, You, & Huckle,
2012). This study finds that alcohol marketing is also an important predictor for heavier
drinking among adults. Tobacco use, cannabis use, purchasing late and ethnicity also
predicted membership to a heavier trajectory for the 16 to 65-year-olds. Whereas, being of
older age, Asian ethnicity and having a high level of education were protective in relation to
24heavier consumption. However, as with the adolescents, change in these variables over the
survey waves had limited ability to predict membership to the trajectory with the greatest rate
of decrease, as no clear patterns were revealed.
Limitations
This study was not able to include all potentially relevant contributors to changes in alcohol
consumption. The measures included in this study were limited to the measures that were
collected in the surveys. Further, some potentially relevant factors (eg, youth culture) may be
hard to measure/operationalise, at least in a quantitative methods approach. For example,
we were not able to include measures of social media impact. Previous studies have found
mixed results as to the impact on adolescent drinking behaviour. An Australian study found
that taking an interest in health context on social media was one factor, among others,
related to reduced alcohol consumption among those aged 15 to 29 (Raggatt et al., 2019).
However, alcohol marketing is prevalent on the internet and on social media platforms, and
adolescents and young people engage with peers on social network sites in ways that may
promote drinking (Pape et al., 2018). A Norwegian study found that more time spent on
social media was associated with a greater likelihood of heavy episodic drinking among
adolescents (Brunborg, Andreas, & Kvaavik, 2017). Moreover, Twitter and Facebook did not
become widely used until after the declines in youth consumption began (Pape et al., 2018)
and this seems to be the case in New Zealand also.
We conducted multiple imputation to correct for attrition bias. We included longitudinal and
additional cross-sectional replenishment samples to improve the quality of imputation. The
imputation was done on the whole sample distribution which preserves the trend ie, the
method considered the behaviour of all drinkers when imputing. Without the multiple
imputation there would be an underestimation of heavy drinking.
The surveys relied on self-reported responses which may be subject to bias, in particular,
under-reporting. The survey questions used in this current study have previously been found
to have good validity, accounting for over 90% of the alcohol available for consumption in
New Zealand (Casswell, Huckle, Wall, & Yeh, 2014). Under-age adolescents may under-
report more than adults (Stockwell, Zhao, & MacDonald, 2014). Further, under-reporting may
have become less likely as the adolescents became of legal age. However, if this did occur,
it was not to a level sufficient to explain the key findings of the study.
The 16 to 17-year-old sample was contrasted with those aged 16 to 65, which also included
16 to 17-year-olds. As independent samples were collected, this meant that the same 16 to
17-year-olds were not being contrasted (wave 1 for the 16 to 65-year-olds was collected in
2011 and wave 1 for the 16 to 17-year-old sample was collected in 2012). We also found
that even if there was an age effect, the declines in the heavy trajectories among the 16 to
65-year-olds were not mainly explained by the 16 to 17-year-olds. Further the 16 to 17-year-
olds comprised only a small fraction of the 16 to 65-year-olds (3.5%).
25Conclusion and implications
Declines in average quantities were driven mainly by declines in heavy drinkers across the
survey waves. This was found for both adolescents (16 to 17-year-olds) and the wider
population (16 to 65-year-olds). Although declines occurred among the heavier drinkers,
most were still consuming around six or more drinks on a typical drinking occasion at wave
3. The decline among the adolescents who were heavier drinkers did not appear to be
explained by a collective shift of drinking or be reflective of wider changes among the
population. While some policy, social mechanisms and use of tobacco or cannabis
measures predicted belonging to a heavy drinker trajectory, changes in these variables over
the survey waves did little to explain membership to the trajectory with the greatest rate of
decline among adolescents (or adults).
To date there is no consensus in the research literature about why adolescents’
consumption has been declining. The findings of this study are in keeping with the literature.
This raises broad and important questions of what measures future research needs to
investigate. Possible future directions, drawn both from the findings of this study and the
wider literature, include changes in youth culture towards alcohol, such as drinking and
intoxication losing their symbolic power as a rite of passage into adulthood, or a culture of
alcohol maturity in which adolescents are maturing out of the tendency to drink heavily more
quickly than in past generations.
The findings from the trajectory analysis may provide some support for a culture of early
alcohol maturity. Heavier drinking declined as 16 to 17-year-olds reached 20 to 21-years-old
which is earlier than has generally been found in previous research. There may also be a
need to go beyond alcohol‐specific factors in our search for the answers and look at broader
societal changes. For example, a comprehensive pattern of lifestyle changes of which
alcohol is one component, a more in-depth assessment of the effects of social media, or a
better understanding of generational differences. Adolescents in the current global context
are experiencing threats of climate and economic influences. These types of broader cultural
and societal shifts may operate cross-country as well, which may provide clues; as while we
have seen declines in adolescent drinking in New Zealand, this trend has also been
occurring in many other high-income countries.
26References
Alcohol Healthwatch. (2018). New Zealand Health Survey 2017/18: Alcohol use. Retrieved
from http://www.ahw.org.nz/Portals/5/Resources/Fact%20Sheet/AHW_Factsheet_
NZ_Health_Survey_2017_18.pdf.
Andersen, A., Rasmussen, M., Bendtsen, P., Due, P., & Holstein, B. E. (2014). Secular
trends in alcohol drinking among Danish 15 year-olds: Comparable representative
samples from 1988 to 2010. Journal of Research on Adolescence, 24, 748-756.
doi:10.1111/jora.12082.
Babor, T., Caetano, R., Casswell, S., Edwards, G., Giesbrecht, N., Graham, K., et al. (2010).
Alcohol: No ordinary commodity research and public policy (2nd ed.). Oxford, UK: Oxford
University Press.
Ball, J., Sim, D., Edwards, R., Fleming, T., Denny, S., Cook, H., & Clark, T. (2019). Declining
adolescent cannabis use occurred across all demographic groups and was accompanied
by declining use of other psychoactive drugs, New Zealand, 2001–2012. New Zealand
Medical Journal, 132(1500), 12-24.
Baška, T., Madarasová-Gecková, A., Bašková, M., & Krajčovič, A. (2016). Decline in alcohol
use among adolescents in Slovakia: A reason for optimism? Public Health, 139, 203-208.
doi:10.1016/j.puhe.2016.08.003.
Bhattacharya, A. (2016). Youthful abandon: Why are young people drinking less? London,
UK: Institute of Alcohol Studies. Retrieved from
http://www.ias.org.uk/uploads/pdf/IAS%20reports/rp22072016.pdf.
Boden, J. M., Newton-Howes, G., Foulds, J., Spittlehouse, J., & Cook, S. (2019).
Trajectories of alcohol use problems based on early adolescent alcohol use: Findings
from a 35 year population cohort. International Journal of Drug Policy, 74, 18-25.
doi:10.1016/j.drugpo.2019.06.011.
Brunborg, G. S., Andreas, J. B., & Kvaavik, E. (2017). Social media use and episodic heavy
drinking among adolescents. Psychological Reports, 120, 475-490.
doi:10.1177/0033294117697090.
Brunborg, G. S., Bye, E. K., & Rossow, I. (2014). Collectivity of drinking behavior among
adolescents: An analysis of the Norwegian ESPAD data 1995-2011. Nordic Studies on
Alcohol and Drugs, 31, 389-400. doi:10.2478/nsad-2014-0030.
Casswell, S., Huckle, T., & Pledger, M. (2002). Survey data need not underestimate alcohol
consumption. Alcoholism Clinical and Experimental Research, 26, 1561-1567.
doi:10.1111/j.1530-0277.2002.tb02456.x.
Casswell, S., Huckle, T., Wall, M., & Yeh, L-C. (2014). International Alcohol Control study:
Pricing data and hours of purchase predict heavier drinking. Alcoholism Clinical and
Experimental Research, 38, 1425-1431. doi:10.1111/acer.12359.
Casswell, S., Pledger, M., & Pratap, S. (2002). Trajectories of drinking from 18 to 26:
Identification and prediction. Addiction, 97, 1427-1437. doi:10.1046/j.1360-
0443.2002.00220.x.
Chambers, T., Stanley, J., Signal, L., Pearson, A. L., Smith, M., Barr, M., & Ni Mhurchu, C.
(2018). Quantifying the nature and extent of children’s real-time exposure to alcohol
marketing in their everyday lives using wearable cameras: Children’s exposure via a
range of media in a range of key places. Alcohol and Alcoholism, 53, 626-633.
doi:10.1093/alcalc/agy053.
27Clark, T., Fleming, T., Bullen, P., Denny, S., Crengle, S., Dyson, B., et al. (2013). Youth’12
overview: The health and wellbeing of New Zealand secondary school students in 2012.
Auckland, NZ: University of Auckland.
Deng, Y., Hillygus, S., Reiter, J., Si, Y., & Zheng, S. (2013). Handling attrition in longitudinal
studies: The case for refreshment samples. Statistical Science, 28, 238-256.
doi:10.1214/13-STS414.
Fuller, E., & Hawkins, V. (2013). Smoking, drinking and drug use among young people in
England in 2013. London, UK: Health and Social Care Information Centre, Lifestyles
Statistics. Retrieved from
http://doc.ukdataservice.ac.uk/doc/7662/mrdoc/pdf/7662_sdd13_report.pdf.
Hallgren, M., Leifman, H., & Andréasson, S. (2012). Drinking less but greater harm: Could
polarized drinking habits explain the divergence between alcohol consumption and harms
among youth? Alcohol and Alcoholism, 47, 581-590. doi:10.1093/alcalc/ags071.
Huckle, T., Casswell, S., Mackintosh, A.-M., Chaiyasong, S., Pham V, C., Morojele, N., et al.
(2018). The International Alcohol Control study (IAC): Methodology and implementation.
Drug and Alcohol Review, 37(Suppl 2), S10-S17. doi:10.1111/dar.12650.
Huckle, T., Huakau, J., Sweetsur, P., Huisman, O., & Casswell, S. (2008). Density of alcohol
outlets and teenage drinking: Living in an alcogenic environment is associated with higher
consumption in a metropolitan setting. Addiction, 103, 1614-1621. doi:10.1111/j.1360-
0443.2008.02318.x.
Jernigan, D., Noel, J., Landon, J., Thornton, N., & Lobstein, T. (2017). Alcohol marketing and
youth alcohol consumption: A systematic review of longitudinal studies published since
2008. Addiction, 112(Suppl 1), 7-20. doi:10.1111/add.13591.
Jones, B., Nagin, D., & Roeder, K. (2001). A SAS procedure based on mixture models for
estimating developmental trajectories. Sociological Methods & Research, 29, 374-393.
doi:10.1177/0049124101029003005.
Lin, E.-Y., Casswell, S., You, R. Q., & Huckle, T. (2012). Engagement with alcohol marketing
and early brand allegiance in relation to early years of drinking. Addiction Research and
Theory, 20, 329-338. doi:10.3109/16066359.2011.632699.
Livingston, M., & Callinan, S. (2017). Changing attitudes to alcohol in Australia. Journal of
Studies on Alcohol and Drugs, 78, 844-852. doi:10.15288/jsad.2017.78.844.
Livingston, M., Callinan, S., Raninen, J., Pennay, A., & Dietze, P. M. (2018). Alcohol
consumption trends in Australia: Comparing surveys and sales-based measures. Drug
and Alcohol Review, 37(Suppl 1), S9-S14. doi:10.1111/dar.12588.
Meiklejohn, J., Connor, J., & Kypri, K. (2012). One in three New Zealand drinkers reports
being harmed by their own drinking in the past year. New Zealand Medical Journal, 125,
28-36.
National Health and Medical Research Council. (2009). Australian guidelines to reduce
health risks from drinking alcohol. Canberra, AU: Commonwealth of Australia.
Norström, T., & Svensson, J. (2014). The declining trend in Swedish youth drinking:
Collectivity or polarization? Addiction, 109, 1437-1446. doi:10.1111/add.12510.
Oldham, M., Callinan, S., Whitaker, V., Fairbrother, H., Curtis, P., Meier, P., et al. (2019).
The decline in youth drinking in England—is everyone drinking less? A quantile
regression analysis. Addiction, 115, 230-238. doi:10.1111/add.14824.
28Pape, H., Rossow, I., & Brunborg, G. (2018). Adolescents drink less: How, who and why? A
review of the recent research literature. Drug and Alcohol Review, 37(Suppl 1), S98-
S114. doi:10.1111/dar.12695.
Pennay, A., Holmes, J., Törrönen, J., Livingston, M., Kraus, L., & Room, R. (2018).
Researching the decline in adolescent drinking: The need for a global and generational
approach. Drug and Alcohol Review, 37(Suppl 1), S115-S119. doi:10.1111/dar.12664.
Raggatt, M., Wright, C., Dietze, P., Pennay, A., Caluzzi, G., & Lim, M. (2019). Correlates of
reduced alcohol consumption among a sample of young Australians. Alcohol and
Alcoholism, 54, 525-531. doi:10.1093/alcalc/agz057.
Raitasalo, K., Simonen, J., Tigerstedt, C., Mäkelä, P., & Tapanainen, H. (2018). What is
going on in underage drinking? Reflections on Finnish European school survey project on
alcohol and other drugs data 1999–2015. Drug and Alcohol Review, 37(Suppl 1), S76-
S84. doi:10.1111/dar.12697.
Raninen, J., & Livingston, M. (2018). Exploring the changing landscape of youth drinking—
we are still drawing the map. Drug and Alcohol Review, 37(Suppl 1), S6-S8.
doi:10.1111/dar.12808.
Raninen, J., Livingston, M., & Leifman, H. (2014). Declining trends in alcohol consumption
among Swedish youth—Does the theory of collectivity of drinking cultures apply? Alcohol
and Alcoholism, 49, 681-686. doi:10.1093/alcalc/agu045.
Stats NZ. (2019, 26 November). Infoshare. Retrieved 20 December, 2019, from
http://archive.stats.govt.nz/infoshare/.
Stockwell, T., Zhao, J., & MacDonald, S. (2014). Who under-reports their alcohol
consumption in telephone surveys and by how much? An application of the ‘yesterday
method’ in a national Canadian substance use survey. Addiction, 109, 1657-1666.
doi:10.1111/add.12609.
Törrönen, J., Roumeliotis, F., Samuelsson, E., Kraus, L., & Room, R. (2019). Why are young
people drinking less than earlier? Identifying and specifying social mechanisms with a
pragmatist approach. International Journal of Drug Policy, 64, 13-20.
doi:10.1016/j.drugpo.2018.12.001.
Toumbourou, J., Rowland, B., Ghayour-Minaie, M., Sherker, S., Patton, G., & Williams, J.
(2018). Student survey trends in reported alcohol use and influencing factors in Australia.
Drug and Alcohol Review, 37(Suppl 1), S58-S66. doi:10.1111/dar.12645.
White, V., Azar, D., Faulkner, A., Coomber, K., Durkin, S., Livingston, M., et al. (2018).
Adolescents' alcohol use and strength of policy relating to youth access, trading hours
and driving under the influence: Findings from Australia. Addiction, 113, 1030-1042.
doi:1010.1111/add.14164.
Windle, M. (2020). Maturing out of alcohol use in young adulthood: Latent class growth
trajectories and concurrent young adult correlates. Alcoholism Clinical and Experimental
Research, 44, 532-540. doi:10.1111/acer.14268.
World Health Organization. (2014). Behaviours affecting current and future health—tobacco
use. Retrieved from http://apps.who.int/adolescent/second-
decade/section4/page8/Tobacco-use.html.
Zeebari, Z., Lundin, A., Dickman, P. W., & Hallgren, M. (2017). Are changes in alcohol
consumption among Swedish youth really occurring ‘in concert’? A new perspective using
quantile regression. Alcohol and Alcoholism, 52, 487-495. doi:10.1093/alcalc/agx020.
29You can also read