ECONOMIC ASSESSMENT ON THE IMPACT OF THE GUM LEAF SKELETONISER, URABA LUGENS IN NEW ZEALAND - APRIL 2003
←
→
Page content transcription
If your browser does not render page correctly, please read the page content below
ECONOMIC ASSESSMENT ON THE IMPACT OF

     THE GUM LEAF SKELETONISER,
    URABA LUGENS IN NEW ZEALAND

              Phil Journeaux
               MAF Policy
                Hamilton

               APRIL 2003
Contents Contents......................................................................................................................................ii Executive Summary ................................................................................................................... 1 Background ................................................................................................................................ 2 Taxonomy............................................................................................................................... 2 Damage................................................................................................................................... 2 Host Range ............................................................................................................................. 3 Extent of Damage................................................................................................................... 3 Climatic Suitability ................................................................................................................ 3 Rate of Spread ........................................................................................................................ 3 Geographic Regions ............................................................................................................... 4 Economic Assessment................................................................................................................ 5 General/Methodology............................................................................................................. 5 Production Forestry Impact.................................................................................................... 5 Amenity Impacts .................................................................................................................... 9 Health Impacts...................................................................................................................... 12 Conservation Estate.............................................................................................................. 13 Trade..................................................................................................................................... 13 Results .................................................................................................................................. 14 Sensitivity Analysis.............................................................................................................. 15 Appendix 1 ............................................................................................................................... 19 Appendix 2 ............................................................................................................................... 21 Appendix 3 ............................................................................................................................... 22 Appendix 4 ............................................................................................................................... 24 Appendix 5 ............................................................................................................................... 25 Appendix 6 ............................................................................................................................... 26 Appendix 7 ............................................................................................................................... 27 Economic Assessment on the Impact of GLS in NZ Page ii
Executive Summary
The Gum Leaf Skeletoniser (GLS), Uraba lugens, is a pest of Eucalyptus trees, and will attack a
wide range of Eucalyptus species. A native of Australia, it has sporadic outbreaks in Eucalyptus
forests, with the damage usually rated as “minor to moderate”. This lower level of impact is mainly
due to a number of natural bio controls, which are absent in New Zealand. Hence the level of
impact in New Zealand is likely to be more severe.

Little is known of the natural rate of spread of GLS; estimates are 1 km/generation or 2 km/year. At
this rate if would take hundreds of years to spread throughout New Zealand. The present value of
the economic impact of this would be very low due to discounting over such a time period. The
probability is that it will spread much faster due to unwitting human assistance, and the assumption
used in this analysis is that it would spread throughout New Zealand in 20 years.

New Zealand currently has approximately 46,000 hectares of Eucalyptus forest, the bulk of which is
in the Bay of Plenty/Central Plateau, and to a lesser extent in Southland. Most of which is grown for
pulp. Production forestry would face increased costs in terms of increased monitoring, spraying, and
increased rotation length. The net present value (NPV) cost of this, at a 10% discount rate, is $69.4
million.

Eucalyptus trees are also a component of the National Amenity Tree Estate, and they would again
be affected by GLS. The impact on this was assessed by two methodologies:

(i)    The direct replacement cost of eucalypts into another specie.

(ii)   The methodology used by Treeby in developing his “Urban Tree Estate Amenity Values and
       Pest Risk” matrix. This is largely based on the replacement cost of affected trees.

The NPV of the impact of GLS on the amenity estate, at a 10% discount rate, was:

(i)    Replacement cost = $72.5 million

(ii)   Treeby methodology = $31.5 million

The overall impact therefore is:

       Production forestry plus replacement cost amenity value = $141.9 million
       Production forestry plus (Treeby) amenity value = $100.9 million

There are health implications with GLS: contact with larval skin will cause stinging and a weal that
may last some weeks. It is thought that this would be unlikely to be significant across the general
population, and no costing was allowed for in this analysis. However, health concerns may be one
incentive to spray for GLS within the urban amenity estate.

The impact of GLS on native flora is unknown and no costing was allowed for in this analysis.
Similarly, it was thought unlikely that GLS would impact on trade and market analysis, and no
costing has been allowed for in this analysis.

Economic Assessment on the Impact of GLS in NZ                                      Page 1
Background Taxonomy Species: Lugens (first described by Walker, 1863) Genus: Uraba Sub Family: Nolinae Family: Nolidae Order: Lepidoptera The Gum Leaf Skeletoniser (GLS), Uraba Lugens, is found in all States of Australia apart from the Northern Territory, in areas where the rainfall varies from 500 mm to more than 1500 mm (Withers, 2003). Damage The small larvae feed gregariously and eat the upper and lower epidermis, the palisade tissue and the spongy mesophyll of the leaf, but avoid the oil cells and the veins. This feeding habit results in the leaf being “skeletonised”, hence the common name of the insect. As the larvae grow toward their final body size of 2.5 cm, they consume progressively increasing leaf quantities, meaning the latter instar larvae are the most damaging (Bain, et al, 1997, Withers, 2003). When pupation occurs (November to December, and March to April) the larvae tends to move downwards and will commonly pupate on the bark of the tree or in the leaf litter at the base of the tree. However, they may pupate on the foliage or on animate objects such as walls of nearby houses. The larvae will incorporate its hairs, shed head capsules and some material from the substrate into the cocoon. Therefore it is often extremely well camouflaged (Withers 2003). Adult moths emerge approximately two weeks later and will mate readily. Very little is known of their flight or dispersal ability, but they are known to fly to nearby trees, and females will locate low branches (which may be many metres above the ground) on which to oviposit. Adults are believed to live for at least a week, during which time they probably oviposit a number of separate egg batches. Females can produce up to 600 eggs, with a mean of around 400, but not all are laid at once (Farr, 2002). GLS can have either one (univoltine) or two (bivoltine) generations per year. In general this seems to be determined to a large extent by climate but the position is not clear. In Eastern Australia “coastal” populations generally are univoltine and “inland” populations are bivoltine. The very limited amount of information available from the population in Tauranga at the time of the 1997 discovery indicates that it would be bivoltine in New Zealand, but quite possibly univoltine in the cooler parts of New Zealand. GLS is included in a list of organisms that “appear significant in terms of their impact on conservation and/or economic values of Australian eucalypt forests” (in Bain 1997). In Australia, Economic Assessment on the Impact of GLS in NZ Page 2
GLS is a typical outbreak forest pest. Between outbreaks damage may be minor, but every 5-10
years a major outbreak is recorded in Australia. Examples of this include: a 1962 outbreak covering
1,000 km2, 45,000 ha in 1983, and 160,000 ha in 1986. Smaller localised outbreaks have occurred
recently in Tasmania (Strelein 1998, Withers, 2003).

Host Range
In Australia GLS has been recorded on a very wide variety of Eucalyptus species. (Refer Appendix
1). It has also been recorded from lophostemon confertus (brush box). In New Zealand it has been
found on E.globulus. E.ficifolia, E.leucoxlyon, E.macracapa, E.Nitens, and E.saligna. (Bain, 1997).
At this stage, it is unknown whether GLS attacks any of New Zealand’s native flora.

Extent of Damage
The impact of GLS on eucalypt growth in outbreaks in Australia is variable. In most of the
outbreaks recorded in the 1980s, damage was generally classified as “light – moderate” with only
around 1% classified as “severe” (Strelein, 1988). Re-growth of damaged crowns varied with the
degree of defoliation. Those severely defoliated made little recovery until larvae pupated and then
gradually refoliated from late summer, although some did not fully recover. Crowns lightly
defoliated appeared to recover completely. Other studies have shown that Eucalyptus growth rates
were generally not affected until 25% of the Crown was defoliated (Lundquist, 1987). Steinbauer
(pers comm) noted that very few Eucalyptus feeding insects such as GLS kill trees and only levels
of defoliation above 50% have resulted in significant reductions in stem volume which cannot be
regained in subsequent growing seasons.

There are a number of natural parasotoids of GLS in Australia, which could very well account for
the time lapse between outbreaks, and the relatively limited extent of defoliation and damage that
occurs. Given that there are no natural controls existing in New Zealand, it could be assumed that
the occurrence of outbreaks, and the level of damage inflicted would be much more severe.

Climatic Suitability
GLS is widely distributed through Eastern, Southern and Western Australia in a variety of climatic
zones, and appears to tolerate a wide range of temperature and rainfall patterns. Comparison of
temperature and rainfall data comparing Australian and New Zealand locations has been carried out
by Bain, et al (1997). This showed a close compatibility for most of New Zealand with the
distribution zones of GLS in Australia. New Zealand temperatures at elevated (Rotorua) and
southern (Gore) localities are marginally lower than those experienced in the range of GLS in
Australia, but not to the extent to limit the establishment of the species throughout most of New
Zealand. Lower temperatures are likely to slow the rate of the insect’s development rather than stop
it. Rainfall below 500 mm is likely to be limiting in some of the drier parts of New Zealand (eg:
Central Otago). Overall, GLS is likely to spread throughout New Zealand if not controlled.

Rate of Spread
Apart from a statement that the adults are poor fliers (Harris, 1974 – in Bain et al, 1997) there is
virtually no information available on the rate of spread of this species. The larvae do not disperse
widely. Movement of larvae from one host to another does occur but it is uncommon unless there is
Economic Assessment on the Impact of GLS in NZ                                      Page 3
a shortage of food material and even then the trees must be in very close proximity, if not actually
in contact. Larvae can lower themselves to the ground on silken thread and can be blown a short
distance by the wind. When on the ground larvae will only move a short distance to locate another
tree. (Bain et al 1997).

An estimate of their natural rate of spread is 1 km per generation (Withers, pers comm). Assuming
two generations per year in most of New Zealand, this will give a natural rate of spread of 2 km per
year. At this rate, it would take 100 plus years for GLS to reach the main eucalyptus plantations in
the upper North Island, and hundreds of years to spread throughout New Zealand as a whole.

The economic impact of this in present value terms would be virtually zero, due to the discounting
effect over such a long time period.

The more likely scenario affecting the rate of spread of GLS throughout the country, is via human
intervention. The probability of infected plant material being transported, albeit unwittingly, to
other areas of the country is very high. Other introduced insects which affect eucalypts have spread
much more rapidly than their “natural rate of spread” would suggest (Withers, 2001). The main
assumption used on the rate of spread of GLS through New Zealand is shown in table one.

Table 1: Spread Rate

                             Year
Auckland                     2003
Rest of Upper NI             2007       (5 yrs)
Lower NI                     2012      (10 yrs)
Upper SI                     2017      (15 yrs)
Lower SI                     2022      (20 yrs)

This very closely mirrors the rate of spread of the leaf blister sawfly, another common insect pest of
eucalypts in Australia (Withers, pers comm).

Geographic Regions
As shown in Tables 1 and 2, the country was split into five regions for this analysis:

Auckland:             North Shore City, Waitakere City, Auckland City, Manukau City, and
                      Papakura District.
Upper North Island:   Northland, Waikato (including all of Franklin District) Bay of Plenty,
                      Gisborne, and Rodney District.
Lower North Island:   Taranaki, Manwatu-Wanganui, Hawke’s Bay, and Wellington.
Upper South Island:   Tasman, Marlborough, West Coast, and Canterbury.
Lower South Island:   Otago and Southland.

Economic Assessment on the Impact of GLS in NZ                                           Page 4
Economic Assessment General/Methodology The economic impact of GLS is based on determining the increased costs that would be incurred if it were allowed to spread throughout New Zealand. In production forestry increased costs would be incurred via the need for monitoring, spraying, and increased rotation length in order to maintain production volumes. For amenity trees costs would be incurred via the need for some spraying to protect the trees, and replacement of some trees. Potentially there would be some public health implications from GLS, which could not be readily quantified. If anything, health concerns would be one incentive to spray in urban areas. The benefit therefore is in preventing these increased costs. It should be noted that there was a dearth of quantifiable data on GLS in New Zealand, so a number of assumptions were required, which are detailed throughout this report. Perhaps the main assumption was that, in the absence of any natural bio-controls, the severity of impact of GLS would be much higher in New Zealand compared with Australia. The assumption on the rate of spread was outlined in Table 1. Again in the absence of any quantifiable data, the rate of impact of GLS was modelled on a “biological” expansion, as outlined in Table 2. This was discussed with Forest Research staff (Withers, pers comm) who thought it realistic. Table 2: Impact Rate Yr 1 after arrival 10% Yr 2 20% Yr 3 40% Yr 4 70% Yr 5 100% The various scenarios outlined below are predicated on these base assumptions of rate of spread and rate of impact. The scenarios were costed out through to 2030, and discounted back to give a net present value. Discount Rate The discount rate used is the Treasury guideline rate of 10%. Production Forestry Impact Areas of Eucalypt There are no exact statistics on areas planted in Eucalypt for production forestry. The National Exotic Forest Description (NEFD, MAF 2003) of Production Forest Plantations includes eucalypt species as “Hardwoods”. As at 1 April 2002, New Zealand had 54,315 ha of hardwoods in planted Economic Assessment on the Impact of GLS in NZ Page 5
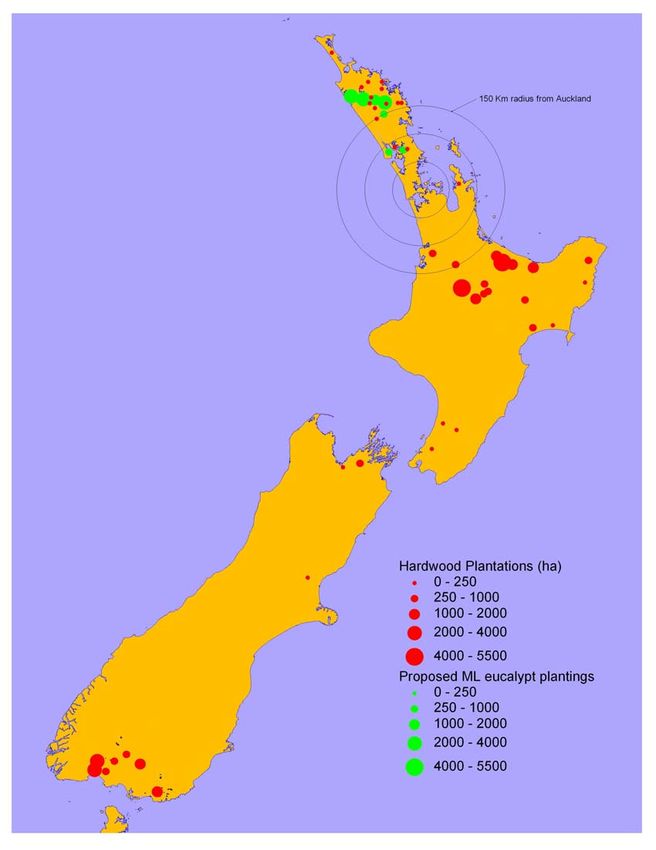
production forests, with the two main areas being the Central North Island and Southland. The
distribution of these hardwood plantations is shown in Figure 1.

Figure 1: New Zealand Hardwood Plantations

                                                           Source: NEFD, MAF (2002)

Economic Assessment on the Impact of GLS in NZ                                        Page 6
Forestry opinion as to the proportion of eucalypts within the Hardwood estate was “80-90%”. Bain
et al, 1997, used a figure of 80% in their analysis. However, there have been further plantings of
eucalypts since then, particularly in the south, and the average proportion assumed in this analysis
was 85%. The area of eucalypts in New Zealand is shown in Table 3.
Table 3: Areas of Eucalypts
Hardwoods Eucalypts
(ha) (ha)
Auckland 1140 969
Rest of Upper NI 29,372 24,966
Lower NI 3,231 2,746
Upper SI 5,223 4,440
Lower SI 15,349 13,047
Total 54,315 46,168
Note: Eucalypts as a percentage of Hardwoods: 85%
Source: NEFD, 2002
The main Eucalyptus species planted for production forestry are as follows, all of which are
susceptible to GLS:
E.nitens
E.fastigata
E.regnans
E.saligna
E.delegatensis
E.pilularis
E.muelleriana
It was very difficult to get any estimate on future intentions of expansions of the Eucalypt forestry
areas. As Figure 1 indicates, there is some interest in expanding the hardwood estate in Northland.
However, this is only a proposition at this point in time. Given this, no allowance has been made in
this analysis for any expansion in the eucalypt forestry area.
Production systems
Much of the Eucalyptus resource is grown for pulpwood or chipwood, particularly the larger stands.
There are a number of small woodlots scattered throughout the country as part of the farm forestry
estate. Many of these smaller woodlots would be mostly for timber production. The amount of
Eucalyptus timber being milled in New Zealand is very small, and it was not possible to determine
accurate costs and returns for a timber production system. Therefore the assumption was made for
this analysis that all production Eucalyptus forests were for pulpwood, and costed accordingly.
Within the North Island, a typical pulpwood regime is a 12-year rotation, and this was used as the
basis for costing North Island Eucalyptus pulp production. In the South Island, growth rates tend to
be somewhat slower, with typical rotation lengths being 13-15 years (Poole, Trost, pers comm). The
main eucalyptus production forest in Southland is currently on a 12 year rotation, but the intent is to
move to a 15 year rotation as soon as sufficient land is available (Manly, pers comm). A standard
15-year rotation was assumed for all South Island eucalypt forests. Costs and returns for these
regimes were based on the “medium” costs and returns stated in Dana (2002), as shown in
Appendix 2. A higher volume production and greater return per cubic metre was assumed for the
South Island regime, given the longer rotation length.
Economic Assessment on the Impact of GLS in NZ Page 7Gum Leaf Skeletoniser Impact
Increased costs would be incurred in various ways relating the impact of GLS.
(1) Monitoring Costs
Given the absence of any bio-controls for GLS, it was felt that an ongoing programme
would be required to monitor the build-up of GLS numbers, and the impact they were
having on Eucalyptus trees. This would most probably involve an annual monitoring
exercise (Bulman, pers comm). This monitoring would be in addition to any current forest
health monitoring programme, and would require monitoring from the ground. The average
monitoring cost of the current pest detection carried out by Forest Health in pine forests is
70 cents/hectare/year (Bulman, pers comm). The smaller size of the eucalyptus forests
would mean less economy of scale, and hence higher costs. Poole (pers comm) indicated a
cost of $1.38/hectare to monitor eucalyptus forests within a 47 km radius of Rotorua. Given
the varying distances and size of forests throughout New Zealand, an average cost of
$1.50/ha was used in this analysis. Also given that GLS produces two sets of eggs per year,
a double survey was assumed in the year prior to any spraying, as numbers multiplied up.
(2) Spray Costs
Given the absence of natural predators, and the likely resultant severity of defoliation, it was
felt that spraying of trees to control GLS was very likely. The regularity of this is uncertain,
but would most probably follow a pattern of:
GLS numbers build up → defoliation becomes severe → spray → GLS numbers
significantly reduced → GLS numbers start to build up → defoliation becomes
severe → spray → GLS numbers relative low → and so on
For the purposes of this analysis, it was assumed that spraying for GLS would be necessary
every five years.
The general consensus on the cost of spraying was $120/ha (Hammond, Towler, Foran, pers
comm). Broadly, this would be broken down into $100/ha for chemical costs and $20/ha for
aerial application and ground crew costs. Currently the average cost of spraying the Painted
Apple Moth in Auckland is $96/ha (Towler, pers comm). It is likely that the cost of spraying
smaller woodlots would be greater on a per hectare basis, but there are no statistics on the
size distribution of eucalypt plantations.
It is most likely that the spray used in eucalypt plantations would be a synthetic pyrethroid,
as this has a much greater efficacy compared to Bt (Hammond, pers comm). Pyrethroid-
based sprays are more expensive, but given their greater knock-down, less spray runs would
be required.
(3) Extension of Rotation
Australian work has shown that the growth rate of eucalypts slowed for two years after
severe defoliation, and then recovered (Lowman, 1987, Withers, pers comm). Quite possibly
the recovery was aided by natural bio-control taking out the GLS. In New Zealand, the
Economic Assessment on the Impact of GLS in NZ Page 8severity of the defoliation is likely to be greater in the absence of bio-controls, and in the
absence of spraying to kill GLS, growth rates are likely to be more affected.
As Eucalyptus trees mature, the properties of the fibre deposited in the trunk alter, such that
any slowing of growth means that the forestry rotation is more likely to be lengthened in
order to harvest a similar quality tree, as opposed to cutting the tree at the intended age (year
12) albeit at a lower volume. In order to model this within the analysis, it was assumed that
the average North Island rotation length would extend to 14 years, and the South Island
rotation length would extend to 18 years.
Cost Benefit Calculation
A cashflow was constructed for the standard 12-year and 15-year rotations respectively, as shown in
Appendix 3. These were then adjusted for the simulated GLS impact.
For the North Island scenario, it was assumed that:
A monitoring cost of $1.00/ha was incurred every year throughout the rotation, with double
surveys being carried out in years 4 and 9, prior to spraying. Sprays were carried out in years 5 and
10, and the rotation length extended to 14 years.
For the South Island scenario, monitoring costs were incurred in every year with double surveys in
years 4, 9 and 14, sprays occurring in years 5, 10 and 15, and the rotation length extended to 18
years.
The difference in net present values (NPV) between the “standard” and the “GLS-impacted” was
calculated (refer Appendix 3). These were then extrapolated across the whole country, relative to
the rate of spread and rate of impact assumptions noted earlier, and a NPV calculated. This is shown
in Appendix 4.
The overall impact of GLS on the New Zealand Eucalypt Forestry Estate was calculated at $69.4
million.
Amenity Impacts
General
The amenity value of trees comes from their contribution to improving the climatic, air and water
quality of urban areas, as well as the social and psychological wellbeing of urban dwellers.
Allocation of a value for this amenity service is very complex. A range of non-market valuation
methodologies can be used (Rosenberger & Smith, 1997), as well as a range of specific tree-
valuation methodologies as discussed by Treeby (1998). Given the limit on time and resources
available, no non-market valuation type approaches were contemplated for this analysis. However,
it is worth noting that currently a “willingness to pay” project is under way in Auckland.
The approach used in this analysis was two-fold:
(i) A direct replacement of eucalyptus trees for other species; and
(ii) the “Treeby” methodology.
Economic Assessment on the Impact of GLS in NZ Page 9(1) Replacement Tree Approach
This approach models the direct cost of replacing eucalyptus trees in the amenity estate over
time, with non-GLS susceptible species. It does not attempt to place any value on the social
and psychological effects of damaged trees.
An estimate of the number of trees in Major Urban, Secondary Urban, and Minor Urban
centres is available from Treeby (1997). He also splits these trees into a number of
categories: those on streets, those in parks and reserves, and those in urban schools and golf
courses. A telephone and email survey was carried out on 12 cities and 15 regional golf
centres, as to the percent of trees in their respective areas that may be eucalypts. The
responses indicated some variation, ranging from 1-10% in the cities, with an average of
around 3-5%; whereas the golf courses ranged from 1-10%, with an average of around 2-
3%.
For the purposes of this analysis a medium value of 3% was used as the proportion of
eucalypts within the national tree amenity estate.
In the Painted Apple Moth (PAM) Economic Impact Assessment, Branson (2002) calculated
the costs involved for a combination of spraying of trees to control PAM, as well as some
replacement of affected trees. Spraying to control PAM, given the wide range of trees it
attacks, involves blanket spraying. Control of GLS in the amenity estate via spraying would
be somewhat more problematic.
Spraying individual trees or clumps of trees in urban or semi-urban areas would be an
expensive exercise. Hammond (pers comm) noted that Civil Aviation Regulations require
twin-turbine helicopters over urban areas; the cost of these is in the order of $3,500-
$4,000/hour. Given a somewhat “stop-start” spraying system, the best they may be able to
achieve is 5-10 hectares/hour. This would give a cost in the order of $400-$700/hectare, on
top of which would be the chemical cost and any ground crew cost. Currently, with the
Painted Apple Moth spraying, aircraft must also remain above 150 feet, which with
helicopters, gives a 200 foot lateral movement of the spray (Hammond, pers comm). Using
helicopters to spray individual trees or clumps of trees would mean that a reasonable area
around these trees would also end up being sprayed. Dispensation would be required from
Civil Aviation if the helicopters were to fly in more closely in order to achieve a more
accurate placement.
Another possibility would be ground spraying using cherry pickers (or something similar).
Hireage cost of this equipment, based on discussions with Hamilton hireage firms, would be
in the order of $260/day, or $200-$220/day for “five-days or more” hireage. On top of this
would be the normal costs of a spraying contractor. Estimate of contract spray costs proved
difficult, as local contractors talked to had never attempted to spray mature trees and were
unwilling to provide estimates.
Given the relatively low percentage of Eucalyptus trees in the amenity estate, and the
relatively high cost of aerial spraying, it is problematic whether urban authorities, schools
and golf courses would spray to protect these trees. Potentially, areas of significant
landscape value would be protected, and public health issues (discussed later) could provide
an incentive for GLS control in the more public areas. Additionally, trees in residential
sections are unlikely to be sprayed due to the expense and issues of spraying in residential
areas.
Economic Assessment on the Impact of GLS in NZ Page 10Replacement of Trees
The main assumption therefore is that spraying is an unlikely control measure for GLS in
the amenity tree estate, and affected trees would be replaced with non-GLS susceptible
species.
For this analysis it was assumed that all eucalypts would be replaced over a 15 year period,
starting five years after GLS first arrived; ie: when it was at 100% impact rate.
It was also assumed that the rate of replacement of eucalypt trees would follow a “skewed”
bell shaped curve, with a longer tail. The assumption was that replacement would start out
slowly, build up rapidly to a peak, and then tail off as the more difficult to get at trees (and
probably more expensive) were slowly replaced. This is illustrated in Table 4.
Table 4: Rate of Replacement of Amenity Eucalypts
Year 1 GLS Arrives
Year 5 GLS at full impact
% of Eucalypts
Replaced
Year 5 2%
Year 6 3%
Year 7 5%
Year 8 7%
Year 9 12%
Year 10 13%
Year 11 12%
Year 12 10%
Year 13 9%
Year 14 7%
Year 15 6%
Year 16 5%
Year 17 4%
Year 18 3%
Year 19 2%
100.0%
The cost of removing the eucalyptus trees and replacement with an alternative was set at
$864. This is based on the 1997 NZIER cost (discussed in Branson, 2002) updated to 2003
using the CPI.
Results
The above assumptions were incorporated with the rate of spread and rate of impact
assumptions discussed earlier, and cashflowed through to 2041(Appendix 6). The resulting
NPV was: $72.5 million.
(2) Treeby Methodology
In 1997, Bruce Treeby produced a report entitled “Urban Tree Estate Amenity Values and
Pest Risk” for the Ministry of Forestry Biosecurity team. This report used a combination of
the Standard Tree Evaluation Method (STEM) – (Flook, 1996) and the “Toy/Gould
Auckland City Model” in an attempt to value the urban tree estate in New Zealand. The
report used the Resource Management Act interpretation and application of amenity values,
Economic Assessment on the Impact of GLS in NZ Page 11and recognised that amenity values were closely related to the wealth of communities and
relative values for different urban areas were based on the 1996 average house values
provided by Valuation New Zealand.
The application of STEM to broad scale landscape applications has shown that the method
gives large over-valuations (Treeby 1998), and within the 1997 report, Treeby adapted the
STEM applications to generate more realistic values and to reflect the variation of amenity
values within and between urban areas. Using this methodology, Treeby calculated that the
national total value of urban trees to New Zealand was $11 billion – approximately 5% of
what would have been generated by the unmodified STEM process.
Essentially the methodology used by Treeby is based on a replacement cost of trees of
different types. Full details of this are explained in his paper. Using this methodology,
Treeby derived a matrix, which calculated the impact on the tree amenity values, relative to
the percent of trees attacked and the degree of damage. This is illustrated below in Table 5.
Table 5: Pest Value Matrix for Urban Tree Estate Amenity Value Loss
Percentage High Impact Medium Impact Low Impact
of Trees Attacked 60% damage 20% damage 5% Damage
15% $993,631,259 $331,210,420 $82,802,605
10% $662,420,839 $220,806,946 $55,201,737
5% $331,210,420 $110,403,473 $27,600,868
Source: Treeby, 1997
In the absence of time to re-work Treeby’s spreadsheets up from first principals, the above
matrix was inflated through to 2003 using the CPI. This gave the results outlined in Table 6.
Table 6: Pest Value Matrix for Urban Tree Estate Amenity Value Loss, Updated to
2003 using the CPI: 1997-2002 of 7.98%
Percentage High Impact Medium Impact Low Impact
of Trees Attacked 60% damage 20% damage 5% Damage
15% $1,072,884,002 $357,628,001 $89,407,000
10% $715,256,001 $238,418,667 $59,604,667
5% $357,628,001 $119,209,334 $29,802,333
To calculate the impact of Gum Leaf Skeletoniser, it was assumed that Eucalyptus trees
make up 3% of the urban amenity estate. This was then applied to the percent of urban
amenity trees in the regions being used for this analysis, and then multiplied up using the
rate of spread and rate of impact assumptions. Assuming a medium level of impact (20%
damage) as defined by Treeby, the net present value of this impact is $31.5 million.
Details of calculations are shown in Appendix 7.
Health Impacts
Each body segment of the GLS larvae has ten tubercle-carrying setae, of which there are two
ventral, four lateral, and four dorsal. The four dorsal tubercles carry stiff, brown-tipped bristles,
with an envenomating capacity. When these brown-tipped bristles are allowed to touch the skin
Economic Assessment on the Impact of GLS in NZ Page 12(except thick palmar skin) they immediately cause a sharp stinging sensation, followed by a weal and flare (Southcott, 1978). This stinging is caused even by the most juvenile early-hatched larvae, as well as via cast larval skins. It is apparent that contact with any stage of the live larvae causes immediate stinging. A similar, but initially lesser reaction, occurs from contact with cast larval skins. After the spines contact the skin, there is an immediate stinging reaction attributable to the histamine content. This is followed by an erythema, then a slow wealing. These lesions can be visible for several weeks (Southcott, 1978). Given that both the number of people affected and the probability of severe reaction are likely to be low, the total costs, such as medical expenses and labour productivity losses due to absence from work, are thought likely to be relatively small. The Ministry of Health thought it was unlikely to be significant across the range of the population (Gilbert, pers comm). While the risk to human health may be relatively low, the potential impact would provide one incentive for both households and authorities responsible for such areas as parks and reserves, schools, and golf courses, to spray to control GLS. No costings were allowed in this analysis for any health impacts. Conservation Estate At this stage, the impact of GLS on native flora is unknown. Trials are underway at Forest Research to determine this. No costing was allowed for in this current analysis. Trade No impact on trade or market access as a result of GLS was allowed for in this report. Discussions with MAF Policy International (Allen, pers comm) and MAF Biosecurity (Self, pers comm) indicated a low probability of any constraints. There may be some risk if there was a major outbreak and cross-contamination occurred. While the general risk was assessed as minor, there is still a degree of “unknowness”. Economic Assessment on the Impact of GLS in NZ Page 13
Results
At the 10% discount rate, the impact on production forestry is $69.4 million.

The amenity impact was:

(i)     Tree Replacement = $72.5 million

(iii)   Treeby methodology = $31.5 million

Overall, the impact was:

        Production plus tree replacement = $141.9 million
        Production plus Treeby = $100.9 million

Economic Assessment on the Impact of GLS in NZ                                  Page 14
Sensitivity Analysis
(1) At a 5.6% discount rate (Govt 10-year bond rate) the impact increases to:
Production Forestry = $161.6 million
Amenity:
(i) Tree replacement = $140.9 million
(ii) Using the Treeby methodology = $43.4 million
Combined:
Production plus tree replacement = $302.5 million
Production plus Treeby amenity = $205 million
(2) If the percent of eucalypts in the amenity estate are varied. Current scenario equals 3%.
(i) For tree replacement, a 1% increase or decrease altered the NPV by $24.1 million.
(ii) Using the Treeby methodology a 1% change altered the NPV by $10.5 million.
(3) The major cost to the production forestry system was the extension to the rotation length in
order to maintain volumes. An alternative to this would be to increase the number of sprays
to prevent any damage.
Current scenario of extending rotation; NPV @ 10% = $69.4 million
(i) If spraying 5-yearly were sufficient to control GLS – no extension of rotation
required; NPV @ 10% = 16.4 million
(ii) Spraying 2-yearly from Year 3, but not in the final year; NPV @ 10% = $40.3
million
(iii) Spraying annually from Year 3, but not in the final year; NPV @ 10% = $70.1
million.
From this analysis, it would appear that biennial spraying is more economic than allowing
the rotation to extend, while annual spraying is on a par.
(4) Change in the rate of replacement of eucalyptus within the amenity estate.
If trees were replaced at a
(i) Linear rate NPV @ 10% = $55.5 million
(ii) If trees were replaced at a curvilinear rate NPV @ 10% = $48.8 million
Economic Assessment on the Impact of GLS in NZ Page 15Table 7: Linear Rate Table 8: Curvilinear Rate
Year 1 GLS Arrives % of Eucalypts
Replaced
Year 5 GLS at full impact
% of Eucalypts
Replaced
Year 5 0.5% Year 5 0.5%
Year 6 1.0% Year 6 0.8%
Year 7 2.0% Year 7 1.0%
Year 8 3.0% Year 8 1.5%
Year 9 4.0% Year 9 2.0%
Year 10 5.0% Year 10 2.2%
Year 11 6.0% Year 11 3.0%
Year 12 7.0% Year 12 4.5%
Year 13 8.0% Year 13 6.0%
Year 14 9.0% Year 14 7.5%
Year 15 9.5% Year 15 9.0%
Year 16 10.0% Year 16 11.0%
Year 17 11.0% Year 17 14.0%
Year 18 12.0% Year 18 17.0%
Year 19 12.0% Year 19 20.0%
100.0% 100.0%
(5) Rate of spread is twice that of original assumption.
Table 9: Spread Rate
Year
Auckland 2003
Upper NI 2012 (10 yrs)
Lower NI 2022 (20 yrs)
Upper SI 2032 (30 yrs)
Lower SI 2042 (40 yrs)
Forestry impact: NPV @ 10% = $44.4 million
Replacement of amenity trees = $51.5 million
Treeby = $27.6 million
(6) Rate of impact of GIS is twice that of original assumption (follows a curvilinear pattern).
Table 10: Rate of Impact
Impact Rate:
Yr 1 after arrival 3%
Yr 2 7%
Yr 3 12%
Yr 4 20%
Yr 5 30%
Yr 6 45%
Yr 7 60%
Yr 8 75%
Yr 9 90%
Yr 10 100%
Economic Assessment on the Impact of GLS in NZ Page 16Forestry impact – NPV @ 10% = $53.2 million
* Replacement amenity trees = $52.2 million
Treeby = $24.2 million
*Assumes trees start being replaced in Year 8 of impact.
(7) Assume both rate of spread and rate of impact twice original assumption.
Forestry impact. NPV @ 10% = $33.5 million
Replacement amenity trees = $38.7 million
Treeby = $21.9 million
Economic Assessment on the Impact of GLS in NZ Page 17References
Bain, J, Mackenzie H, Crabtree, R., 1997. Impact assessment for the gum leaf skeletoniser, Uraba lugens,
Walker (Lepidoptera; Nolidae) in New Zealand. Internal Report to MoF Biosecurity.
Branson, J, 2002. Painted apple moth: reassessment of potential economic impacts. Internal Report to MAF
Biosecurity.
Farr, J D, 2002. Biology of the gum leaf skeletoniser, Uraba lugens, Walker (Lepidoptera; Noctuidae), in the
southern jarrah forest of Western Australia. Australian Journal of Entomology 41, 60-69.
Flook, R, 1996. STEM, A standard tree evaluation method
Lowman, M D, Heatwole, H, 1987. The impact of defoliating insects on the growth of eucalypt sapplings.
Australian Journal of Ecology 12, 175-181.
Lundquist, J E, Purnell, R C, 1987. Effects of mycosphaerella leaf spot on growth of Eucalyptus nitens. Plant
Disease 71. 1025-1029.
MAF, 2003. National Exotic Forest Description.
Rosenberger, R S, Smith E L, 1997. Non-market economic impacts of forest insect pests: a literature review.
United States Department of Agriculture. General Technical Report. PSW-GTR-164.
Southcott, R V, 1978. Lepidopterism in the Australian region. Records of the Adelaide Childrens’ Hospital.
Volume 2, Number 1, September, pp87-173.
Strelein, G J, 1988. Gum leaf skeletoniser moth, Uraba lugens, in the forests of Western Australia.
Australian Forestry 51(3), 197-204.
Treeby, B, 1997. Urban tree estate amenity values and pest risk. Report prepared for MoF Biosecurity.
Treeby, B, 1998. Valuation of the urban tree estate. Report prepared for MoF Biosecurity.
Withers, T M, 2001. Colonisation of eucalypts in New Zealand by Australian insects. Australian Ecology 26,
467-476.
Withers, T, 2003. The biology of gum leaf skeletoniser, Uraba lugens, A brief report to the Treasury.
Personal Communications:
Dr Toni Withers, Forest Health, Forest Research
Martin Steinbauer, CSIRO, Australia
Barry Poole, Forest Research, Rotorua
Parnell Trost, MAF Policy, Dunedin
Sally Gilbert, Ministry of Health, Wellington
Lindsay Bulman, Forest Research, Rotorua
Don Hammond, Forest Health Contractor
Murray Towler, AgriQuality New Zealand
Warwick Foran, MAF Forest Management
Simon Anderson, Carter Holt Harvey
Dave Allen, MAF Policy, Wellington
Mark Self, MAF Biosecurity, Wellington
Graeme Manly, Southwood Ltd
Economic Assessment on the Impact of GLS in NZ Page 18Appendix 1
Recorded Hosts Uraba Lugens in Australia
[Extract from “Impact Assessment for the gum leaf skeletoniser, Uraba lugens, Walker (Lepidoptera: Nolidae) in New Zealand by
John Bain, Heather McKenzie & Roger Crabtree, New Zealand Forest Research Institute Limited, Rotorua, 10 October 1997”
publication.]
Section Rufaria
Corymbia calophylla
Corymbia ficifolia
Section Quadraria
Eucalyptus (Eudesmia) erythrocorys
Section Hesparia
Eucalyptus (Monocalyptus) patens
Section Renantheria
Eucalyptus (Monocalyptus) delegatensis
Eucalyptus (Monocalyptus) dives
Eucalyptus (Monocalyptus) elata
Eucalyptus (Monocalyptus eugenioides
Eucalyptus (Monocalyptus) marginata
Eucalyptus (Monocalyptus) macrorhyncha
Eucalyptus (Monocalyptus) muelleriana
Eucalyptus (Monocalyptus) obliqua
Eucalyptus (Monocalyptus) pauciflora
Eucalyptus (Monocalyptus) pilularis
Eucalyptus (Monocalyptus) radiata
Eucalyptus (Monocalyptus) regnans
Eucalyptus (Monocalyptus) robertsonii
Eucalyptus (Monocalyptus) stellulata
Section Adnataria
Eucalyptus (Symphomyrtus) crebra
Eucalyptus (Symphomyrtus) largiflorens
Eucalyptus (Symphomyrtus) leucoxylon
Eucalyptus (Symphomyrtus) moluccana
Eucalyptus (Symphomyrtus) melanophloia
Eucalyptus (Symphomyrtus) melliodora
Section Bisectaria
Eucalyptus (Symphomyrtus) conferruminata
Eucalyptus (Symphomyrtus) decipiens
Eucalyptus (Symphomyrtus) wandoo
Section Exsertaria
Eucalyptus (Symphomyrtus) blakelyi
Eucalyptus (Symphomyrtus) camaldulensis
Eucalyptus (Symphomyrtus) rudis
Eucalyptus (Symphomyrtus) tereticornis
Section Maidenaria
Eucalyptus (Symphomyrtus) bridgesiana
Eucalyptus (Symphomyrtus) crenulata
Eucalyptus (Symphomyrtus) dalrympleana
Eucalyptus (Symphomyrtus) globulus
Eucalyptus (Symphomyrtus) nitens
Eucalyptus (Symphomyrtus) viminalis
Economic Assessment on the Impact of GLS in NZ Page 19Section Transversaria
Eucalyptus (Symphomyrtus) diversicolor
Eucalyptus (Symphomytus) grandis
Eucalyptus (Symphomyrtus) robusta
Eucalyptus (Symphomyrtus) saligna
There is also one reference to it feeding on Lophostemon confertus (brush box).
The following have been consulted in compiling the above list:
Allen, G.R. 1990. Influence of host behaviour and host size on the success of oviposition of Cotesia urabae and Dolichogenidea
eucalypti (Hymenoptera: Braconidae). Journal of Insect Behaviour 3(6): 733-749.
Brimblecombe, A.R., 1962. Outbreaks of the eucalypt leaf skeletonizer. Queensland Journal of Agricultural Science 19: 209-217.
Browne, F.G., 1968. Pests and diseases of forest plantation trees. An annotated list of the principal species occurring in the British
Commonwealth. Clarendon Press, Oxford. 1330 p.
Campbell, K.G., 1962. The biology of Roeselia lugens (Walk.), the gum-leaf skeletonizer moth, with particular reference to the
Eucalyptus camaldulensis Dehn. (river red gum) forests of the Murray Valley Region. Proceedings of the Linnean Society
of New South Wales 87: 316-338.
Elliott, H.J.; de Little, D.W., no date given. Insect pests of trees and timber in Tasmania. Forestry Commission, Tasmania. 90 p.
Harris, J.A., 1974. The gum leaf skeletoniser Uraba lugens in Victoria. Forestry Commission, Victoria. Forestry Technical Papers
No. 22: 12-18.
Hillis, W.E.; Brown, A.G., 1984. Eucalypts for wood production. Academic Press, Sydney. 434 p.
Jones, D.; Elliot, R. 1986. Pests, diseases and ailments of Australian plants. Lothian, Melbourne, 333 p.
McMaugh, J., 1986. What garden pest or disease is that? Companion edition. Lansdowne, Sydney. 302 p.
Neumann, F.G.; Smith, I.W.; Wardlaw, T.J.; Wylie, F.R., 1994. Joint Australia and New Zealand Environmental and Conservation
Council-Ministerial Council on Forestry, Fisheries and Aquaculture National Forest Policy Statement Implementation Sub-
Committee. The development of consistent nationwide baseline environmental standards for native forests, Technical
working group on Forest use and management, Pests and diseases, pp 17-39. (draft report).
RWG 8 (Forest Entomology), 1994. Forest pest situation in Australia 1992/93.
Strelein, G.J., 1988. Gum leaf skeletoniser moth, Uraba lugens, in the forests of Western Australia. Australian Forestry 51(3): 197-
204.
Waterson, D., date ?. Gumleaf skeletonizer (Uraba lugens). State Forests of New South Wales, Research Division. Forest Protection
Series Number E7. 3pp.
Economic Assessment on the Impact of GLS in NZ Page 20Appendix 2
Costs and Returns, Eucalyptus Pulp Regime
2002 Growing Costs – North Island, New Zealand E. Nitens/Fastigata (NZ$/ha, M3/ha and NZ$/M3)
Year Operation Low Medium High
NZ$/ha NZ$/ha NZ$/ha
-1 Land Purchase 1,000 2,000 3,500
-1 Access Tracking 50 100 150
-1 Site Preparation 150 270 325
0 Animal Control 20 35 40
0 Planting 500 700 800
0 Weeding 100 130 160
0 Nutrition 100 140 180
1 Weeding 100 130 160
10 Roading 2.5 4 6
10 Harvesting 10 20 30
10 Transport 8 12 17
All Annual Costs 30 45 60
Yield Low m3/ha Medium m3/ha High m3/ha
10 Pulp 160 250 350
3
Stumpage Low NZ$/m Medium NZ$/m3 High NZ$/m3
10 Pulp 15 30 45
Source: The NZ Forest Products Industry Review, 2002 Edition, DANA Publishing
Economic Assessment on the Impact of GLS in NZ Page 21Appendix 3
(i) Economic Impact of GLS on North Island Eucalypt System
Standard 12 year rotation
Per Hectare Discount rate: 10%
Year Costs NPV $676.39
0 370 -370
1 1005 -1005
2 130 -130
3 45 -45
4 45 -45
5 85 -85
6 45 -45
7 45 -45
8 45 -45
9 45 -45
10 45 -45
11 45 -45
12 49 7500 7451
Yr 12 Volume (m3): 250
Price $/m3 30
Impact of GLS
Per Hectare Discount rate: 10%
Year Costs NPV $179.76
0 370 -370
1 1006 -1006
2 131 -131
3 47 -46.5
4 48 -48
5 166 -166
6 47 -46.5 NPV Difference: $496.63
7 47 -46.5
8 47 -46.5
9 48 -48
10 166 -166
11 47 -46.5
12 47 -46.5
13 47 -46.5
14 49 7500 7451
Yr 12 Volume (m3): 250
Price $/m3 30
Economic Assessment on the Impact of GLS in NZ Page 22(ii) Economic Impact of GLS on South Island Eucalypt System
15 Year Rotation
Per Hectare Discount rate: 10%
Year Costs NPV $1,726.15
0 370 -370
1 1005 -1005
2 130 -130
3 45 -45
4 45 -45
5 45 -45
6 45 -45
7 45 -45
8 45 -45
9 45 -45
10 45 -45
11 45 -45
12 45 -45
13 45 -45
14 45 -45
15 49 14850 14801
Yr 15 Volume (m3): 330
Price $/m3 45
Impact of GLS
Per Hectare Discount rate: 10%
Year Costs NPV $751
0 370 -370
1 1006 -1006
2 131 -131
3 47 -46.5
4 48 -48
5 166 -166
6 47 -46.5
7 47 -46.5 NPV Difference: $975.24
8 47 -46.5
9 48 -48
10 166 -166
11 47 -46.5
12 47 -46.5
13 47 -46.5
14 48 -48
15 166 -166
16 47 -46.7
17 47 -46.5
18 49 14850 14801
Yr 18 Volume (m3): 330
Price $/m3 45
Economic Assessment on the Impact of GLS in NZ Page 23Appendix 4
Economic Impact of GLS on New Zealand Eucalyptus Forests
Hectares Affected Discount rate: 10%
Rest of Cummulative Cost Per Cost Per
Auckland Upper NI Lower NI Upper SI Lower SI Hectares Hectare NI Hectare SI Total cost NPV $69,418,130
2003 0 $497 $0
2004 97 97 $48,124
2005 194 194 $96,247
2006 388 388 $192,494
2007 678 678 $336,865
2008 969 2497 3466 $1,721,134
2009 969 4993 5962 $2,961,032
2010 969 9986 10955 $5,440,829
2011 969 17476 18445 $9,160,525
2012 969 24966 25935 $12,880,220
2013 969 24966 275 26210 $13,016,613
2014 969 24966 549 26484 $13,153,005
2015 969 24966 1099 27034 $13,425,789
2016 969 24966 1922 27858 $13,834,966
2017 969 24966 2746 28682 $14,244,142
2018 969 24966 2746 444 29126 $975 $14,677,105
2019 969 24966 2746 888 29569 $15,110,068
2020 969 24966 2746 1776 30457 $15,975,994
2021 969 24966 2746 3108 31789 $17,274,882
2022 969 24966 2746 4440 33121 $18,573,771
2023 969 24966 2746 4440 1305 34426 $19,846,133
2024 969 24966 2746 4440 2609 35730 $21,118,494
2025 969 24966 2746 4440 5219 38340 $23,663,218
2026 969 24966 2746 4440 9133 42254 $27,480,304
2027 969 24966 2746 4440 13047 46168 $31,297,390
2028 969 24966 2746 4440 13047 46168 $31,297,390
2029 969 24966 2746 4440 13047 46168 $31,297,390
2030 969 24966 2746 4440 13047 46168 $30,816,155
Economic Assessment on the Impact of GLS in NZ Page 24Appendix 5
Urban Tree Numbers (from Treeby 1997)
Major Secondary Minor Total
Urban Urban Urban
Auckland 3,714,134 3,714,134
Rest of Upper NI 1,829,093 377,133 946,992 3,153,218
Lower NI 2,821,667 670,979 457,019 3,949,665
Upper SI 1,683,307 450,191 268,744 2,402,242
Lower SI 1,415,738 142,853 138,021 1,696,612
14,915,871
Tree Numbers Major Secondary Minor Total
(a) Streets Urban Urban Urban
Auckland 139019 139,019
Rest of Upper NI 47162 8393 16537 72,092
Lower NI 77785 11181 9952 98,917
Upper SI 48998 9468 6375 64,840
Lower SI 11339 2853 3988 18,179
393,048
(b) Parks & Reserves
Auckland 2291913 2,291,913
Rest of Upper NI 1230286 257643 507657 1,995,585
Lower NI 1830756 343231 305494 2,479,481
Upper SI 1066474 290639 195691 1,552,804
Lower SI 1152387 87567 122421 1,362,375
9,682,158
Urban Schools & Golf Courses (ha) (Treeby 1997)
Major Secondary Minor Total
Urban Urban Urban
Auckland 1532 1,532
Rest of Upper NI 1176 252 1596 3,024
Lower NI 1890 462 1176 3,528
Upper SI 798 504 840 2,142
Lower SI 462 252 504 1,218
11,444
Urban Dwellings (from 2001 Census)
Auckland 353,106
Rest of Upper NI 327,420
Lower NI 332,466
Upper SI 246,978
Lower SI 107,673
Total 1,367,643
Economic Assessment on the Impact of GLS in NZ Page 25Appendix 6
Replacement of Eucalyptus Trees in the Amenity Estate
Discount rate: 10%
NPV: $72,539,963
Auckland Upper NI Lower NI Upper SI Lower SI Total
2003 0
2004 0
2005 0
2006 0
2007 1925051 1925051
2008 2887576 2887576
2009 4812626 4812626
2010 6737677 6737677
2011 11550303 11550303
2012 12512828 1634326 14147154
2013 11550303 2451488 14001791
2014 9625253 4085814 13711066
2015 8662727 5720139 14382867
2016 6737677 9805953 16543630
2017 5775152 10623116 2047127 18445394
2018 4812626 9805953 3070691 17689270
2019 3850101 8171628 5117818 17139546
2020 2887576 7354465 7164945 17406986
2021 1925051 5720139 12282763 19927953
2022 4902977 13306327 1245092 19454395
2023 4085814 12282763 1867637 18236214
2024 3268651 10235636 3112729 16617016
2025 2451488 9212072 4357821 16021381
2026 1634326 7164945 7470550 16269820
2027 6141382 8093096 879361 15113838
2028 5117818 7470550 1319041 13907409
2029 4094254 6225458 2198402 12518114
2030 3070691 5602912 3077763 11751366
2031 2047127 4357821 5276165 11681113
2032 3735275 5715845 9451120
2033 3112729 5276165 8388894
2034 2490183 4396804 6886987
2035 1867637 3957124 5824761
2036 1245092 3077763 4322854
2037 2638082 2638082
2038 2198402 2198402
2039 1758722 1758722
2040 1319041 1319041
2041 879361 879361
Economic Assessment on the Impact of GLS in NZ Page 26Appendix 7
Amenity Impact of GLS Using Treeby Methodology
Discount Rate: 10%
NPV: $31,481,018
Cumulative
Auckland Upper NI Lower NI Upper SI Lower SI Cost
2003 0
2004 2861024 2861024
2005 2861024 2861024
2006 5722048 5722048
2007 8583072 8583072
2008 8583072 1430512 10013584
2009 1430512 1430512
2010 2861024 2861024
2011 4291536 4291536
2012 4291536 4291536
2013 1788140 1788140
2014 1788140 1788140
2015 3576280 3576280
2016 5364420 5364420
2017 5364420 5364420
2018 715256 715256
2019 715256 715256
2020 1430512 1430512
2021 2145768 2145768
2022 2145768 2145768
2023 357628 357628
2024 357628 357628
2025 715256 715256
2026 1072884 1072884
2027 1072884 1072884
2028 0
2029 0
2030 0
Economic Assessment on the Impact of GLS in NZ Page 27You can also read