Masters Clarendon Economic Impact Assessment - NSW Government
←
→
Page content transcription
If your browser does not render page correctly, please read the page content below
Masters Clarendon
  Economic Impact Assessment

                 September 2013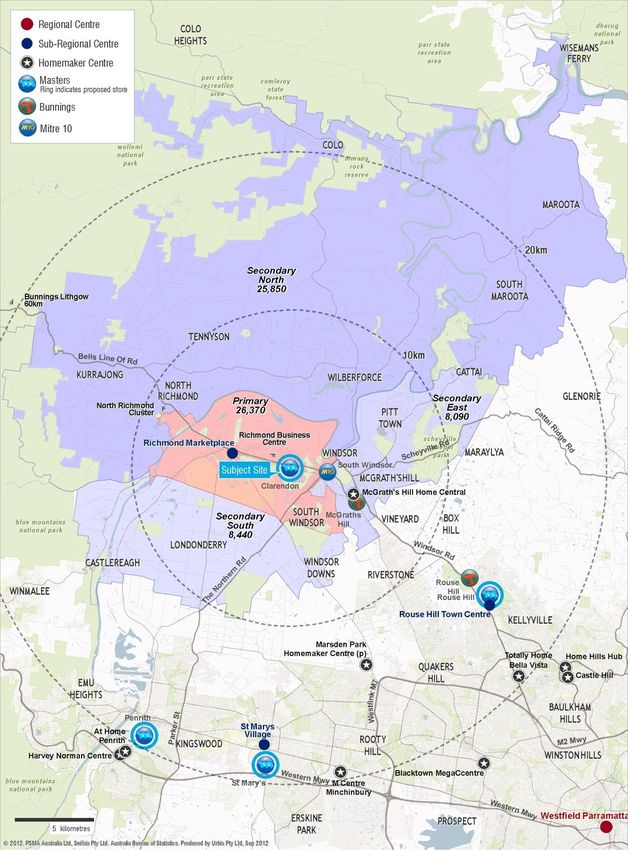
URBIS STAFF RESPONSIBLE FOR THIS REPORT WERE:

Director                    Clinton Ostwald
Senior Consultant           David Wilcox
Job Code                    SPE0352
Report Number               RP3 FINAL REV C
xdisclai mer x

© Urbis Pty Ltd
ABN 50 105 256 228

All Rights Reserved. No material may be reproduced without prior permission.
While we have tried to ensure the accuracy of the information in this publication,
the Publisher accepts no responsibility or liability for any errors, omissions or
resultant consequences including any loss or damage arising from reliance in
information in this publication.

URBIS
Australia Asia Middle East
urbis.com.au

TABLE OF CONTENTS

Executive Summary ..................................................................................................................................... i

Introduction .................................................................................................................................................. 1

1          Nature of Use and Product Range ................................................................................................. 2
1.1        Proposed Rezoning .......................................................................................................................... 2
1.2        The Masters Concept ....................................................................................................................... 4
1.2.1      Site Development Concept ............................................................................................................... 4
1.3        Subject Site ....................................................................................................................................... 4
1.4        Surrounding Land Use Context ........................................................................................................ 5

2          Trade Area Analysis ........................................................................................................................ 6
2.1        Trade Area Population ...................................................................................................................... 9
2.2        Demographic Characteristics ......................................................................................................... 12

3          Trade Area Household Expenditure ............................................................................................15
3.1        Methodology ................................................................................................................................... 15
3.2        Drivers of Per Capita Expenditure .................................................................................................. 15
3.3        Per Capita Household Expenditure ................................................................................................ 16
3.4        Total Household Home Improvement and Homemaker Expenditure ............................................. 18
3.5        Total Resident Retail Expenditure .................................................................................................. 19
3.6        Home Improvement Turnover Attributable to Non-Household Sector ............................................ 20
3.6.1      Methodology ................................................................................................................................... 20
3.6.2      Total Home Improvement Market ................................................................................................... 21

4          Competitive Environment .............................................................................................................22
4.1        Home Improvement Precincts within the Main Trade Area ............................................................ 22
4.2        Sub Regional Shopping Centres .................................................................................................... 23
4.3        Supermarket Shopping Centres ..................................................................................................... 23
4.4        Town Centre retailing...................................................................................................................... 23

5          Masters Impact Analysis ...............................................................................................................25
5.1        Approach ........................................................................................................................................ 25
5.2        Key Assumptions ............................................................................................................................ 25
5.3        General Impacts ............................................................................................................................. 26
5.4        Employment and Other Benefits ..................................................................................................... 28

6          Demand for Additional Bulky Goods Retailing ..........................................................................30

7          Conclusion .....................................................................................................................................31

FIGURES:
Figure 1 – Subject Site and Proposed Rezoning ......................................................................................... iii
Figure 2 – Subject Site: View South From Hawkesbury Valley Way ............................................................ 5
Figure 3 – Proposed Masters and Bulky Goods, Clarendon: Main Trade Area ............................................ 8
Figure 4 – New Dwelling Approvals 1997-2011 ..........................................................................................16
Figure 5 – Home Improvement Retail Spend per Capita, 2012 ..................................................................17
Figure 6 – Retail Spend per Capita by Key Product Groups – Variation from Sydney Benchmark ............17
Figure 7 – Existing Retail Hierachy .............................................................................................................24

URBIS
ECONOMIC IMPACT ASSESSMENT FINAL REV C
TABLES:
Table 1 – Drive Time Analysis .......................................................................................................................7
Table 2 – Main Trade Area Population Forecast ........................................................................................ 11
Table 3 – Regional Population Trends by SLA 1991-2031 ........................................................................ 12
Table 4 – Key Drivers of Home Improvement Spending ............................................................................ 13
Table 5 – Key Socio Economic Characteristics .......................................................................................... 13
Table 6 – Urbis Real Per Capita Spend Growth Forecasts ........................................................................ 18
Table 7 – Main Trade Area Homemaker and Home Improvement Expenditure 2012 ............................... 18
Table 8 – Main Trade Area Hardware, Home Improvement & Homemaker Expenditure 2012-26 ............ 19
Table 9 – Total retail Spend by Category 2021-26 ..................................................................................... 20
Table 10 – Retail vs Wholesale – Home Improvement Categories ............................................................ 21
Table 11 – Total Trade Area Home Improvement Expenditure, 2013 ($M, EXCL GST) ........................... 21
Table 12 – Competitive Environment: Main Trade Area Home Improvement and Bulky Goods Retail ..... 22
Table 13 – Clarendon Masters Turnover and Market Share Forecast 2016 .............................................. 26
Table 14 – Clarendon Masters Impact on key Precincts / Centres ............................................................ 27

                                                                                                                                                URBIS
                                                                                                               ECONOMIC IMPACT ASSESSMENT FINAL REV C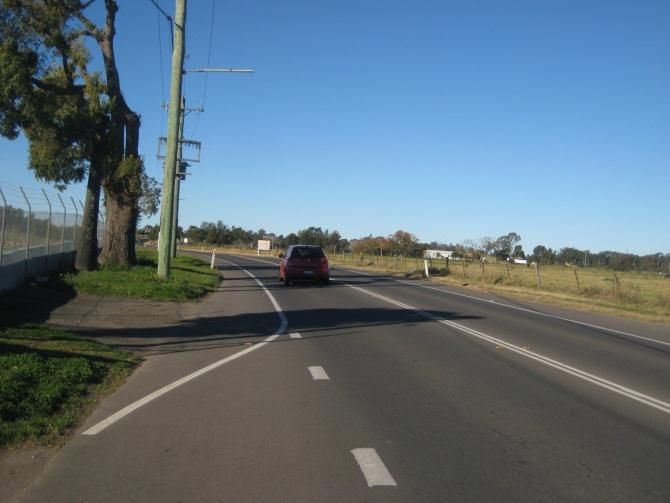
Executive Summary
This Economic Impact Assessment has been prepared on behalf of Hydrox Nominees Pty Ltd to provide
supporting economic analysis as part of a proposed amendment to the Hawkesbury Local Environmental
Plan 2012 (the LEP). The amendment would result in the inclusion of the B7 Business Park zone into the
Draft LEP at 120-188 Hawkesbury Valley Way to support the future development of a business park
within the Hawkesbury Local Government Area (LGA).
To secure funding and facilitate the development of the Clarendon Business Park, the Planning Proposal
includes a request for an amendment to Schedule 1 Additional Permitted Uses of the LEP to include a
small portion of the site to support „bulky goods premises‟. The land affected by the Schedule 1
amendment would support a future Masters home improvement store in the medium term, and additional
bulky goods tenancies in the longer term, subject to market demand. Through the delivery of these
developments, particularly the initial Masters, development funding for key infrastructure required to
service the development of land to the south of the railway line as a business park will be secured.
More specifically the purpose of this report is to:
Assess the potential competitive trading impacts of a new Masters home improvement store at the
subject site (assumed to commence trading in 2015) with an indicative size of 11,000 sq.m; and
Consider the potential market demand for additional bulky goods retailing at the subject site in the
longer term.
The subject site is located around 4km to the south of Richmond Town Centre and 2.5km to the north of
Windsor Town Centre and it benefits from a northern frontage to Hawkesbury Valley of approximately 900
metres.
The 2011 Census identified a population in the Main Trade Area of 69,750 in 2011 of which the Primary
Trade Area accounted for 38% with 26,370 residents. By 2016 the Main Trade Area population is
forecast to reach 73,920 persons, of which the Primary Trade Area will account for 37% with 27,670. By
2026 the Main Trade Area population is forecast to reach 84,680 persons, of which the Primary Trade
Area will account for 39% with 33,270.
Retail spending on Homemaker products in the Main Trade Area is estimated at $133.2m in 2012.
Spend on Home Improvement items (products predominantly stocked by Masters) is estimated at $87.9m
in 2012.
Future growth in the household home improvement market will be derived from population growth and
real growth in spending per capita. By 2015, home improvement spending in the Main Trade Area is
forecast to increase to $96.8 million, reflecting average annual growth of 3.3% per annum and a net
increase of $8.9m over the period. The total home improvement market available to the proposed
development is estimated at $142.7m in 2016, including $42.6m by the non-household market.
The introduction of a new Masters home improvement store into the market at 2015 will have some
limited trading impacts on home improvement precincts competing within the same markets. The
Masters store at Clarendon is expected to generate $24.8 million of turnover in its first full year of trading
(2016). The total impact on competing precincts within the vicinity of the MTA is $18.6m i.e. excluding
trade which will be drawn from further afield and from the Trades Sector.
The average impact of the development on the turnover of competing precincts that market will be around
-3.4% relative to what stores would have achieved. This -3.4% impact is the one-off impact on home
improvement sales that centres would otherwise have captured should the Masters store not be
developed.
Growth within the domestic Home Improvement market in the Main Trade Area between 2012-16 will
generate an additional $12.2m, with an additional $16.7m growth between 2016 and 2021 which would
absorb the impact of the proposed Masters. This excludes growth within the Trades Sector, which would
contribute further to demand for Home Improvement products, particularly if house building within the
Main Trade Area increases as forecast.
URBIS
ECONOMIC IMPACT ASSESSMENT FINAL REV C EXECUTIVE SUMMARY i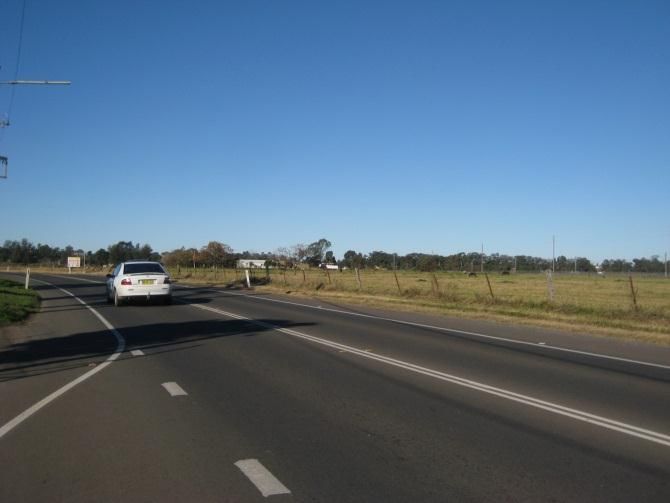
Overall, the increase in home improvement spending between 2012-2021 exceeds the projected turnover
of the new Masters store in its first year of trading which indicates that there is strong demand for a
development of this type within the MTA, and that initial trading impacts can be mitigated within a
relatively short period.
With the exception of the McGrath‟s Hill precinct, no precinct is forecast to exceed a 5% impact which
demonstrates that the impacts are within a manageable range and the Masters development should not
affect the ongoing viability of these precincts.
We note that relative to current 2012 trading levels, all identified centres with the exception of McGrath‟s
Hill will be trading at levels that are at or in excess of current levels by 2016.
In the case of McGrath‟s Hill, we note that a high proportion of the projected -$10.3m impacts are likely to
be directed towards a single operator – the existing Bunnings store – as Bunnings is obviously the main
direct competitor to Masters. In terms of impacts on the McGrath‟s Hill precinct as a whole we consider
that there are likely to be a number of factors which will contribute to its ongoing viability beyond 2016,
which include:
The fact that McGrath‟s Hill will continue to draw a substantial proportion of its trade from lands to the
south (e.g. Mulgrave, Vineyard, Riverstone, Box Hill) which are beyond the Main Trade Area for the
proposed Clarendon store. It is unlikely in our view that future residents from these areas will drive
past McGrath‟s Hill to shop at Clarendon, therefore this is a relatively secure and growing market.
Linked to the above, Vineyard, Riverstone and Box Hill are within the North West Growth Centre and
will experience major residential and commercial development beyond 2016 (approximately 21,500
dwellings and 62,000 new residents based on figures on the North West Growth Centre website).
This level of house building will generate significant sustained demand for hardware and home
improvement products from the residential and trades sectors.
The actions which existing retailers take will determine the eventual impact on each of them, and
furthermore the actions which they each take will also determine the eventual impact on the other
retailers involved. All of these factors need to be kept in mind when considering the likely impact of a
retailer within the existing retail network. Existing retailers are not passive participants, but rather will
play a major role in the eventual impact which they will experience. In this instance, and based on
the experience elsewhere in Australia, we assume that Bunnings and other key competitors will adapt
their strategy and marketing to position against increased competition in the marketplace, ultimately
befitting consumers through increased price competitiveness.
The proposed development is expected to provide positive employment impacts both locally and in the
broader economy. Masters have indicated that they expect around 180 direct jobs per store will be
created during construction as well as 130-150 operational jobs per store. Other benefits associated with
the proposed development include:
Increased competition within the home improvement sector which should result in greater choice and
price savings for customers;
Reduced travel times for Main Trade Area residents and trades workers seeking to access a range of
home improvement products and services and, accordingly, potential vehicle emission savings
(particularly from trades vehicles) by minimising the need for customers to travel greater distances to
make purchases; and
Increased expenditure retention within the Main Trade Area reducing the amount of expenditure that
is leaked to other LGAs.
In addition the provision of an additional 11000 sq.m of homemaker bulky goods retailing at the subject
site would equate to around 44% of the demand generate by growth in the homemaker spending market
over that period. Urbis considers that it would be reasonable to provide planning controls that allow for
this scale of development to occur over time. It would be important to ensure that the proponent provide
an economic impact assessment at the time of lodging any development application for additional bulky
goods floorspace to demonstrate the potential impact on existing retail precincts within the timescale
envisaged.
ii EXECUTIVE SUMMARY
URBIS
ECONOMIC IMPACT ASSESSMENT FINAL REV CIntroduction
This Economic Impact Assessment has been prepared on behalf of Hydrox Nominees Pty Ltd to provide
supporting economic analysis as part of a proposed amendment to the Hawkesbury Local Environmental
Plan 2012 (the LEP). The amendment would result in the inclusion of the B7 Business Park zone into the
Draft LEP at lands at 120-188 Hawkesbury Valley Way to support the future development of a business
park within the Hawkesbury Local Government Area (LGA).
To secure funding and facilitate the development of the Clarendon business park, the Planning Proposal
includes a request for an amendment to Schedule 1 Additional Permitted Uses of the LEP to include a
small portion of the site to support „bulky goods premises‟. The land affected by the Schedule 1
amendment would support a future Masters home improvement store in the medium term, and additional
bulky goods tenancies in the longer term, subject to market demand. Through the delivery of these
developments, particularly the initial Masters, development funding for key infrastructure required to
service the development of land to the south of the railway line as a business park will be secured.
More specifically the purpose of this report is to:
Assess the potential competitive trading impacts of a new Masters home improvement store at the
subject site (assumed to commence trading in 2015) with an indicative size of 11,000 sq.m; and
Consider the potential market demand for additional bulky goods retailing at the subject site in the
longer term.
The report is structured as follows:
Section 1 considers the nature of the proposed development;
Section 2 examines the market for home improvement retail within the trade area identified for the
proposed development;
Section 3 provides an assessment of available expenditure for home improvements within the
domestic household and trades sectors;
Section 4 examines existing retail provision within the trade area, both in terms of home
improvement stores and precincts and broader „traditional‟ retailing;
Section 5 sets out the economic impacts associated with the proposed Masters development,
considering trading impacts on precincts and centres as well as employment generation. It also
considers the demand for additional bulky goods floorspace having regard to growth in the spending
market over time.
URBIS
ECONOMIC IMPACT ASSESSMENT FINAL REV C INTRODUCTION 11 Nature of Use and Product Range
1.1 PROPOSED REZONING
The Planning Proposal seeks to amend the recently gazetted Hawkesbury Local Environmental Plan
2012 (the LEP) to zone part of the subject site B7 Business Park to allow the site to be redeveloped as a
business park with land to the north of the Richmond Rail Line (fronting Hawkesbury Valley Way) to be
developed to provide the first Masters home improvement store within the LGA with the potential for
additional bulky goods development on the site subject to market demand.
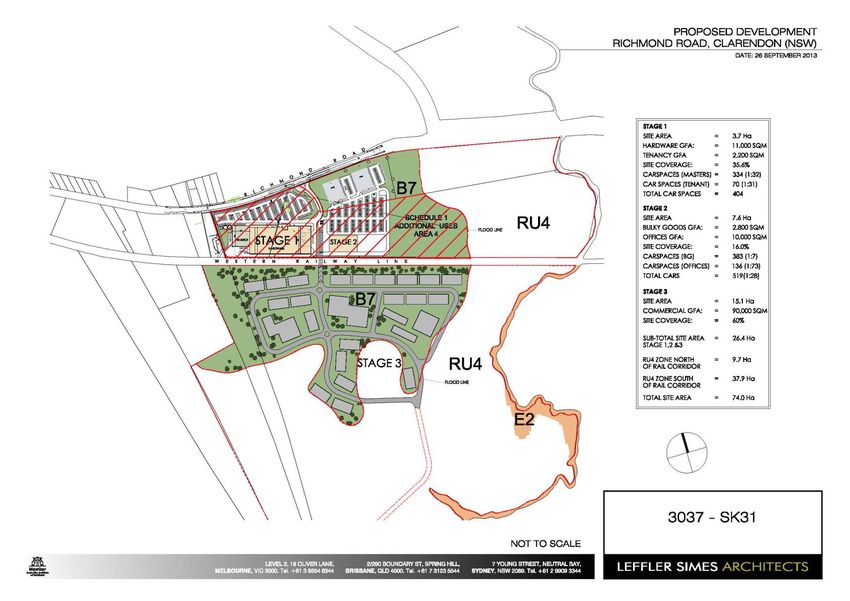
The subject site, proposed rezoning and indicative development concept is shown in Figure 1
2 NATURE OF USE AND PRODUCT RANGE
URBIS
ECONOMIC IMPACT ASSESSMENT FINAL REV CFIGURE 1 – SUBJECT SITE AND PROPOSED REZONING URBIS ECONOMIC IMPACT ASSESSMENT FINAL REV C NATURE OF USE AND PRODUCT RANGE 3
1.2 THE MASTERS CONCEPT
The „Masters‟ concept is to provide a home improvement centre (General Sales, Trade Supplies, and
Landscape Gardening Supplies), within a clean and air-conditioned retail environment. The typical layout
will consist of a total floor area of approximately 13,800 sq.m with associated car parking. Generally a
regular shaped site of approximately 3.7 hectares is required to support the building, loading and car
parking facilities. In this instance a smaller Masters store is envisaged for the site which would not
exceed 11000 sq.m.
Masters is a joint venture between Woolworths Limited and Lowes Companies Incorporated. Woolworths
are Australia‟s largest retailer and private sector employer, employing over 191,000 people. Lowes is the
second largest home improvement retailer in the world and has over 1,700 stores across the USA and
Canada.
The Woolworths/Lowe‟s vision is to enhance choice for Australian (retail and trade) consumers with
increased competition in the destination home improvement sector, improved product range representing
value and choice and a fresh new offer.
In terms of capital value, each store has an estimated investment/construction value of approximately $15
million - $20 million, excluding land acquisition costs.
The Masters store will focus on providing hardware and garden goods, as well as a smaller component of
home improvement products.
1.2.1 SITE DEVELOPMENT CONCEPT
The preliminary development concept for the site envisages:
A new Masters home improvement store on the northern part of the site fronting the Hawkesbury
Valley Way;
Provision for additional bulky goods retailing to be located adjacent to the Masters building;
A new access to the Hawkesbury Valley Way linking to a proposed new road bridge over the Western
Railway Line; and
The proposed new road bridge would form a future connection to lands to the south of the Western
Railway line which would be developed as a business park in the longer term, subject to market
demand.
1.3 SUBJECT SITE
The subject site is located at 120-188 (also known as Richmond Road), Clarendon. The site is legally
described as Lot 1, 2 and 3 Deposited Plan 700263, Lot C Deposited Plan 160847, Lot F Deposited Plan
164199 and Lot 2 in Deposited Plan 629053 and has a total site area of approximately 74 hectares.
The site is located around 4km to the south of Richmond town Centre and 2.5km to the north of Windsor
town centre.
Key characteristics of the site include:
A northern frontage to Hawkesbury Valley of approximately 900 metres;
Eastern and southern boundary defined by Rickabys Creek;
The site is located on the southern side of Hawkesbury Valley Way and bisected by the Richmond
Railway Line;
The portion of the site to the north of the railway line in generally cleared land, with a small dam and a
property known as „Elfdale Stud‟, which consists of several dilapidated rural buildings;
4 NATURE OF USE AND PRODUCT RANGE
URBIS
ECONOMIC IMPACT ASSESSMENT FINAL REV C To the south of the railway line the land is similarly cleared, with a large dam towards to south
western corner;
Topography of the site slopes away from Hawkesbury Valley Way to the east and south towards
Rickabys Creek.
The site generally cleared and contains limited environmental constraints impeding redevelopment.
FIGURE 2 – SUBJECT SITE: VIEW SOUTH FROM HAWKESBURY VALLEY WAY
1.4 SURROUNDING LAND USE CONTEXT
Key surrounding land uses include:
The site is bordered by Hawkesbury Valley Way to the north, which is the principal collector road
between Windsor and Richmond;
The Richmond RAAF base is directly north of the site, on the opposite side of Hawkesbury Valley
Way;
Windsor Country Golf Club is situated on the eastern side of Rickabys Creek, and provides a
recreational space between the subject site and residential area further east;
Headstart Early Learning child care centre to the west fronting Hawkesbury Valley Way;
Hawkesbury Race Course and Showground to the west which includes stable and horse training
facilities along the western site boundary;
Land to the immediate south is largely cleared open land with residential areas of South Windsor
located further to the south east;
Some commercial and rural residential land uses are located to the west with the Hawkesbury Race
Course and Showgrounds further to the west;
The main town centres and residential precincts within proximity to the site are located 3km east in
Windsor and over 3km west at Richmond;
Clarendon Train Station is situated approximately 450 metres west of the site.
URBIS
ECONOMIC IMPACT ASSESSMENT FINAL REV C NATURE OF USE AND PRODUCT RANGE 52 Trade Area Analysis
The Trade Area refers to the area in which an existing or proposed centre or retailer is most likely to draw
custom. The size and scale of trade areas vary due to the geographical context of the retail development
in question. Other factors which may define a trade area include:
The strength, range and appeal of the subject site;
The proximity, composition and quality of competing retail facilities;
The accessibility of the site including the road and transport network, as well as access to ample
parking; and
Physical barriers such as freeways, rivers/lakes, bushland and drive times.
In defining a trade area for Masters and Bulky Goods development at the subject site, SA1 statistical
areas have been combined to form the following areas:
A Primary Trade Area (PTA) which is quite small geographically, taking in the suburbs of Richmond,
North Richmond, Windsor and South Windsor. The PTA is generally bounded by the Hawkesbury
River to the north, by The Driftway road to the south east and by the edge of the Windsor urban area
to the South East.
A Secondary North Trade Area (SNTA) extending along the Bells Line of Road as far as Mount
Tomah in the Blue Mountains; along Putty Road as far as Colo Heights; north east along Wiseman‟s
Ferry Road as far as Wiseman‟s Ferry and Maroota; and taking in South Maroota and Cattai.
A Secondary East Trade Area (SETA) to the south east of Windsor, taking in McGrath‟s Hill and Pitt
Town.
A Secondary South Trade Area (SSTA) taking in the suburb of Windsor Downs as well as lands
between Castlereagh and Londonderry where there is some overlap with the Primary Trade Area for
the Proposed Nepean Green Masters store.
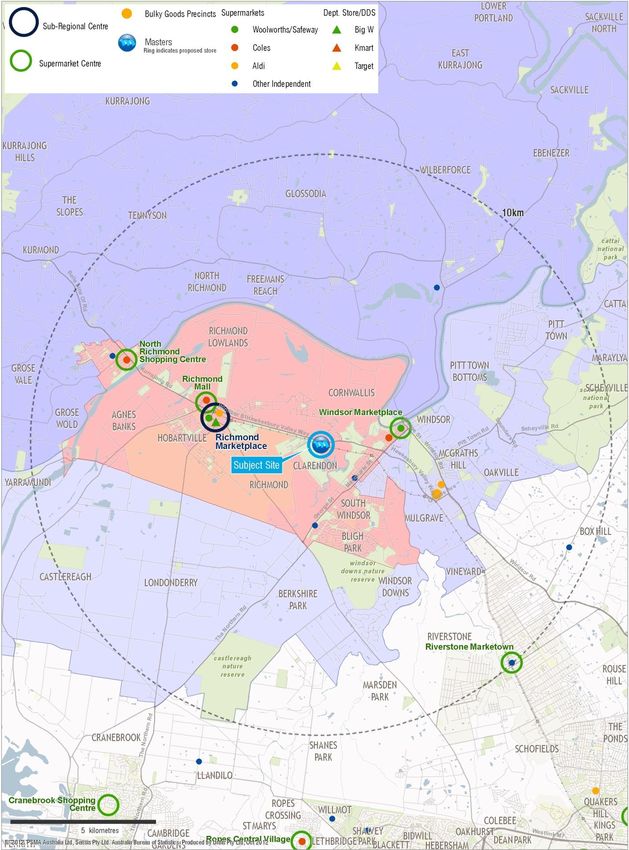
The Primary and Secondary Trade Areas combine to form a Main Trade Area (MTA) as shown in
Figure 3.
The approximate drive times from each suburb to the subject site are presented in Table 1, below. The
table demonstrates that the subject site is highly accessible as the vast majority of suburbs are within 25
minutes‟ drive time of the site with the exception of outlying areas on the edge of the Secondary North
Trade Area.
6 TRADE AREA ANALYSIS
URBIS
ECONOMIC IMPACT ASSESSMENT FINAL REV CTABLE 1 – DRIVE TIME ANALYSIS
Drive Time Analysis
CLARENDON MASTERS
Time / Distance to Subject Site
Suburb (mins) (km)
Primary Trade Area
Windsor 3 2
South Windsor 4 3
Richmond Town Centre 4 4
North Richmond 10 8
Secondary North Trade Area
Wilberforce 13 9
Kurrajong 18 15
South Maroota 24 25
Colo 26 26
Maroota 32 33
Colo Heights 38 41
Wiseman's Ferry 43 44
Mount Tomah 45 42
Secondary East Trade Area
McGrath Hill's 7 6
Vineyard (Braddon Road) 9 9
Pitt Town 11 9
Maralaylya 17 14
Cattaii 17 15
Secondary South Trade Area
Windsor Downs 11 8
Northern Road / Londonderry Road 15 13
Castlereagh 18 17
Source : Google Maps
URBIS
ECONOMIC IMPACT ASSESSMENT FINAL REV C TRADE AREA ANALYSIS 7FIGURE 3 – PROPOSED MASTERS AND BULKY GOODS, CLARENDON: MAIN TRADE AREA
8 TRADE AREA ANALYSIS
URBIS
ECONOMIC IMPACT ASSESSMENT FINAL REV C2.1 TRADE AREA POPULATION
Using the trade area defined above we can determine the current population and forecast expected
growth within the region. Urbis has prepared population forecasts for the proposed trade areas taking
into account the following sources:
Information from the 1991, 1996, 2001, 2006 and 2011 Census of Population and Housing;
New Dwelling Approvals (NDAs) in the region over the ten years to September 2011;
Official population projections published in April 2010 by the New South Wales Department of
Planning as well as the NSW Draft Subregional Strategy;
Population forecasts by Travel Zone area published by the NSW Government‟s Transport Data
Centre;
The NSWG Metropolitan Development Programme (MDP) Report;
Information on planning approvals and construction activity from Cordell Connect; and
Housing growth targets set out in the Hawkesbury Residential Land Strategy (May 2011).
The 2011 population estimate and preliminary forecast to 2031 for the Main Trade Area (MTA) is shown
in Table 2. The population forecast is based on the latest 2011 ABS census data.
Table 2 shows that the 2011 Census identified a population in the Main Trade Area of 69,750 in 2011 of
which the Primary Trade Area accounted for 38% with 26,370 residents. Overall the figures indicate that
the Main Trade Area will experience population growth of around 1.2% per annum between 2012-21
ramping up to 1.5% per annum between 2021-26 and 1.8% per annum between 2026-31.
By 2016 the Main Trade Area population is forecast to reach 73,920 persons, of which the Primary
Trade Area will account for 37% with 27,670;
By 2021 the Main Trade Area population is forecast to reach 78,500 persons, of which the Primary
Trade Area will account for 38% with 29,950;
By 2026 the Main Trade Area population is forecast to reach 84,680 persons, of which the Primary
Trade Area will account for 39% with 33,270;
By 2031 the Main Trade Area population is forecast to reach 92,370 persons, of which the Primary
Trade Area will account for 41% with 38,160.
The population forecast assumes a gradual concentration of population growth around the existing urban
areas of Richmond, North Windsor, Windsor, South Windsor / Bligh Park and Pitt Town which are within
the Primary and Secondary East Trade Areas. This is consistent with the intent of the Hawkesbury
Residential Land Strategy which make provision for 5,000 to 6,000 new dwellings within the LGA by 2031
to be concentrated around existing settlements.
Across the Main Trade Area, the forecast population increase of 22,620 people between 2031 and 2011
would equate to around 8,000 new dwellings over the period (based on an average household size of 2.8
persons per dwelling) which would also allow for future growth in the Secondary South Trade Area within
the Penrith LGA and some limited residential development in the northern part of the Baulkham Hills LGA.
This level of population growth would equate to around 400 dwellings annually in the Main Trade Area
overall between 2011-2031. This level of residential construction activity has been achieved in the past
around 1998-2003. Given Hawkesbury Council‟s housing growth targets we assume that there will be
sufficient zoned land and infrastructure provision to enable this rate of growth over the long term. The
continued development of land within the North West Growth Centre may also provide a renewed focus
for developer activity around Windsor and Richmond, particularly once major development commences
around Vineyard.
URBIS
ECONOMIC IMPACT ASSESSMENT FINAL REV C TRADE AREA ANALYSIS 9We note that there is currently a proposal for 1,400 – 1,500 new dwellings at 108 Grose Vale Road, North
Richmond which is located on the edge of the Primary and Secondary North Trade Area. The planning
controls for the site need to be amended to enable a development application to be lodged, however if
approved this proposal could contribute to housing and population growth in the medium term.
Our population forecast for the Main Trade Area equates to around 41% of the Department of Planning &
Industry population forecast for the SLAs covering the Main Trade Area (as shown in Table 3). SLAs that
cover the Main Trade Area include Hawkesbury, Hornsby North, Penrith East, Penrith West and The Hills
Shire North. The majority of the Main Trade Area is covered by the Hawkesbury SLA and the population
forecast assumes that the vast majority of growth would occur within existing urban settlements within the
Hawkesbury SLA. We note that if Hawkesbury Council‟s housing targets are not achieved by 2031 this
may reduce population growth rates within the Main Trade Area.
10 TRADE AREA ANALYSIS
URBIS
ECONOMIC IMPACT ASSESSMENT FINAL REV CTABLE 2 – MAIN TRADE AREA POPULATION FORECAST
Trade Area Population
CLARENDON MASTERS & BULKY GOODS, 2001-2031
Trade Area Estimated Residential Population1 Forecast Population
Sector 2001 2006 2011 2012 2016 2021 2026 2031
Primary Trade Area
Primary Trade Area 25,980 25,070 26,370 26,630 27,670 29,950 33,270 38,160
Secondary Trade Area
• Secondary North 24,690 25,020 26,850 27,220 28,700 29,550 30,630 31,930
• Secondary East 7,800 7,710 8,090 8,200 8,610 9,520 10,730 11,540
• Secondary South 7,220 8,100 8,440 8,540 8,940 9,480 10,050 10,740
Total Secondary 39,710 40,830 43,380 43,960 46,250 48,550 51,410 54,210
Main Trade Area 65,690 65,900 69,750 70,590 73,920 78,500 84,680 92,370
Average Annual Change (No.)
2001-06 2006-11 2011-12 2012-16 2016-21 2021-26 2026-31
Primary Trade Area -182 260 260 260 456 664 978
Secondary Trade Area
• Secondary North 66 366 370 370 170 216 260
• Secondary East -18 76 110 103 182 242 162
• Secondary South 176 68 100 100 108 114 138
Total Secondary 224 510 580 573 460 572 560
Main Trade Area 42 770 840 833 916 1,236 1,538
Average Annual Change (%)
2001-06 2006-11 2011-12 2012-16 2016-21 2021-26 2026-31
Primary Trade Area -0.7% 1.0% 1.0% 1.0% 1.6% 2.1% 2.8%
Secondary Trade Area
• Secondary North 0.3% 1.4% 1.4% 1.3% 0.6% 0.7% 0.8%
• Secondary East -0.2% 1.0% 1.4% 1.2% 2.0% 2.4% 1.5%
• Secondary South 2.3% 0.8% 1.2% 1.2% 1.2% 1.2% 1.3%
Total Secondary 0.6% 1.2% 1.3% 1.3% 1.0% 1.2% 1.1%
Main Trade Area 0.1% 1.1% 1.2% 1.2% 1.2% 1.5% 1.8%
1. As at June.
Source : ABS Cdata 1991, 1996, 2001,2006 and 2011; ABS, Regional Population Growth, Australia 2010-2011 (3218.0);
DP&I, BTS, ABS; Urbis
URBIS
ECONOMIC IMPACT ASSESSMENT FINAL REV C TRADE AREA ANALYSIS 11TABLE 3 – REGIONAL POPULATION TRENDS BY SLA 1991-2031
Region Population Trends
CLARENDON MASTERS REGION BY SLA, 2001-2031
Statistical Local Estimated Residential Population1 Forecast Population
Area 2001 2006 2011 2016 2021 2026 2031
Hawkesbury (C) 62,810 62,110 64,310 66,891 71,462 77,494 85,642
Hornsby (A) - North 68,440 67,640 70,260 71,009 72,244 73,260 74,644
Penrith (C) - East 97,330 95,960 102,180 109,242 114,569 119,204 124,148
Penrith (C) - West 80,090 81,200 85,910 93,774 98,706 103,039 107,635
The Hills Shire (A) - North 38,940 52,500 59,300 72,216 88,866 105,749 114,182
Total Region 347,610 359,410 381,960 413,133 445,846 478,747 506,251
Average Annual Change (No.)
1996-01 2001-06 2006-11 2011-16 2016-21 2021-26 2026-31
Hawkesbury (C) 746 -140 440 516 914 1,206 1,630
Hornsby (A) - North 948 -160 524 150 247 203 277
Penrith (C) - East 64 -274 1,244 1,412 1,065 927 989
Penrith (C) - West 1,846 222 942 1,573 986 867 919
The Hills Shire (A) - North 2,746 2,712 1,360 2,583 3,330 3,377 1,686
Total Region 6,350 2,360 4,510 6,235 6,543 6,580 5,501
Average Annual Change (%)
1996-01 2001-06 2006-11 2011-16 2016-21 2021-26 2026-31
Hawkesbury (C) 1.2% -0.2% 0.7% 0.8% 1.3% 1.6% 2.0%
Hornsby (A) - North 1.4% -0.2% 0.8% 0.2% 0.3% 0.3% 0.4%
Penrith (C) - East 0.1% -0.3% 1.3% 1.3% 1.0% 0.8% 0.8%
Penrith (C) - West 2.5% 0.3% 1.1% 1.8% 1.0% 0.9% 0.9%
The Hills Shire (A) - North 9.1% 6.2% 2.5% 4.0% 4.2% 3.5% 1.5%
Total Region 1.9% 0.7% 1.2% 1.6% 1.5% 1.4% 1.1%
1. as at June
Source : ABS Cdata 1991, 1996, 2001, 2006 & 2011; ABS, Regional Population Growth, Australia 2010-2011 (3218.0);
DP&I, BTS, ABS; Urbis
2.2 DEMOGRAPHIC CHARACTERISTICS
In relation to the home improvement spending, the key characteristics which tend to influence per capita
spending are detailed in Table 4. All of these characteristics, with the exception of “Renter Occupied
Households” are shown to have a positive effect on per capita spending on Hardware/Garden,
Furniture/Floor Coverings and Bulky Goods products.
12 TRADE AREA ANALYSIS
URBIS
ECONOMIC IMPACT ASSESSMENT FINAL REV CTABLE 4 – KEY DRIVERS OF HOME IMPROVEMENT SPENDING
Effect on Spending
Drivers Hardware / Garden Furniture / Floor Covering Bulky Goods
Average Household Income + +
Household Income > >$78,000
$88,400 + +
White Collar Workers + +
Home Ownership +
Home Renters - -
Detached Dwellings +
2+ Cars +
Source : MDS Marketinfo; Urbis
Table 5 summarises the key socio-economic characteristics for the trade area. These key characteristics
are based on usual resident data from the 2006 Census of Population and Housing and are compared
with Sydney averages.
TABLE 5 – KEY SOCIO ECONOMIC CHARACTERISTICS
Key Socio-Economic Characteristics
CLARENDON MASTERS TRADE AREA, 2011
Primary Main Sydney
Modify table as
Characteristics TA TA Average
Average Income Per Capita (aged 15-64) 41,060 43,353 48,077
Variation from Sydney Avg -15% -10% +0%
Income Above $78,000 (% of Population) 11.0% 13.5% 18.8%
Owner/Purchaser Occupied Households (% of Hhold) 59.8% 73.6% 66.8%
Car Ownership (% of Household) 91.9% 95.2% 87.5%
Ownership of two or more cars (% household) 52.3% 66.9% 47.9%
Family Households with Children Under 15 31.5% 33.1% 29.1%
Average Household Size 2.56 2.82 2.69
Aged 65+ Years (% of Population) 12.5% 11.3% 12.9%
Average Age 35.7 36.0 37.1
Australian Born (% of Population) 86.3% 86.5% 63.7%
1. Managers & Administrators, Professionals, Para Professionals, Clerks and Sales & Personal Services Workers
Source : ABS Census of Population and Housing 2011; Urbis
Table 5 indicates that:
The proportion of owner / purchaser households in the Main Trade Area overall is above the Sydney
Average;
There is a high incidence of car ownership across the Primary and Main Trade Area, both car
ownership and households with two or more cars being above the Sydney average;
There is a higher incidence of family households with children under 15 in the Primary and Main
Trade Areas than the Sydney average, and the average household size is above the Sydney
average;
Income per capita is -15% below the Sydney average in the primary Trade Area and -10% below
average across the Main Trade Area as a whole;
URBIS
ECONOMIC IMPACT ASSESSMENT FINAL REV C TRADE AREA ANALYSIS 13 The proportion of households with income above $78,000 is lower than the Sydney average in both
the Primary and Main Trade Area.
Overall the socio economic profile of the Main Trade Area contains a significant proportion of family
owner / purchaser households with a highly mobile (and car dependent) population. Typically these types
of households are keen renovators, adapting dwellings as family circumstances change over time, and
being car dependent they respond well to the accessible and convenient large store format of Masters.
As income levels are below the Sydney average, residents are also likely to respond positively to
increased competition within the home improvement retail market.
14 TRADE AREA ANALYSIS
URBIS
ECONOMIC IMPACT ASSESSMENT FINAL REV C3 Trade Area Household Expenditure
The “home improvement” market defined in this statement reflects the spending market available to the
proposed Masters store. The home improvement market is derived from two key segments, namely
“hardware/garden” and “other home improvement”. The sum of these markets forms the basis for the
Main Trade Area spending analysis and the store turnover and impact assessment presented in this
statement.
This section focuses on home improvement spending generated from the household or resident sector.
An analysis of store turnover likely to be derived from the non-household sector is presented in
Section 3.3.
3.1 METHODOLOGY
The retail spending estimates outlined below are derived using MarketInfo, a micro-simulation model
developed by MDS Market Data Systems Pty Ltd and now widely used throughout the retail consultancy
and retail network strategy industries. This model is based on information from the ABS‟ Household
Expenditure Survey (HES) and the Census of Population of Housing (2011), as well as other information
sources that provide up-to-date information about changes in spending behaviour and/or income levels
(i.e. ABS National Accounts, Australian Taxation Statistics, etc.).
The model uses micro-simulation techniques to combine propensity to spend on particular commodities
with the socio-economic characteristics of individuals to derive spending per capita estimates on a small
area basis (i.e. the Census SA1 statistical areas).
The key MarketInfo spending categories which are relevant to the home improvement market are
Hardware/Garden, Home Decoration, Furniture, Floor Coverings, Whitegoods, and Recreational
Equipment. These categories are groupings of individual HES categories which are likely to be sold in a
Masters store. For example, hardware/garden is a broad category that includes lawnmowers, hand and
power tools, plants, nails, etc.
The hardware/garden market is expected to make up the majority of sales in the proposed Masters
development with the other spending categories identified making up the remainder of the home
improvement market.
It should be noted that retail expenditure estimates throughout the report exclude the component of
turnover attributable to goods and services tax (GST), and all values are expressed in 2012 dollar terms
(i.e. inflation is not included in expenditure forecasts).
3.2 DRIVERS OF PER CAPITA EXPENDITURE
As shown in Table 4 earlier, socio-economic characteristics have some effect on the propensity of trade
area residents to spend on home improvement goods. In addition to these demographic drivers, home
improvement spending is also broadly driven by residential building activity. The key indicators of building
activity include:
New Dwelling Approvals, which are published by the ABS. The number of NDAs within the Main
Trade Area in recent years is detailed in Figure 4 below. This shows that NDA activity in the MTA
averaged 400 dwellings approvals per annum between 1997-2004 before falling sharply. In the last
two years new dwelling approvals have begun to climb back from lows during the GFC. New dwelling
approval rates will need to climb back sharply to the 1997-2004 average rate in order to achieve the
Hawkesbury Council and NSW Government population forecasts for the Main Trade Area as set out
in Table 2.
These indicators would not only influence household spending on home improvement goods, but would
also be indicative of the trade-related market available to home improvement stores.
URBIS
ECONOMIC IMPACT ASSESSMENT FINAL REV C TRADE AREA HOUSEHOLD EXPENDITURE 15FIGURE 4 – NEW DWELLING APPROVALS 1997-2011
New Dwelling Approvals
CLARENDON MASTERS S TRADE AREA, 1997-2011
600
500
400
300
200
100
0
1997 1998 1999 2000 2001 2002 2003 2004 2005 2006 2007 2008 2009 2010 2011
Primary SNTA SETA SSTA Total Main
Share of New Dwelling Approvals in Trade Area Sector
120%
100%
80%
60%
40%
20%
0%
1997 1998 1999 2000 2001 2002 2003 2004 2005 2006 2007 2008 2009 2010 2011
Primary SNTA SETA SSTA Total Main
Source : ABS, Building Approvals, Australia (8731.0); Urbis
3.3 PER CAPITA HOUSEHOLD EXPENDITURE
Figure 5 demonstrates that retail spending per household on Home Improvement products is -5% below
the Sydney Average in the Primary Trade Area, but +5% above the Sydney Average in the Main Trade
Area overall.
16 TRADE AREA HOUSEHOLD EXPENDITURE
URBIS
ECONOMIC IMPACT ASSESSMENT FINAL REV CFIGURE 5 – HOME IMPROVEMENT RETAIL SPEND PER CAPITA, 2012
Home Improvement Retail Spend Per Capita
CLARENDON MASTERS TRADE AREA ($2012, EX. GST)
Retail Spend Per Capita ($) Var'n From Sydney Average (%)
1,400 1,252 6% +5%
1,137 1,192
1,200
4%
1,000
2%
800
0%
600
400 -2%
200 -4%
0 -6% -5%
PTA MTA Sydney PTA MTA
Source: MDS, MarketInfo 2010; ABS, Australian National Accounts: National Income, Expenditure and Product Accounts (5206.0); Urbis
Figure 6 demonstrates that spending in most key product categories is below the Sydney average across
the Main Trade Area, with the exception of Food Retail (+1%) and bulky goods (+8%)
FIGURE 6 – RETAIL SPEND PER CAPITA BY KEY PRODUCT GROUPS – VARIATION FROM SYDNEY BENCHMARK
Retail Spending Per Capita Var'n From Sydney B'mark, 2012
CLARENDON MASTERS MAIN TRADE AREA ($2012, EX. GST)
10% +8%
5%
+1%
0%
-5%
-4%
-6%
-10% -8%
-15% -13% -13%
Food Retail Food Catering Apparel Homewares Bulky Goods Gen./Leisure Services
Source: MDS, MarketInfo 2010; ABS, Australian National Accounts: National Income, Expenditure and Product Accounts (5206.0); Urbis
Future growth in per capita spending is based on Urbis‟ latest projections by product category. Forecast
growth rates for NSW are summarised in Table 6 and reflect “real” growth in spending per capita (i.e.
excluding the effects of population growth and inflation). The forecasts are based on the latest Australian
National Accounts data and anticipated future growth trends in each category.
URBIS
ECONOMIC IMPACT ASSESSMENT FINAL REV C TRADE AREA HOUSEHOLD EXPENDITURE 17TABLE 6 – URBIS REAL PER CAPITA SPEND GROWTH FORECASTS
Urbis Retail Per Capita Spend Forecast 1
CLARENDON MASTERS
Home Improvement Spend Category Product Group 2012 2013 2014 2015 2016+
Hardware
Hardware, garden Bulky Goods -1.7% 0.3% 3.1% 2.5% 2.2%
Other Home Improvement
Home decoration Homewares -1.3% 0.5% 4.4% 3.6% 3.0%
Furniture, floor coverings, whitegoods Bulky Goods -1.7% 0.3% 3.1% 2.5% 2.2%
Recreational equipment General -1.5% 0.4% 3.4% 2.8% 2.4%
1. Excluding inflation and population growth
Source : Urbis
3.4 TOTAL HOUSEHOLD HOME IMPROVEMENT AND HOMEMAKER
EXPENDITURE
Table 7 shows that retail spending on Homemaker products in the Main Trade Area is estimated at
$133.2m in 2012. Spend on Home Improvement items (products predominantly stocked by Masters and
shown in blue in Table 7) is estimated at $87.9m in 2012.
TABLE 7 – MAIN TRADE AREA HOMEMAKER AND HOME IMPROVEMENT EXPENDITURE 2012
Hardware, Home Improvement & Homemaker Expenditure
CLARENDON MASTERS 2012 (Excl GST)
Secondary Trade Area
Primary North East South Secondary Main TA
Hardware, garden 8.1 11.6 3.0 2.9 17.6 25.7
Home Decoration 1.9 2.6 0.7 0.7 4.0 5.9
Home Entertainment Equipment 6.3 7.1 2.0 1.9 11.1 17.4
Computer Hardware & Software 3.2 3.9 1.1 1.0 5.9 9.1
Communications 1.0 0.9 0.3 0.3 1.5 2.5
Small Appliances 2.5 3.2 0.9 0.9 5.0 7.5
Manchester 2.9 3.8 1.0 1.1 5.9 8.9
Furniture 7.6 9.0 2.4 2.1 13.5 21.1
Floor Coverings 3.1 4.0 1.1 1.1 6.2 9.3
Whitegoods 7.3 8.1 2.2 1.8 12.1 19.4
Recreational Equipment 2.1 3.0 0.7 0.7 4.5 6.6
Total Home Improvement Market 30.1 38.4 10.1 9.3 57.7 87.9
Total Homemaker Market 46.1 57.4 15.4 14.3 87.1 133.2
Source: MDS, MarketInfo 2010; ABS, Australian National Accounts: National Income, Expenditure and Product Accounts (5206.0); Urbis
Blue text denotes key Masters Home Improvement spending Categories
Future growth in the household home improvement market will be derived from population growth and
real growth in spending per capita as outlined above.
By 2015, home improvement spending in the Main Trade Area is forecast to increase to $96.8 million,
reflecting average annual growth of 3.3% per annum and a net increase of $8.9m over the period. (Refer
Table 8, below).
18 TRADE AREA HOUSEHOLD EXPENDITURE
URBIS
ECONOMIC IMPACT ASSESSMENT FINAL REV CHomemaker spending in the Main Trade Area is forecast to increase to $147.7m by 2015 reflecting
average annual growth of 3.5% per annum and a net increase of $14.5m over the period. (Refer Table 8,
below).
TABLE 8 – MAIN TRADE AREA HARDWARE, HOME IMPROVEMENT & HOMEMAKER EXPENDITURE 2012-26
MTA Hardware, Home Improvement & Homemaker Expenditure 2012-26
MASTERS CLARENDON TRADE AREA ($2012 Excl GST)
1
Hardware Market ($M) Other HI Market ($M) Total HI Market ($M) Total Homemaker ($M)2
Year PTA MTA PTA MTA PTA MTA PTA MTA
2012 8.1 25.7 22.0 62.2 30.1 87.9 46.1 133.2
2013 8.2 26.1 22.3 63.1 30.5 89.2 46.7 135.3
2014 8.6 27.2 23.2 65.9 31.8 93.2 48.8 141.8
2015 8.9 28.3 24.1 68.5 33.0 96.8 50.8 147.7
2016 9.2 29.2 24.9 70.9 34.0 100.1 52.6 153.2
2017 9.4 30.1 25.7 73.1 35.1 103.2 54.6 159.1
2018 9.8 31.0 26.6 75.5 36.4 106.5 57.0 165.2
2019 10.1 31.9 27.6 77.9 37.7 109.8 59.4 171.6
2020 10.5 32.9 28.6 80.4 39.0 113.3 62.0 178.2
2021 10.8 33.8 29.6 83.0 40.4 116.8 64.6 185.1
2022 11.2 34.9 30.8 85.8 42.0 120.7 67.6 192.6
2023 11.7 36.0 32.1 88.9 43.8 124.9 71.0 200.7
2024 12.1 37.2 33.4 92.0 45.6 129.2 74.5 209.2
2025 12.6 38.4 34.8 95.3 47.4 133.7 78.1 218.0
2026 13.1 39.7 36.2 98.6 49.4 138.3 81.9 227.1
Spending Growth 2012-2015 ($m)
2012-15 0.7 2.6 2.1 6.4 2.8 8.9 4.7 14.6
2012-21 2.7 8.1 7.6 20.8 10.3 29.0 18.6 51.9
Average Annual Growth
2012-15 3.0% 3.2% 3.1% 3.3% 3.0% 3.3% 3.3% 3.5%
2012-16 3.0% 3.3% 3.1% 3.3% 3.1% 3.3% 3.4% 3.6%
2016-21 3.4% 3.0% 3.6% 3.2% 3.5% 3.1% 4.2% 3.8%
1. Home Improvement includes hardware & garden, home décor, furniture, floor coverings, white goods, recreation equipment
2. Total Homemaker includes Home Improvement plus home entertainment equipment, computer hardware & software, communications, small appliances, manchester
Source: MDS, MarketInfo 2010; ABS, Australian National Accounts: National Income, Expenditure and Product Accounts (5206.0); Urbis
3.5 TOTAL RESIDENT RETAIL EXPENDITURE
Total retail spending within the Main Trade Area is shown in Table 9, below. This demonstrates that
there is approximately $790m (rounded) available retail expenditure from Main Trade Area residents, and
this is forecast to increase to $838m (rounded) by 2015, to $962m (rounded) by 2021 and $1.1bn by
2026.
URBIS
ECONOMIC IMPACT ASSESSMENT FINAL REV C TRADE AREA HOUSEHOLD EXPENDITURE 19TABLE 9 – TOTAL RETAIL SPEND BY CATEGORY 2021-26
Total Retail Spending by Category, 2012-2026 MTA
CLARENDON MASTERS TRADE AREA ($2012 MILLION, EX. GST)
Total Food Total Non-Food Total Retail
Year $M $M $M
2012 460.0 330.8 790.8
2013 464.2 334.8 799.0
2014 471.0 348.3 819.3
2015 477.4 360.3 837.7
2016 483.6 371.3 854.9
2017 491.4 382.6 874.0
2018 500.3 395.1 895.3
2019 509.3 407.8 917.1
2020 518.4 421.0 939.4
2021 527.6 434.6 962.2
2022 537.9 449.5 987.4
2023 549.4 465.7 1,015.1
2024 561.0 482.5 1,043.5
2025 572.8 499.7 1,072.5
2026 584.6 517.6 1,102.2
1
Average Annual Growth
2012-16 1.3% 2.9% 2.0%
2016-21 1.8% 3.2% 2.4%
2021-26 2.1% 3.6% 2.8%
1. Assumes per cap growth of 0.2% in 2013, 1.8% in 2014, 1.5% in 2015, 1.3% in 2016, & 1.1% thereafter, with different rates for each product group.
2. Current year is financial year ; Forecast years are financial years
Source: MDS, MarketInfo 2010; ABS, Australian National Accounts: National Income, Expenditure and Product Accounts (5206.0); Urbis
3.6 HOME IMPROVEMENT TURNOVER ATTRIBUTABLE TO NON-
HOUSEHOLD SECTOR
3.6.1 METHODOLOGY
While it is very difficult to precisely estimate the size of the non-household market (e.g. a business
purchase or trade sales) versus the household market, the ABS has conducted a survey of retail and
wholesale industries (cat. no. 8622.0), which can broadly indicate the relative proportions between the
two.
This survey was last conducted in 2005-06 for the whole of Australia and for selected businesses in retail
and wholesale industries (i.e. businesses listed under Division G and Division F respectively in the 2006
edition of the Australian and New Zealand Standard Industrial Classification (ANZSIC06)). This survey
asks the businesses the following question:
“Sales of goods bought in and resold by this business $________
Of „Sales of goods bought in and resold‟ reported above,
please estimate the percentage sold to:
a) other businesses or organisations _______%
1
b) the general public _______%”
1
Source: ABS Survey of Retail Industries Questionnaire, 2005-06
20 TRADE AREA HOUSEHOLD EXPENDITURE
URBIS
ECONOMIC IMPACT ASSESSMENT FINAL REV CThe results of the survey are then used by the ABS to calculate the amount of wholesale sales, which is
defined as “the sales of goods to businesses and other organisations”. Based on ABS data, therefore, we
have estimated the proportion of retail vs. wholesale sales using the broad “hardware/garden” and “other
home improvement” categories.
The percentage splits of total store sales listed in Table 10 are derived from the ABS Survey of Retail
Industries, discussed above. While hardware/garden sales are split almost 50/50 between retail and
wholesale, other home improvement categories are more weighted to retail sales (i.e. generally around
80/20) although there is some variation between the individual ANZSIC categories covered. It should be
acknowledged that the ratios in Table 10 are a national average and the actual split between household
(“Retail”) and non-household (“Wholesale”) sales will vary by geographical area and by retailer.
TABLE 10 – RETAIL VS WHOLESALE – HOME IMPROVEMENT CATEGORIES
% Sales
Retail Wholesale
Hardware, Garden 51% 49%
Other Home Improvement 83% 17%
Total Home Improvement Market 72% 28%
1. Hardware, Garden market consists of the "Hardware, Building & Garden Supplies Retailing" category.
2. Other home improvement market comprises the ANZSIC06 categories - Furniture retailing, Floor covering retailing, Electrical, electronic and
gas appliance retailing, Other electrical and electric goods retailing, and Sport and camping equipment retailing.
Source: ABS, Retail and Wholesale Industries, Australia, 2005-06 (8622.0); Urbis
3.6.2 TOTAL HOME IMPROVEMENT MARKET
Based on these ratios, we have estimated non-household home improvement spending directed to retail
stores. These sales, combined with available household spending in home improvement categories,
generate the total home improvement market of relevance to retailers.
Home improvement “spending" from the non-household sector is estimated to be in line with the ratios
identified in Table 10. Table 11 details the total home improvement market available to the proposed
development. Consequently, this is estimated at $142.7m in 2016, including $42.6m by the non-
household market.
TABLE 11 – TOTAL TRADE AREA HOME IMPROVEMENT EXPENDITURE, 2013 ($M, EXCL GST)
Total Area Home Improvement Expenditure
CLARENDON MASTERS 2016 (Excl GST)
Secondary Trade Area
Primary North East South Secondary Main TA
Residential Home Improvement Market TA
Hardware, garden 9.2 13.3 3.5 3.3 20.1 29.2
Home Decoration 2.2 3.1 0.8 0.8 4.7 6.9
Furniture 8.6 10.3 2.7 2.4 15.3 23.9
Floor Coverings 3.5 4.6 1.2 1.2 7.0 10.5
Whitegoods 8.2 9.3 2.5 2.0 13.8 22.0
Recreational Equipment 2.4 3.5 0.8 0.8 5.1 7.5
Total Residential Market 34.0 44.0 11.5 10.5 66.1 100.1
Non-Residential Home Improvement Market
Homeware, garden (@49%) 8.8 12.8 3.3 3.2 19.3 28.1
Other Home Improvement (@17%) 5.1 6.3 1.6 1.5 9.4 14.5
Total Non-Household market 13.9 19.1 5.0 4.6 28.7 42.6
Total Home Improvement Market
Homeware, garden 18.0 26.0 6.8 6.5 39.3 57.3
Other Home Improvement 30.0 37.0 9.7 8.7 55.4 85.4
Total Home Improvement Market 47.9 63.1 16.5 15.2 94.8 142.7
Source: MDS, MarketInfo 2010; ABS, Australian National Accounts: National Income, Expenditure and Product Accounts (5206.0); Urbis
ABS, Retail and Wholesale Industries, Australia 2005-06 (8622.0)
URBIS
ECONOMIC IMPACT ASSESSMENT FINAL REV C TRADE AREA HOUSEHOLD EXPENDITURE 214 Competitive Environment
This section provides a description of the centres and retail precincts considered to be of most relevance
to the proposed development, and also those of importance in terms of the sub-regional retail Hierarchy.
Understanding the competition in the vicinity of the subject site is an important consideration in defining
the Main Trade Area, and also affects the potential for new developments to trade successfully.
Existing retail provision is shown in Table 12 and Figure 7 below.
Fundamentally, Masters home improvement stores operate within a fairly niche market – the hardware
and home improvement sector – and will typically trade most competitively with other large format
hardware and home improvement stores. Trading impacts on „traditional‟ shopping centres and retail
strips are generally limited as these contain limited provision of this type of retailing.
TABLE 12 – COMPETITIVE ENVIRONMENT: MAIN TRADE AREA HOME IMPROVEMENT AND BULKY GOODS RETAIL
Competitive Environment
CLARENDON MASTERS
Retail Dist.2 From Major
GLA1 Centre Tenants
Location (Sq.m) (km.)
Sub Regional Shopping Centre
Richmond Marketplace 17,200 4.0 Big W, Woolworths
Supermarket Centres
Richmond Mall 5,500 4.0 Coles
Windsor Marketplace 4,400 2.5 Woolworths
Windsor Riverview 8,500 2.5 Coles
North Richmond 7,000 8.0 Coles
Bulky Goods Centres and Precincts
McGrath's Hill 21,500 6.0 Bunnings, Harvey Norman, BCF, Petbarn, Your Place
North Richmond 3,000 8.0 Stihl, Pine & Timber, Blinds, Camping & Tools
Windsor 3,400 2.5 Mitre 10, Reece, Tradline, Hawkesbury Curtains
Retail Strips
Richmond Town Centre 18,000 4.0 ALDI
North Richmond 3,000 8.0 Franklins
Windsor Town Centre 10,000 2.5
1. PCA, Australian Shopping Centre Database 2012 for current centres
2. Distance measured by most direct road route
Source : PCA, Australian Shopping Centre Database 2012 ; Urbis
4.1 HOME IMPROVEMENT PRECINCTS WITHIN THE MAIN TRADE AREA
There is one significant Bulky Goods / Home Improvement Precinct within the Main Trade Area – at
McGrath’s Hill as well as some smaller hardware and home improvement stores dispersed throughout
Richmond, North Richmond and Windsor, however these form a small component of overall retail
provision within these centres.
The McGrath‟s Hill Bulky Goods / Home Improvement Precinct is located on Windsor Road, some 2.5km
to the south of Windsor Town centre and 4.5km to the south of the subject site.
The McGrath‟s Hill Precinct includes “Home Central”, a 15,600 sq.m homemaker centre which includes a
9,300 sq.m Bunnings Warehouse, a 3,000 sq.m Harvey Norman store focusing on computers & electrical
and furniture, as well as Repco, BCF, Petbarn, Whitewood Warehouse and Your Place.
The broader McGrath‟s Hill Precinct extends along Windsor Road and contains approximately 6,000 sq.m
additional home improvement / bulky goods floorspace amongst a range of light industrial units.
22 COMPETITIVE ENVIRONMENT
URBIS
ECONOMIC IMPACT ASSESSMENT FINAL REV CYou can also read


