Tomorrow's Energy Scenarios 2019 Ireland - Planning our Energy Future System Needs Assessment - EirGrid
←
→
Page content transcription
If your browser does not render page correctly, please read the page content below

Tomorrow’s Energy Scenarios
               2019 Ireland
      System Needs Assessment
      Planning our Energy Future

        EirGrid – Tomorrow’s Energy Scenarios 2019 System Needs Assessment • Planning our Energy Future • Page a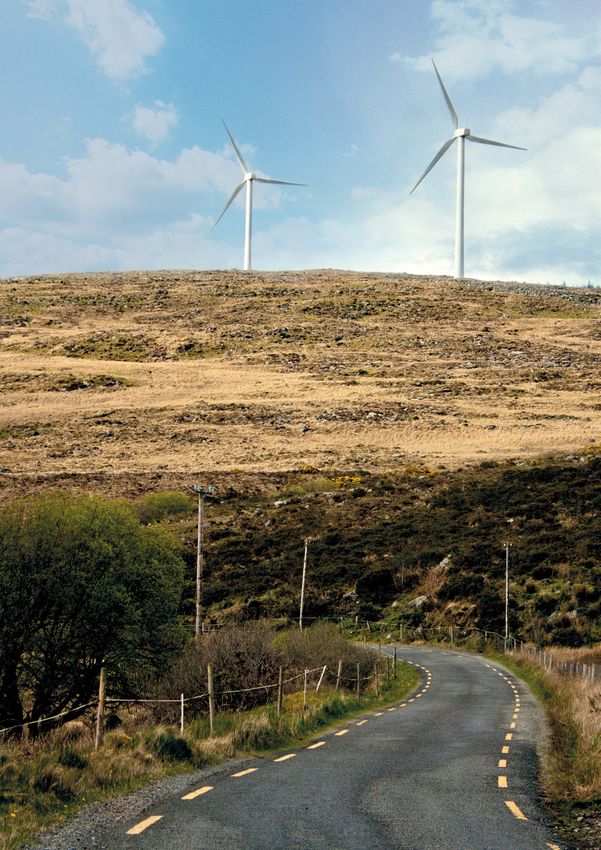
Disclaimer
EirGrid has followed accepted industry practice in the collection and analysis of data available.
While all reasonable care has been taken in the preparation of this data, EirGrid is not responsible
for any loss that may be attributed to the use of this information. Prior to taking business
decisions, interested parties are advised to seek separate and independent opinion in relation
to the matters covered by this document and should not rely solely upon data and information
contained herein. Information in this document does not amount to a recommendation in respect
of any possible investment. This document does not purport to contain all the information
that a prospective investor or participant in the Single Electricity Market may need.

For queries relating to this document please contact: scenarios@eirgrid.com

Published December 2019.

COPYRIGHT NOTICE
All rights reserved. This entire publication is subject to the laws of copyright. This publication may
not be reproduced or transmitted in any form or by any means, electronic or manual, including
photocopying without the prior written permission of the transmission system operator.

©EirGrid Plc. 2019
The Oval, 160 Shelbourne Road, Ballsbridge, Dublin 4, D04 FW28, Ireland.

                EirGrid – Tomorrow’s Energy Scenarios 2019 System Needs Assessment • Planning our Energy Future • Page b
Table of contents
Foreword ................................................................................................................................... 1
Document Structure .................................................................................................................... 2
Glossary of Terms........................................................................................................................ 3
Executive Summary..................................................................................................................... 4
1. Introduction ............................................................................................................................ 7
   1.1.        Report purpose............................................................................................................ 7
   1.2.        Why we use scenario planning..................................................................................... 7
   1.3.        Related publications.................................................................................................... 7
2. Tomorrow’s Energy Scenarios 2019 ......................................................................................... 9
   2.1.        Scenario development ................................................................................................ 9
   2.2.        Summary of our scenarios ........................................................................................... 9
3. How we develop the grid .......................................................................................................11
   3.1.        Grid development strategy......................................................................................... 11
   3.2.        Grid development process.......................................................................................... 12
4. Our approach to identifying needs.........................................................................................13
   4.1.        Analysing how the grid performs into the future ......................................................... 13
   4.2.        Types of drivers ......................................................................................................... 17
   4.3.        Ireland’s regions ....................................................................................................... 18
5. System needs .......................................................................................................................19
   5.1.        Area 1 – Dublin Mid-East ........................................................................................... 20
   5.2.        Area 2 – West ............................................................................................................ 22
   5.3.        Area 3 – North-West Border ....................................................................................... 24
   5.4.        Area 4 – Midlands ..................................................................................................... 26
   5.5.        Area 5 – South-West .................................................................................................. 28
   5.6.        Area 6 – South-East ................................................................................................... 30
   5.7.        Scenario need scores summary for 2030.................................................................... 32
   5.8.        A note on 2040 grid simulation results....................................................................... 33
Next steps ................................................................................................................................34
Appendix A – New grid project assumptions ..............................................................................35
Appendix B – All island electricity transmission grid .................................................................36
Appendix C – Results data ........................................................................................................37

                            EirGrid – Tomorrow’s Energy Scenarios 2019 System Needs Assessment • Planning our Energy Future
EirGrid – Tomorrow’s Energy Scenarios 2019 System Needs Assessment • Planning our Energy Future • Page d

Foreword
EirGrid, as transmission system operator for Ireland, is pleased to present the Tomorrow’s Energy
Scenarios 2019 System Needs Assessment.
The transmission grid transports electricity from where it is generated to supply power to industry and
businesses that use large amounts of electricity. The grid also powers the distribution network that
supplies electricity used every day in our homes, businesses, schools, hospitals, and farms.
Three scenarios, detailing credible futures for the electricity sector in Ireland, were developed as part
of Tomorrow’s Energy Scenarios 2019. Our stakeholders helped to shape and enhance these scenarios,
providing valued feedback as part of an open consultation. With respect to electricity sector targets
for 2030, two of our scenarios achieve 70% RES-E, while all three achieve carbon dioxide emissions
from electricity production of less than 4.5 megatonnes. A reliable transmission grid will be a central
component of realising this low-carbon future.
Employing our scenarios we’ve identified future needs of the grid, as part of our integrated grid
development process. These needs arise from changes in the usage of the grid, which is influenced by
the scale and location of electricity consumption, generation, interconnection and storage. We develop
new electricity infrastructure only when it is needed, and we work for the benefit and safety of every
citizen in Ireland.
We are already tackling some of the needs identified, as detailed in our Transmission Development
Plan 2018-2027. We will continue to monitor and assess these, along with other investment needs, as
conditions change and new information becomes available. We are also embarking on developing a
holistic work programme to deliver grid solutions, in both infrastructural and technological terms, in
order to facilitate the electricity targets set out in the Government’s Climate Action Plan 2019 and the
National Energy and Climate Plan 2021-2030.
We very much welcome your feedback on this document and look forward to working with all our
partners to facilitate Ireland’s low carbon future.

Mark Foley
Chief Executive, EirGrid Group
December 2019

                EirGrid – Tomorrow’s Energy Scenarios 2019 System Needs Assessment • Planning our Energy Future • Page 1
Document structure
This document contains a glossary of terms, an executive summary, five main chapters, a next steps
chapter, and appendices. The structure of the document is as follows.
The Glossary of terms explains some technical terms used in the document.
The Executive summary summarises the main findings of the document.
Chapter 1 explains the purpose of the TES System Needs Assessment, outlines why we use scenarios,
and lists other related publications.
Chapter 2 describes the scenario development cycle and summaries our three scenarios.
Chapter 3 describes our grid development strategy and our grid development process.
Chapter 4 outlines the approach taken to identifying needs and the types of needs and drivers.
Chapter 5 presents the results of the TES System Needs Assessment by area and scenario.
The Appendices outline the grid assumptions used and provide figures summarising the grid simulation
results.

                EirGrid – Tomorrow’s Energy Scenarios 2019 System Needs Assessment • Planning our Energy Future • Page 2
Glossary of terms
Area [Need]                                 Fault                                               STATCOM, SVC or
A part of the transmission grid             An unexpected loss of a                             synchronous condenser
that contains a number of needs.            grid element, such as a                             Technologies that can help
                                            generation unit, transmission                       regulate the voltage in both
Capacitor                                   line, transformer or other                          directions (high and low).
A technology that can help                  electrical element.
limit a drop in voltage.                                                                        System Operator Northern
                                            Interconnector                                      Ireland (SONI)
Circuit                                     A transmission line which                           The licensed transmission
An element of the transmission              crosses or spans a border                           system operator in
grid that carries electricity.              between countries that                              Northern Ireland.
                                            connects the transmission
Conventional generation                     systems of the countries.                           Technical planning standards
A large power plant which                                                                       The set of standards, set
typically uses fossil fuel(s)               Limit exceedance                                    out in the Transmission
to generate electricity.                    An instance of a grid element                       System Security and Planning
                                            performing outside of the                           Standards, that the grid
Distribution grid [electricity]             technical planning standards.                       is designed to meet. Our
The network of high, medium                                                                     technical planning standards
and low voltage (110 kV and                 Need [grid development]                             are a licence obligation and are
below) circuits and other                   A future deficiency identified                      approved by the Commission for
equipment used for supplying                on the grid that arises as a                        Regulation of Utilities (CRU).
electricity to consumers.                   result of one or more drivers.
                                                                                                Transmission grid [electricity]
Dispatch                                    Rating                                              The typically meshed network
A set of indicative operating               An operating limit for an                           of high voltage (400 kV, 275
points for generators,                      element of the grid.                                kV, 220 kV and 110 kV) circuits
storage, interconnectors and                                                                    and other equipment used
demand side units required                  Reactor                                             to transmit bulk electricity
to meet electricity demand                  A technology that can help                          supplies around Ireland. The
over a given time horizon.                  limit a rise in short circuit level                 terms grid, network and system
                                            or voltage, depending on its                        can be used interchangeably.
Driver                                      installation and configuration.
A factor that influences a need.                                                                Transmission system
                                            Series compensation                                 operator [electricity]
EirGrid                                     A technology that can                               The licensed entity
The independent statutory                   increase the power flow                             that is responsible for
electricity transmission                    on an existing line.                                transmitting electricity from
system operator in Ireland.                                                                     generators to regional or
                                                                                                distribution operators.
Electrification
The substitution of electricity
for other fuels, such as oil
and gas, used to provide
similar services, for example
heating and transport.

                 EirGrid – Tomorrow’s Energy Scenarios 2019 System Needs Assessment • Planning our Energy Future • Page 3
Executive summary
The Tomorrow’s Energy                         The outcome of this process                         In terms of needs, we’ve
Scenarios 2019 System Needs                   determines the areas of the                         assessed two types:
Assessment highlights the                     existing grid that may need
needs of the transmission                     to be further developed                             •     Power-Transfer Capacity:
grid in Ireland under the                     or strengthened.                                          when the amount of
future scenarios outlined in                                                                            electricity to be carried by
Tomorrow’s Energy Scenarios                   We have identified six areas of                           local lines or cables is too
20191.                                        the country where we believe                              high for their rated capacity.
                                              there is a potential need to
As part of the Tomorrow’s                     develop the grid in order to                        •     Voltage Support:
Energy Scenarios (TES)                        facilitate a low-carbon future.                           when there is not enough
2019 cycle, we developed                                                                                capability in the region to
a set of scenarios outlining                  Our assessment of the scale                               control voltage and reliably
three credible futures for                    of the need at each location is                           supply the electricity that
the supply and consumption                    based on two factors. Firstly,                            is needed. We have further
of electricity in Ireland:                    the cause or driver of the local                          categorised this need by
                                              challenge to the grid, and                                direction (high voltage and
• Centralised Energy                          secondly what kind of problem                             low voltage).
• Delayed Transition                          or need this creates.
                                                                                                  These areas of need, under
• Coordinated Action                          With regard to the drivers of the                   our future scenarios, are
Although our scenario pathways                needs, we’ve identified four                        summarised in Figure 1.
extend to 2040, focus here is                 categories:
placed on communicating the
needs identified out to 2030.                 •     Increased demand for
                                                    electricity, particularly large
Changes in grid usage across                        energy users.
scenarios and locations drive
varying levels of need over                   •     New sources of electricity
time in different areas.                            generation or storage,
                                                    including onshore wind,
These needs were calculated                         offshore wind, and solar
using a series of computer                          photovoltaics.
model simulations. These
models are based on the                       •     Closures of electricity
data from our final scenarios,                      generators, particularly
which incorporate stakeholder                       those relied upon for voltage
feedback received about the                         support.
scenarios. Using the dispatch                 •     New interconnection,
modelling results from TES                          including high voltage
2019, we conducted thousands                        direct current (HVDC)
of grid simulations in order to                     interconnectors.
appraise the performance of
the grid against our technical
planning standards.

1 EirGrid, Tomorrow’s Energy Scenarios 2019

                   EirGrid – Tomorrow’s Energy Scenarios 2019 System Needs Assessment • Planning our Energy Future • Page 4
Area 1                                      Area 2                                             Area 3
Dublin Mid-East                             West                                               North-West Border
The grid in this area                       This area of the grid relies                       The grid in this area is made
mainly consists of 220 kV                   on low capacity 110 kV                             up of long 110 kV lines, which
underground cable and                       lines, and has some 220 kV                         are relatively isolated from
overhead lines, with two 400                connections to the wider grid.                     the 220 kV grid. Onshore wind
kV lines connecting to the rest             While the North Connacht                           connections create power-
of the country. The anticipated             110 kV project improves                            transfer needs in the area
growth in large energy users,               power-transfer capacity in                         and these large transfers of
such as data centres, yields                the north of the area, further                     power also create voltage
needs for voltage support. The              onshore wind connections                           support needs. The cause of
expected growth in onshore                  create further power-transfer                      these issues is the forecasted
wind generation across the                  needs in the north and also                        connection of new renewable
country and offshore wind                   in the south of the area.                          energy projects in this area.
generation in the Irish Sea                 These large transfers of                           The decommissioning of
results in a need for power-                power create voltage support                       conventional generating
transfer capacity. Increasing               needs, which are exacerbated                       units in the Midlands further
renewables on the system                    by the decommissioning                             increases the voltage support
displaces conventional                      of conventional generating                         need. The need for grid
generation in the area,                     units in Moneypoint and the                        development in this area is
resulting in voltage support                Midlands. The need for grid                        moderate to high across our
needs. The need for grid                    development in this area is                        scenarios.
development in this area is                 moderate to high across our
high to very high across our                scenarios.
scenarios.

Area 4                                      Area 5                                             Area 6
Midlands                                    South-West                                         South-East
The grid in this area consists              This area includes some                            As with other mostly rural
of 110 kV and 220 kV lines,                 underground cables in Cork                         areas of the grid today, this
with power flowing mostly                   and in the west of the area,                       area uses 110 kV and 220
west to east through the area.              but otherwise consists of 110                      kV overhead lines. There is a
Onshore wind generation                     kV and 220 kV overhead lines.                      lot of power moving through
to the north and west of the                Onshore wind growth and new                        this area to large electricity
area cause a high need for                  high voltage direct current                        demand centres in Dublin
power-transfer capacity.                    (HVDC) interconnection create                      and Cork. Growth in offshore
The decommissioning of                      power-transfer capacity                            wind generation and new
conventional generation in                  needs in the area. There is                        HVDC interconnection creates
the area creates voltage-                   a moderate to high need for                        a need for power-transfer
support needs. There is a                   grid development in this area                      capacity in the area. The
moderate to high need for                   across our scenarios.                              need for grid development in
grid development in this area                                                                  this area is moderate to high
across our scenarios.                                                                          across our scenarios.

                                        Figure 1: Summary of system needs

               EirGrid – Tomorrow’s Energy Scenarios 2019 System Needs Assessment • Planning our Energy Future • Page 5
EirGrid – Tomorrow’s Energy Scenarios 2019 System Needs Assessment • Planning our Energy Future • Page 6
1. Introduction
1.1. Report purpose 1.2. Why we use                                                              The All-Island Generation
                                                                                                 Capacity Statement (GCS)3
The TES System Needs scenario planning                                                           outlines the likely generation
Assessment is a planning                     Scenario planning allows us to                      capacity required to achieve an
screening study, which                       assess the performance of the                       adequate supply and demand
highlights the potential                     electricity grid against a credible                 balance for electricity in Ireland
development needs of the                     range of potential futures.                         and Northern Ireland over ten
electricity transmission grid                                                                    years. This report forms the
under our future scenarios                   As the licensed transmission                        basis for underlying demand
outlined in TES. These needs are             system operator in Ireland, we                      growth assumptions used in
brought about by the changes                 are responsible for the ongoing                     TES.
to the electricity portfolio,                development of the transmission
such as electricity generation,              grid so that it continues to                        The All-Island Ten Year
demand, interconnection and                  meet the needs of electricity                       Transmission Forecast Statement
storage. Focus is placed on                  consumers into the future.                          (TYTFS)4 provides detailed
the 2025–2030 timeframe, so                                                                      data by transmission network
as to highlight development                  In 2017 we introduced scenario                      node, which provides the
requirements related to                      planning as part of our grid                        basis for the existing electricity
facilitating Government energy               development process so                              grid model used in the TES
policy.                                      that it continues to support                        System Needs Assessment.
                                             Ireland’s economic growth,                          The TYTFS also provides other
Some of the needs identified are             changing generation mix                             information such as demand
being addressed by projects in               and expanding population,                           and generation opportunities on
our Transmission Development                 recognising the uncertainty                         the transmission grid.
Plan (TDP)2. Needs not covered               present in the planning horizon.
in the TDP will undergo further                                                                  The TDP outlines projects for the
investigation. If verified, these            This process helps us                               transmission grid over a ten year
needs will appear in future                  maintain required levels of                         period. Needs identified in the
editions of the TDP along with               system safety, security and                         TES System Needs Assessment,
an associated development                    reliability over the long-term.                     as part of step 1 of the grid
project.                                                                                         development process, may
                                             1.3 Related                                         lead to projects listed in future
Our scenario planning process
does not identify short-term
                                             publications                                        editions of the TDP.

needs or constraints, for                    EirGrid produce a number of
example those arising from                   network planning documents
unforeseen plant closures, new               that share a relationship
connections or project delays.               with TES. These are shown in
The grid development process                 Figure 2. Alongside TES they
adapts to these changes as they              provide a holistic view of the
occur.                                       future electricity transmission
                                             system. TES aligns with
                                             these reports and provides a
                                             wider view of the electricity
                                             transmission grid beyond a
                                             ten-year planning horizon.

2 EirGrid, TDP 2018 - 2027
3 EirGrid Group, Generation Capacity Statement 2019-2028
4 EirGrid Group, TYTFS 2018

                  EirGrid – Tomorrow’s Energy Scenarios 2019 System Needs Assessment • Planning our Energy Future • Page 7
The TES outlines future The Ten Year Network
electricity scenarios Development Plan (TYNDP)
incorporating stakeholder process5 of the European
feedback received as a part Network of transmission system
of a consultative process. The operator for electricity and
TES System Needs Assessment gas is an important reference
uses these scenarios to for TES. It provides guidance
identify needs of the electricity on the European-wide energy
transmission system brought transition, and is central to
about changes to electricity understanding European Union
demand, generation, (EU) Projects of Common Interest
interconnection and storage. The (PCIs).
TES reports are reviewed and
updated every two years.
Ten-year-horizon planning publications
All-Island Ten Year
Transmission Forecast All-Island Ten Year
Statement
2018 Transmission Forecast
Statement
2018
Transmission
All-Island
Development Plan
Generation
2018-2027
Capacity
Statement
2019-2028
EirGrid and SONI – Ten Year Transmission Forecast Statement 2018 • Page a
All Island Generation All Island Ten Year Transmission Transmission Development Plan
Capacity Statement Forecast Statement Ten year network and
Ten year electricity Detailed information on demand interconnection development plan.
demand forecast. and generation opportunities.
Twenty-year-plus-horizon planning publications
TYNDP 2020
SCENARIO REPORT
Decarbonised economy
GHG Distributed Energy
Solar
National Trends Wind
Biomethane
Energy Hydrogen Tomorrow’s Energy
Europe CO2 Scenarios 2017
Paris System Needs Assessment
Hydro Planning our Energy Future
Electricity Climate Targets Gas
Net-zero
Renewable energy
Beyond
NECP
Power-to-gas COP21 2050 Carbon Capture
Hybrid System
Sector coupling
Scenarios Methane
Carbon budget
Global Ambition Bio-energy
European Network of
Transmission System Operators
for Electricity
Ten Year National Development Tomorrow’s Energy Scenarios TES System Needs Assessment
Plan - Scenarios Report Electricity scenarios for Ireland Long-term needs of the electricity
Energy scenarios for Europe out to 2040. transmission grid out to 2040.
out to 2040.
Figure 2: Related planning publications
5 ENTSOs, TYNDP 2020 Scenario Report
EirGrid – Tomorrow’s Energy Scenarios 2019 System Needs Assessment • Planning our Energy Future • Page 82. Tomorrow’s Energy Scenarios 2019
2.1. Scenario development
Our scenarios are reviewed every two years to include new information. You can find all of the TES
publications on our Energy Future webpage. An overview of the TES 2019 scenario development cycle
is shown in Figure 3. The System Needs Assessment concludes the TES cycle.
Prepare scenario
framework and
storylines
The consultation offers us a
Consult on scenarios chance to receive feedback on the
with stakeholders scenarios before the dispatch
We apply our technical model-building phase begins
planning standards to System Needs
thousands of grid Assessment
simulations to identify publication
needs
We use optimisation software
Build grid Build dispatch to simulate future electricity
models models production and consumption
patterns
Consultation
Scenarios
Publication
publication
Current phase
Figure 3: TES 2019 Ireland development cycle
Data captured during the consultation phases reflects the best information available at the time and
remains unchanged, or frozen, since then.
SONI have produced a draft set of Tomorrow’s Energy Scenarios 2019 which are described in a
separate consultation report. For more information on SONI’s Tomorrow’s Energy Scenarios 2019
please visit SONI’s Energy Future webpage.
2.2. Summary of our scenarios
In October we published TES 2019, a document outlining three possible futures for the supply and
consumption of electricity in Ireland out to 2040:
Centralised Energy is a plan-led world in which Ireland achieves a low carbon future.
Delayed Transition is a world in which decarbonisation progress is made, but the pace is not sufficient
to meet long-term climate objectives.
Coordinated Action is a scenario where sustainability is a core part of decision making. Government
and citizens recognise climate change as a risk and take appropriate action.
The TES 2019 dataset is a key input to the System Needs Assessment analysis. It provides an envelope
for the future capacity levels and locations of electricity demand, generation, interconnection and
storage. A summary of the scenario portfolios is given in Table 1.
EirGrid – Tomorrow’s Energy Scenarios 2019 System Needs Assessment • Planning our Energy Future • Page 9Centralised Energy Delayed Transition Coordinated Action
Variable 5.5 GW Onshore wind 5.8 GW Onshore wind 8.2 GW Onshore wind
renewables 3.5 GW Offshore wind 1.0 GW Offshore wind 1.8 GW Offshore wind
installed capacity 0.6 GW Solar PV 0.9 GW Solar PV 2.0 GW Solar PV
Percentage
44% Onshore wind 54% Onshore wind 56% Onshore wind
of which is
0% Offshore wind 0% Offshore wind 0% Offshore wind
distribution-
59% Solar PV 60% Solar PV 68% Solar PV
connected
Peat: Yes Peat: Yes Peat: Yes
Fossil fuel-fired Coal: Yes Coal: Yes Coal: Yes
generation phased Oil*: Yes Oil*: Yes Oil*: Yes
out Unabated/non-renewable Unabated/non-renewable Unabated/non-renewable
Gas**: No Gas**: No Gas**: No
Interconnectors EWIC, North South, Celtic, EWIC, North South, Celtic,
EWIC, North South, Celtic
in-service Greenlink Greenlink
500,000 electric vehicles 250,000 electric vehicles 900,000 electric vehicles
Electrification
350,000 heat pumps 270,000 heat pumps 600,000 heat pumps
1,300 MVA max. import 1,100 MVA max. import 1,700 MVA max. import
Large energy users
9.8 TWh annual demand 8.3 TWh annual demand 12.6 TWh annual demand
*Heavy fuel oil and distillate oil for primary fuel purposes.
**Not fully abated with carbon capture and storage or not fully renewable via 100% of supply from
biomethane or hydrogen.
Table 1: Tomorrow’s Energy Scenarios 2019 summary, 2030. (PV: photovoltaics)
EirGrid – Tomorrow’s Energy Scenarios 2019 System Needs Assessment • Planning our Energy Future • Page 103. How we develop the grid
3.1. Grid development strategy
EirGrid is responsible for a safe, secure and reliable electricity transmission system, now and in the
future. To achieve this we must continue to maintain and develop the grid.
Our approach to the development of Ireland’s electricity infrastructure is set out in the Grid
Development Strategy6. Our strategy assists us to meet projected demand levels, to meet Government
policy objectives, and to ensure a long-term sustainable and competitive energy future for Ireland.
The Grid Development Strategy is influenced by three main factors, as shown in Figure 4.
1. Feedback from Grid 3. Changes in the
our consultations on Development external economic
major projects Strategy environment
2. Advances in technology
Figure 4: Factors influencing our Grid Development Strategy
These factors led to the development of three strategic statements which underpin our Grid
Development Strategy. The statements are as follows:
Statement 1: We are committed to continually improving public participation and community
engagement as part of grid development process. For more on our commitment to public consultation,
see our Reviewing and Improving our Public Consultation Process7 publication.
Statement 2: We continually review technological developments to assess their potential use on the
Irish transmission system. Technologies are categorised into three types: technology available now, new
technology ready for trial use, and new technology at research and development stage.
For a given grid development project, each technology is assessed for suitability with respect to cost,
ease of project delivery, improved grid performance and security of supply, environmental friendliness,
and system flexibility. This will assist us in determining the best transmission technology for future
projects.
Statement 3: We will continue to maximise the use of the existing grid infrastructure. This can be
achieved by increasing the capacity of existing infrastructure, or by using new technologies, depending
on the requirements and circumstances in each case. We will build new infrastructure only when this is
the right solution.
We work with industry partners, technology innovators and with other transmission system operators to
identify, research and trial possible innovations.
6 EirGrid, Ireland’s Grid Development Strategy
7 EirGrid, Reviewing and Improving our Public Consultation Process
EirGrid – Tomorrow’s Energy Scenarios 2019 System Needs Assessment • Planning our Energy Future • Page 113.2. Grid development process
We are committed to delivery of our grid development strategy and have designed processes that
ensure our overall strategy and strategic statements are achieved. Our Have Your Say8 publication
details our six-step grid development process, which is shown in Figure 5.
Step 1 Step 2 Step 3 Step 4 Step 5 Step 6
How do we What What’s the Where exactly The planning Construction,
identify future technologies best option should we process. energisation
needs of the can meet and what area build? and benefits
electricity these needs? may be sharing.
grid? affected?
Figure 5: Grid development process
In step 1 of the process we identify future needs of the electricity transmission grid brought about by
changes to:
• Electricity demand,
• Electricity generation and storage,
• Electricity interconnection, and
• Asset condition.
We use scenarios in step 1 to identify potential system needs brought
about by changes to electricity demand, generation, storage and
interconnection. Our scenarios are not used to identify network Scenarios are used in step
refurbishment needs, which instead are based on changes to the 1 of the grid development
condition of electricity transmission assets. process to test the future
performance of the grid.
Needs identified in this report are subsequently assessed in more
detail before proceeding to step 2 of the grid development process.
We use our scenarios throughout the grid development process,
ensuring that needs remain valid as the electricity transmission grid changes over time and more
information becomes available.
8 EirGrid, Have Your Say
EirGrid – Tomorrow’s Energy Scenarios 2019 System Needs Assessment • Planning our Energy Future • Page 124. Our approach to identifying needs
Our goal is to ensure a reliable and efficient supply of electricity. By simulating future conditions, we
can identify where the grid may need to be developed so that the grid remains safe, secure and reliable
under a broad range of possible circumstances.
Grid conditions can alter due to, among others, changes in:
• local and system weather patterns, which impact the level
of electricity generated by renewables, The way electricity
generation, storage,
• human behaviour, which impacts the shape of electricity interconnection and demand
demand, change throughout the day
affects the flows across the grid.
• electricity market prices, which impacts the level of
electricity imported and exported with neighbouring
systems via high voltage direct current (HVDC)
interconnectors.
4.1. Analysing how the grid performs into the future
We simulate the future performance of the grid using our dispatch and grid simulation models. Our
dispatch model determines the hourly patterns of generation, demand, storage and interconnection for
each scenario (Centralised Energy, Delayed Transition, Coordinated Action) and study year (2025, 2030,
2040). Our grid model determines how these patterns impact the performance of the transmission grid.
A summary of the process used to analyse the future performance of the grid is shown in Figure 6.
TES scenario building process
Define scenario Establish design Perform qualitative Conduct quantitative
evolution characteristics assessment assessment
Number of Identify high Use PEST analysis Use quantitative
study years level design to assess the tools to establish
characteristics performance of scenario portfolios
Number of scenarios against
scenarios per Establish key design each Run dispatch
study year performance characteristic simulations
metrics for
each design Qualitative
characteristic assessment of
key design metrics
Conduct system
needs assessment
Run grid simulations for all
scenarios and study years
TES System Needs Assessment
Apply technical planning standards
to every hour grid simulation results
Use concepts of drivers and areas
to group needs
Figure 6: Overview of our approach to identifying needs.
(PEST: political, economic, social and technological)
EirGrid – Tomorrow’s Energy Scenarios 2019 System Needs Assessment • Planning our Energy Future • Page 13Our technical planning standards9 set out objective criteria, in line with international practice, to which
the transmission system of Ireland is planned in order to ensure the development of a safe, secure,
reliable, economical, efficient and co-ordinated electricity transmission system.
For the TES System Needs Assessment we assess the performance of the transmission system against
intact (no fault) and N-1 (single fault) cases and monitor the impact on circuit loading, station voltage
step and range.
If an element of the grid is performing outside of assessed standards, we identify it as a limit
exceedance. We do this on an hourly basis for each of our scenarios and the study years of 2025, 2030
and 2040. An example of how we analyse the hourly electricity flows on each circuit and the voltage
at each station in order to determine limit exceedances is shown in Figure 7. For illustrative purposes
we’ve selected 2025 Delayed Transition and show the simulated hourly loading and voltage on a 110
kV line and station for the full year. Thermal loading limits vary across the year reflecting changes to
ambient temperatures.
Figure 7: Illustrative example of simulated intact (a) circuit thermal loading and
(b) station voltage range for each hour of the year, Delayed Transition 2025
Other development needs related to criteria in our technical planning standards not considered in this
planning screening study. Needs driven by information not captured in this TES cycle may also arise.
Such cases are dealt with as they arise, through our grid development process.
The grid assumptions are kept constant across scenarios. We assume today’s grid and those projects
that are in step 4 or later of our grid development process. More information on these grid projects
assumed in our grid simulations can be found in Appendix A.
By analysing the simulation results of our dispatch model and grid model, we can pinpoint which
factors influence the limit exceedances. We call these factors drivers.
9 EirGrid, Transmission System Security and Planning Standards
EirGrid – Tomorrow’s Energy Scenarios 2019 System Needs Assessment • Planning our Energy Future • Page 14By grouping the limit exceedances by their driver(s) and their
A need is a deficiency on the
location on the grid, we can identify the needs of the system
grid which arises as a result
into coherent areas. Grouping in this way creates an area of
of one or more drivers
need. By tracking each area and their drivers, we can determine
how the grid performance may change across each scenario over
time.
When determining the areas, we analyse all scenarios and study years, i.e. the presented areas show
the geographic extent of limit exceedances for all scenarios and study years. Establishing areas can
facilitate more local and detailed studies at later stages in the grid development process.
An example of the area concept is shown in black in Figure 8. The limit exceedances shown in this
illustrative area are in relation to line loading (in blue) and to station voltage (in orange). Typically, an
area can present a mixture of these forms of limit exceedances.
Loading limit exceedance
Loading
Voltage
Voltage limit exceedance
Figure 8: Needs area concept
The extent to which the grid within an area performs outside of the technical planning standards can
change for different scenarios and study years. Performance against the technical planning standard is
captured for each area using a need score. A need score is categorised as moderate, high or very high.
A need score is produced for three types of needs: power-transfer capacity, low-voltage support and
high-voltage support.
EirGrid – Tomorrow’s Energy Scenarios 2019 System Needs Assessment • Planning our Energy Future • Page 15Power-transfer capacity needs arise when the amount of electricity that has to be carried by local
lines or cables is too high for their rated capacity. Single faults that can result in power-transfer needs
include the loss of a line or a cable.
Voltage-support needs arise when there is not enough capability in the region to control voltage
and reliably supply electricity demand. Voltage-support needs can be further categorised into two
directions: high and low.
• Low-voltage support needs arise when there are insufficient sources of upward voltage control, and
typically occur during periods of high electricity demand. Single faults that can result in low-voltage
support needs are the loss of electricity supply or the loss of upward-voltage control technologies.
• High-voltage support needs arise when there are insufficient sources of downward voltage control,
and typically occur during periods of low demand, particularly in areas with a high number of
cables. Single faults that can result in low-voltage support needs are the loss of electricity demand
or the loss of downward-voltage control technologies.
Need scores for each area are depicted using charts, an illustrative example of which is shown in Figure
9. The three axes represent the needs score associated with power-transfer capacity, low-voltage
support and high-voltage support. The greater the grid development need in an area, for a given
scenario and year, the greater score on the relevant axis.
Power-Transfer
Capacity
Very high need
High need
Moderate need
High-Voltage Low-Voltage
Support Support
Figure 9: Need scores example. Each needs score chart is produced for a given area
under a given scenario
Solutions to power-transfer capacity needs include (but are not limited to) new overhead lines or
underground cables, uprating existing lines, or installing power controlling devices. Incentives for
congestion management could also alleviate a power-transfer need. Note that the scale of the need
indicates which of these solutions are appropriate for a given case. The greater the need the greater the
likelihood that a new line or cable is required.
Solutions to voltage support needs include (but are not limited to) network devices such as capacitors
for low-voltage; reactors for high-voltage, static synchronous compensators (STATCOMs), synchronous
condensers, static var compensators (SVCs) for both high and low-voltage support needs.
EirGrid – Tomorrow’s Energy Scenarios 2019 System Needs Assessment • Planning our Energy Future • Page 16Other sources of voltage-support capability of new generation, storage and interconnection on the
supply-side. This can be a result of grid code specifications or System Service incentives. For example,
retrofitting existing or mothballed units or the installation of new generation, storage or interconnection
could improve the voltage support capability in an area. The extent of the improvement depends on a
number of factors, including, among others, the size of the technology and the connection type, e.g. ac
or dc, line or cable.
The greater the voltage support need the greater the likelihood that a dedicated network device is
required.
There can also be interdependency between needs, for example instances large power transfer can
worsen the voltage performance in an area. Thus a solution to remove a power-transfer need, such as a
new new circuit, can improve voltage performance.
4.2. Types of drivers
Drivers are a key part of understanding needs, as they identify what is influencing a need. Our analysis
identifies a number of driver types. The predominant influencing factors identified in this analysis are
due to changes in:
Electricity demand: Demand growth and the connection of new demand customer can give rise to
higher electricity flows. The changes in demand identified as having the greatest influence on needs
are:
• Large energy users, such as new data centres. Large energy users can give rise to a step change in
electricity flow at specific grid locations.
Electricity generation: New connections or closures of generators can have a significant impact on
electricity flows. The changes in generation mix identified as having the greatest influence on needs are
the addition of:
• Variable renewables, such as onshore wind, offshore wind, and solar PV generation. Renewable
generation can often be located in remote areas, meaning that the electricity they produce may
need to be transported over a large distance to places of electricity demand.
• Conventional generation or storage, such as new gas turbines or battery energy storage, can
give rise to a step change in electricity flow at specific grid location. The closure of conventional
generating units can also create needs, due to the loss of its voltage-support capability.
Interconnection: New interconnectors can result in large electricity flows into and out of particular
grid locations. Such connectivity with other countries can result in a step change in electricity flow at
specific grid locations.
As the scale of a given technology increases across scenarios and study years, it can become a driver
of needs. Each scenario, due to the portfolio and location mix assumed, has a distinct impact on the
usage of the grid. The key drivers of needs, for each scenario, are shown in Figure 10. (See TES 2019 for
full details on the portfolio and location assumptions.)
Note that changes to the assumed locations of future grid connections may result in needs that have
not been captured in this assessment.
EirGrid – Tomorrow’s Energy Scenarios 2019 System Needs Assessment • Planning our Energy Future • Page 17Centralised
Energy
HVDC
Offshore Wind Interconnection Data Centres
Delayed
Transition
HVDC
Onshore Wind Interconnection Data Centres
Coordinated
Action
HVDC
Onshore Wind Offshore Wind Solar PV Interconnection Data Centres
Figure 10: Key drivers by scenario, 2025–2030
4.3. Ireland’s regions
EirGrid uses regions to help communicate the development of the transmission system in Ireland. The
eight regions are shown in Figure 11. These regions are referred to in this report when describing the
geographic location of areas and drivers of needs.
Border
West
Mid- Dublin
Midlands
East
Mid-West South-East
South-West
Figure 11: Ireland’s regions as per the Nomenclature of Territorial Units for Statistics (NUTS) 3
classification10. The three Assembly regions, Northern and Western; Eastern and Midlands; and
Southern, are groupings of these NUTS 3 regions
10 Ordnance Survey Ireland, NUTS 3
EirGrid – Tomorrow’s Energy Scenarios 2019 System Needs Assessment • Planning our Energy Future • Page 185. System needs
We have identified six areas of need. Each area is treated individually, and is accompanied with a
description of the types of drivers, the types of needs, and the change in need scores over time and
across scenarios.
These grid development needs should be understood in the context of the dispatches used to initialise
the grid simulations. During the day-to-day operation of the electricity transmission system, it is
ensured that circuit loadings and station voltages are within operating limits for intact and credible fault
conditions. In order to ensure that this operational-security objective is met, operational constraints –
also referred to as transmission constraint groups (TCGs) – from the Operational Constraints Update11
are employed.
A relaxed set of TCGs are used in the TES dispatch simulations in order to facilitate Climate Action Plan
201912 targets of 70% RES-E and 4.5 megatonnes of carbon dioxide emission from the electricity system
by 2030. (See TES 2019 for full details on the dispatch assumptions.) Employing this planning method
allows us to:
• identify the needs that arise from future changes to the portfolio (e.g. increase in variable
renewables and electricity demand) and changes to operational rules, which are required to
facilitate climate objectives;
• develop solutions to remove these needs and maintain the reliability of electricity supply.
A summary of the projects used in our grid simulations can be found in Table A-1 (Appendix A).
11 EirGrid and SONI, Operational Constraints Update
12 DCCAE, Climate Action Plan 2019 to Tackle Climate Breakdown
EirGrid – Tomorrow’s Energy Scenarios 2019 System Needs Assessment • Planning our Energy Future • Page 19Letterkenny
Strabane Magherafelt Belfast
Antrim
Omagh
5.1. Area 1 – Dublin Mid-East Lisburn
Enniskillen
Banbridge
Sligo
Newry
Dundalk
Louth
Castlebar
Carrick
-on-
Shannon Navan
Navan Dublin
Mullingar
Finglas
Kinnegad
Dublin
Athlone
Maynooth
Inchicore
Galway
Newbridge
Portlaoise
Nenagh Arklow
Ennis
Carlow
2030
Thurles Kilkenny
Power-
Limerick
2025
Transfer 2030
Capacity
Tipperary
Power- Power-
Transfer
Capacity Wexford Transfer
Capacity
Charleville Waterford
Great Island
Mallow
Dungarvan
acroom
Bandon
High-Voltage Cork High-Voltage Low-Voltage
High-Voltage
Low-Voltage Low-Voltage
Support Support Support Support
Dunmanway Support Support
Centralised Energy Centralised
Delayed Energy
Transition Delayed
Coordinated ActionTransition Coordinated
Centralised Energy Action
Delayed Transition Coordinated Action
Driver(s) Large energy user demand growth, renewable energy source integration
Figure 12: Geographic extent, and need scores and driver(s) for Area 1
EirGrid – Tomorrow’s Energy Scenarios 2019 System Needs Assessment • Planning our Energy Future • Page 20Area introduction
Area 1 is located in the Dublin, Mid-East and Midlands regions. The area comprises mainly of 220
kV grid, much of which is underground cable. Two 400 kV lines provide the area with high capacity
connections to the rest of the grid. The role of this grid is to ensure flexible power transfer into,
around and through the area for varying system conditions. It is characterised by having conventional
generation and a high level of electricity demand.
Noteworthy faults
Line or cable faults result in power-transfer capacity and voltage support needs in this area, particularly
when coinciding with low levels of local generation. Faults of note are the following:
• the loss of 400 kV lines, which results in power-transfer and voltage support shortfalls into the
area,
• the loss of 220 kV lines or cables, which results in a shortfall in power-transfer capacity and voltage
support within and out of the area.
Voltage support needs also arise due to the loss of local voltage support capability. Due to increased
renewable integration, there is a reduction in local conventional generation. This reduction not only
causes voltage support needs but also reduces the redundancy of the voltage support in the area;
the remaining online conventional generators are relied upon to a greater extent for voltage support,
meaning that the loss of these generators causes significant voltage support needs. This is also the
case for the loss of the voltage support capability from offshore wind generation, if installed.
Drivers of needs
The power-transfer capacity need is greatest for the following conditions:
• high levels of electricity being transferred into the area, for example:
• onshore wind generation across the country, or
• conventional generation and HVDC imports from the South-West and South-East regions, or
• onshore wind generation and HVDC imports from the South-West and South-East regions, or
• high offshore wind generation, or
• high conventional generation within the area, or
• high demand from large energy users within the area.
Low-voltage support needs are greatest for the following conditions:
• high demand within the area, or
• high levels of electricity being transferred into the area.
High-voltage support needs in this area occur during hours of low demand.
Needs identified
Figure 12 shows the need scores for the Dublin Mid-East area across scenarios and study years. The
need for power-transfer capacity is very high in Coordinated Action by 2025 due to high demand from
large energy users and high transfers of onshore wind generation into the north of the area. Offshore
wind generation connections in the Irish Sea, along with moderate demand growth, drive a high need
for power-transfer capacity in Centralised Energy by 2025 and a very high need by 2030 as offshore
wind capacities reach 3.5 GW installed. The installation of offshore wind generation reduces the
occurrence of large transfers of power into Dublin; however it creates other local power transfer needs
in Dublin. High power-transfer capacity needs also exist in Delayed Transition for the same reasons
as Coordinated Action, albeit lower due to a lower onshore wind installed capacity and lower demand.
There is a high need for low-voltage support by 2025 due to high growth in data centres. Low-voltage
needs are lower in Centralised Energy due to lower demand from data centres and due to the higher
installed capacity of offshore wind generation, whose voltage support capability and proximity to the
area somewhat offsets the displacement of local conventional generation and load growth. Demand
growth in the area assists in resolving the need for high-voltage support, which are greater in 2025
compared to 2030. However, additional voltage support capability is still required in the area, as the
conditions that cause the worst low-voltage needs in Dublin have system-wide consequences.
EirGrid – Tomorrow’s Energy Scenarios 2019 System Needs Assessment • Planning our Energy Future • Page 21Coleraine
Letterkenny
Strabane Magherafelt
5.2. Area 2 – West Antrim
Omagh
Lisburn
Enniskillen
Banbridge
Sligo Newry
Dundalk
Louth
Castlebar
Carrick
-on-
Shannon Navan
Mullingar
Kinnegad Finglas Dub
Athlone Poolbeg
Maynooth
Inchicore
Carrickmin
Galway
Newbridge
Portlaoise
Nenagh
Ennis Arklow
Carlow
Moneypoint Thurles Kilkenny
2030 Limerick
Power- Tipperary
2025 Transfer 2030 Wexford
Capacity
Power-
Charleville Waterford
Power-
TransferTralee Transfer
Capacity
Great Island
Capacity
Mallow
Dungarvan
Macroom
Bandon Cork
Dunmanway
High-Voltage High-Voltage Low-Voltage
High-Voltage
Low-Voltage Low-Voltage
Support Support Support Support
Support Support
Centralised Energy Centralised
Delayed Energy
Transition Delayed
Coordinated ActionTransition Coordinated
Centralised Energy Action
Delayed Transition Coordinated Action
Driver(s) Renewable energy source integration, conventional generation decommisioning
Figure 13: Geographic extent, need scores and driver(s) for Area 2
EirGrid – Tomorrow’s Energy Scenarios 2019 System Needs Assessment • Planning our Energy Future • Page 22Area introduction
Area 2 is located in the West and Border regions. The area mainly comprises of 110 kV grid. It is
characterised by a strong wind resource and a low electricity demand.
The North Connacht project, which is assumed in-service by our first study year of 2025, ensures
that transfer capacity in the north of the West area is improved. However, as additional onshore wind
generation connects in the area there is a need for additional power-transfer capacity. These circuits in
the south of the area have a low capacity, which can be upgraded.
Noteworthy faults
Line faults, particularly those in the north of the area, result in a power-transfer capacity and voltage
support shortfalls.
Drivers of needs
A need for power-transfer capacity arises during high onshore wind generation, which is exported to
areas of higher electricity demand outside the area. These large power transfers also cause low-voltage
support needs. High-voltage support needs can arise during periods when wind output is low and
electricity demand is low. With a deficit of voltage support capability in the area, the loss of nearby
voltage support capability due to the decommissioning of the conventional generation at Moneypoint
and the Midlands exacerbates the need for voltage support.
Needs identified
Figure 13 shows the need scores for the West area across scenarios and study years.
The need scores indicate that, by 2025, there is a high need for power-transfer capacity in Coordinated
Action and Delayed Transition and a moderate need in Centralised Energy, due to their respective
installed capacities of onshore wind in the area. The need continues to rise in 2030. Voltage support
needs are highest in Coordinated Action, arising from the highest levels of power transfer from the
area.
EirGrid – Tomorrow’s Energy Scenarios 2019 System Needs Assessment • Planning our Energy Future • Page 235.3. Area 3 – North-West Border
Coleraine
Letterkenny
Strabane Magherafelt Belfast
Antrim
Omagh
Lisburn
Enniskillen
Banbridge
Sligo
Newry
Dundalk
Louth
Castlebar
Carrick
-on-
Shannon Navan
2030
Power-
2025 Transfer Mullingar 2030
Capacity
Power- Kinnegad Power- Finglas Dublin
Transfer Transfer
Capacity Athlone Capacity Poolbeg
Maynooth
Inchicore
Carrickmines
Galway
Newbridge
Portlaoise
Nenagh
Ennis Arklow
Carlow
High-Voltage High-Voltage Low-Voltage
High-Voltage
Low-Voltage Low-Voltage
Support Support Support Support
Moneypoint Thurles
Support Kilkenny Support
Limerick
Centralised Energy Centralised
Delayed Energy
Transition Delayed
Coordinated ActionTransition Coordinated
Centralised Energy Action
Delayed Transition Coordinated Action
Tipperary
Driver(s) Wexford
Renewable energy source integration, conventional generation decommisioning
Charleville Waterford
Tralee Figure 14: Geographic extent, need scores and driver(s) for Area
Great 3
Island
Mallow
Dungarvan
Macroom
Bandon Cork
EirGrid – Tomorrow’s Energy Scenarios 2019 System Needs Assessment • Planning our Energy Future • Page 24Area introduction
Area 3 is located in the Border region. The area is relatively isolated from the 220 kV network. It
comprises of 110 kV grid, many of which are long lines, and is characterised by a strong wind resource
and a low electricity demand.
Many of the circuits in and out of the Cathaleen’s Fall hydro station near Ballyshannon, which is the
confluence point to the remainder of the network, are already uprated.
Noteworthy faults
Line faults, particularly to the south and the north of the area, result in a power-transfer capacity
shortfall to the rest of the grid.
Drivers of needs
A need for power-transfer capacity arises during high wind output, which causes high levels of power
flow out of the area to meet demand elsewhere.
These large power transfers, as well as the isolated nature of the area’s grid, also cause low-voltage
support needs. With a deficit of voltage support capability in the area, the loss of nearby voltage
support capability due to the decommissioning of the conventional generators in the Midlands
exacerbates the need for voltage support.
The ability to mitigate high-voltage support needs during periods of low wind output and low electricity
demand is dependent on the availability of local hydro generation.
Needs identified
Figure 14 shows the need scores for the North-West Border area across scenarios and study years.
The need scores indicate that from 2025 onwards there is a high need for power-transfer capacity in
Coordinated Action and a moderate need in Delayed Transition and Centralised Energy, due to their
respective installed capacities of onshore wind in the area.
Voltage support needs are highest in Coordinated Action, arising from the highest levels of power
transfer from the area.
EirGrid – Tomorrow’s Energy Scenarios 2019 System Needs Assessment • Planning our Energy Future • Page 25You can also read