Office Occupancy growth rebounds in the second quarter after a slow start to the year
←
→
Page content transcription
If your browser does not render page correctly, please read the page content below

Office

Canada | Q2 2018

Occupancy growth
rebounds in the second
quarter after a slow start to
the year
JLL Research

Office Outlook | Canada | 2018

Contents

Key trends                              3
State of the Market                     4
Office Clocks                           6
Local Markets                           7
        Downtown Toronto                8
        Suburban Toronto West            9
        Suburban Toronto North & East   10
        Ottawa                          11
        Montreal                        12
        Montreal (French)               13
        Edmonton                        14
        Downtown Calgary                15
        Suburban Calgary                16
        Vancouver                       17
Office Outlook | Canada | 2018

                       3            key trends

Tech pave the way for large block leasing
Tech companies were behind 27.0 percent of leases signed greater than
20,000 square feet in the second quarter

Historically low vacancy in downtown Toronto
Downtown vacancy rates are at historic lows while quality blocks are almost
non-existent until new supply hits the market in 2020-2022

Strong rental growth in new development
New developments in Toronto and Vancouver command record setting rental
rates
4                                                                                                         Office Outlook | Canada | 2018

The positive momentum continued for the Canadian office         around the corner. Nationally, 11.7 million square feet was
market in the second quarter of the year. Employment            under construction at the end of the second quarter with
numbers revealed continued strength in the job market            the majority slated for downtown markets. While still well
adding nearly 32,000 jobs in June bringing the 12-month         below the peak in 2014 when 23.4 million square feet was
total to 214,900 new jobs. And, according to the Bank of        under construction we expected several projects currently
Canada’s most recent Business Outlook Survey – Spring           in the planning phase to break ground soon. One
2018, intentions to increase employment over the next 12-       important factor to note, which also explains the relatively
months edged up, particularly in services. Despite these        low national construction number, is that 87.0 percent of
numbers, with more people searching for work the                construction activity is currently taking place in only three
unemployment rate rose slightly, up 20 basis points to          markets; Vancouver, Toronto and Montreal. In the previous
reach 6.0 percent in June.                                      cycle developers in both Edmonton and Calgary were
                                                                active but the oil downturn put an abrupt stop to any new
Office market fundamentals remained largely positive in         construction activity.
the second quarter; the Canadian office vacancy rate
dropped 10 basis points to reach 12.0 percent. The pace of      Under Construction activity well below 2014 peak (s.f.)
occupancy gains rose considerably as over 760,000 square
feet were absorbed nationally, up from a mere 65,057           25,000,000
square feet in the previous quarter, and leases signed
greater than 20,000 square feet almost doubled led by
                                                               20,000,000
continued strong demand from a space hungry tech
sector. Downtown Class A office buildings saw the largest
quarterly gains with nearly 900,000 square feet absorbed       15,000,000
bringing the year-to-date total to 1.13 million square feet.
And, as in previous quarters net absorption was                10,000,000
concentrated in two markets: Toronto and Vancouver.
    Net absorption rebounds in the second quarter (s.f.)        5,000,000

 2,500,000                                                              0
 2,000,000
                                                                            2010

                                                                                   2011

                                                                                          2012

                                                                                                 2013

                                                                                                        2014

                                                                                                               2015

                                                                                                                      2016

                                                                                                                             2017

                                                                                                                                    2018
 1,500,000
 1,000,000
   500,000                                                      Despite heightened construction activity any relief for
         0                                                      tenants is still a few years out with the first phase of
                                                                significant deliveries expected to be move-in ready in 2020.
  -500,000
                                                                Further, developers have successfully pre-leased large
-1,000,000                                                      portions of construction; In Downtown Toronto for
-1,500,000                                                      example 4.1 million square feet is currently under
-2,000,000                                                      construction but only 1.7 million square feet remain
                                                                available for lease, a number that is dwindling quickly. To
              Q1 2014
              Q2 2014
              Q3 2014
              Q4 2014
              Q1 2015
              Q2 2015
              Q3 2015
              Q4 2015
              Q1 2016
              Q2 2016
              Q3 2016
              Q4 2016
              Q1 2017
              Q2 2017
              Q3 2017
              Q4 2017
              Q1 2018
              Q2 2018

                                                                make matters worse several tenants that have signed
                                                                leases in new construction, including Microsoft, Universal
                                                                Music and LCBO, are net new tenants to the downtown
New construction activity expected to pick up but               market and as such will not add any new available space
relief is still a long way out                                  when they move. The result? Leverage will remain
After reaching the trough in 2017 construction activity is      landlord-favourable, particularly in downtown Vancouver
slowly gaining momentum with heightened construction            and Toronto for some time.
levels across several office markets. And, more is just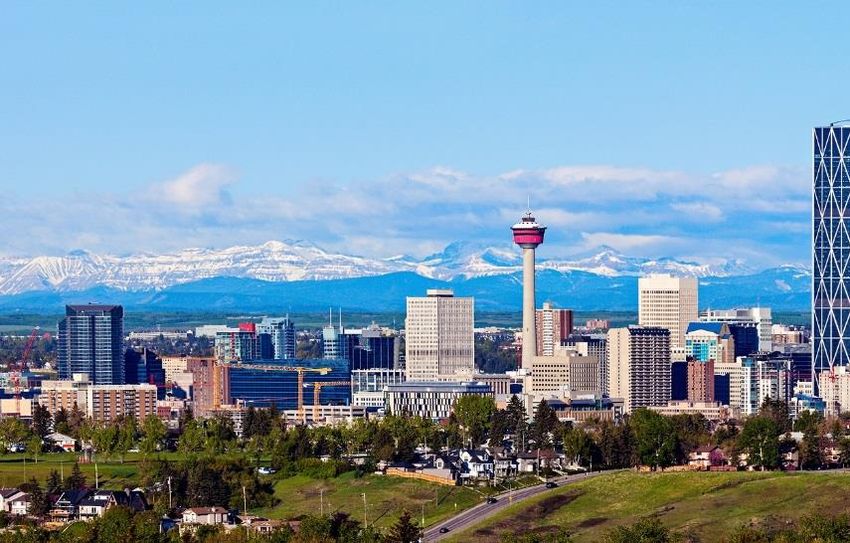
5
                                                                                                    Office Outlook | Canada | 2018

Vacancy slowly decreasing as markets in Alberta                  Rental rate decline slows in Calgary
stabilize                                                        Nationally, the average direct asking net rent declined 1.7
The national office vacancy rate continued its slow descent      percent over the second quarter to reach $16.87 per square
decreasing 10 basis points over the second quarter to            foot, a continuation of the trend we have witnessed since
reach 12.0 percent. Bottoming market conditions in Alberta       2014, brought on by soft market conditions in Alberta.
with investments slowly trickling back to the oil & Gas          Stronger rental growth in downtown Toronto and
industry, growing tenant demand and few construction             Vancouver, however, act as a buffer and will continue to
deliveries in Vancouver, Toronto and Montreal will               keep average national rents in check.
continue to compress the vacancy rate through                    Vancouver recorded another strong quarter with
2018. During the second quarter the downtown Class A             downtown Class A asking rents increasing 2.6 percent
vacancy rate fell by 60 basis points to 10.3 percent, the        quarter-over-quarter and 18.0 percent year-over-year. The
lowest vacancy rate recorded in 11 quarters. Downtown            downtown market continues its hot streak with a year to
Toronto remains Canada’s tightest office market with a           date absorption of 548,029 square feet, which has already
rate of only 3.4 percent while Vancouver is not far behind at    surpassed 2017’s total of 488,401 square feet. Large blocks
4.8 percent. Both markets are going through a period of          of space are limited in the downtown market and those
record strong demand that will continue to put downward          that are available are going for a premium. Rates for AAA
pressure on vacancy rates.                                       quality space now go for between $40-$45 direct asking net
                                                                 rent.
Tech fueling large block leasing activity
Canada continues to flex its muscles as a leading hub for        In Toronto, net asking rents paused over the second
technology and innovation evident by continued strong            quarter remaining unchanged at $19.28 per square foot
growth in the office sector. In the second quarter tech firms    while downtown Class A rents recorded a small decline,
were the primary driver for deals signed greater than            down 1.4 percent to reach $31.80 per square foot. This
20,000 square feet with 27.0 percent followed by                 decline can be attributed to the overall lack of quality
Institutions at 17.0 percent and business services at 15.0       space currently available for lease, however, and as new
percent. Several notable tech deals were completed over          developments and blocks become available over the 12-
the quarter including; Celestica (57,000 s.f.), Google (47,118   months average rents will continue to rise.
s.f.) and Cisco (39,563 s.f.) in Toronto; Sage Software
(40,000 s.f.) renewed in Vancouver while Huawei expanded         Outlook remains positive
by 20,000 square feet in Ottawa.                                 The outlook remains positive with continued strength in
                                                                 outperforming markets of Vancouver, Toronto and more
                                                                 recently Montreal. Tenant demand remains strong in all
                                                                 three markets although the lack of large blocks and
                                                                 historically tight market conditions in downtown Toronto
                                                                 and Vancouver will likely result in year-end net absorption
                                                                 coming in near or below 2017.

    Share of leasing activity across Canada (%)

     Technology
     Institutions                                                                          4%2%
     Professional and business services                                               5%                27%
     Scientific and technical                                                      7%
     Retail
     Financial services
     Healthcare and Life Sciences                                                9%
     Manufacturing
     Other                                                                          11%                  17%
     Coworking
     Logistics and distribution                                                              15%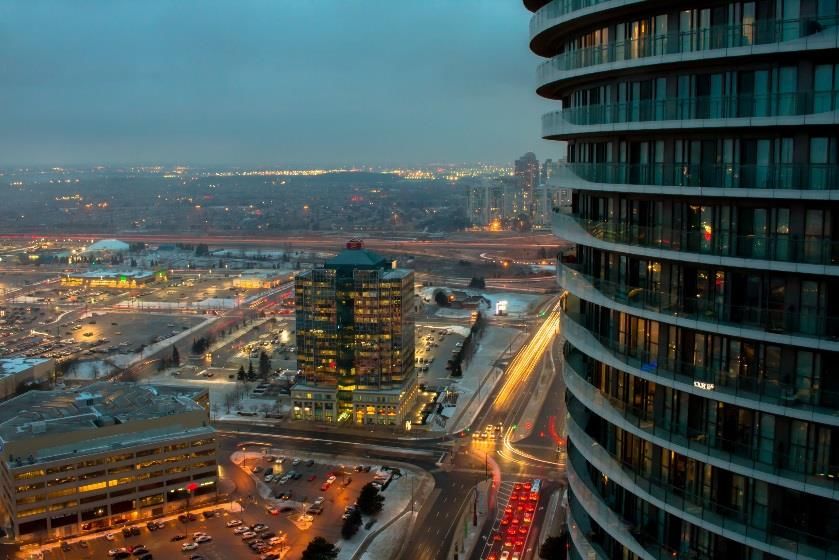
6                                                                         Office Outlook | Canada | 2018

Office clock

Reading the clock

JLL’s office clock demonstrates where each market sits
within its real estate cycle. Markets generally move
clockwise around the clock. Geographies on the left side of
the clock are generally landlord-favourable, while markets
on the right side of the clock are typically tenant-
favourable.

                                      Peaking                 Falling
                                        phase                 phase

Toronto,
Vancouver

                                         Rising               Bottoming
                                         phase                phase

                                                                              Edmonton, Halifax,
       Montreal                                                               Winnipeg
                                                                              Quebec city
                                                                              Ottawa, Calgary

 Source: JLL Research
7

     Local
    markets
Downtown
                                                                                                                                 Toronto
Can Downtown get any tighter? Yes, it can and
yes, it will.
  • Looking for space downtown? It’s going to be a tight squeeze. Vacancy                                                          Fundamentals                                   Forecast
    dropped 100 basis points this quarter to reach 3.4 percent, a new record                                                       YTD net absorption                      1,096,906 s.f. ▲
    low for the market!                                                                                                            Under construction                      4,482,966 s.f.     ▲
  • The market absorbed over 725,000 s.f. with no signs of demand slowing.                                                         Total vacancy                                      3.4%    ▼
  • With the announcement of 160 Front St. W., committed construction in
    Downtown Toronto totals over 9 million s.f., nearly 20.0 percent of Class                                                      Average asking rent (gross) $56.15 p.s.f.                  ▲
    A inventory downtown!                                                                                                          Concessions                                      Falling   ▼
Toronto’s economy continues to grow at a brisk pace with over 63,000 jobs
                                                                                                                                   Supply and demand (s.f.)                      Net absorption
added to the market in Q2. Office-using industries grew by over 2.3 percent.                                                                                                     Deliveries
Leading contributors to this growth include professional, scientific, and                                                          3,000,000
technical services as well as finance, insurance, and real estate. Both
industries grew by 6.4 percent for a combined total of 46,300 jobs added.                                                          2,000,000

Downtown positive absorption and leasing activity continue to accelerate                                                           1,000,000
past expectations as well. The market posted over 725,000 s.f. of positive net
absorption this quarter, driving the already-tight vacancy rate down to a                                                                   0
record low of 3.4 percent! And it’s only going to get tighter from here as Q2                                                                       2015         2016        2017      YTD 2018
saw a notably higher-than-average amount of leasing activity. Tech incubator
OneEleven expanded by 49,000 s.f. at 325 Front St. W. while Google leased a
total of 47,000 s.f. on the last two available floors at 100 Adelaide St. W., the                                                   Total vacancy
newest office tower downtown. And that’s not all.
                                                                                                                                                        6.9%
Two more tenants will be moving downtown from the suburbs after                                                                         5.6%
                                                                                                                                                                        4.6%
completing the largest deals of Q2. Tim Hortons will relocate their Oakville HQ                                                                                                        3.4%
to nearly 55,000 s.f. of podium space at 130 King St. W. in 2019. Ontario
Teachers Pension Plan will anchor Cadillac Fairview’s 160 Front St. W. leasing
240,000 s.f. on 9 floors. OTPP will be moving from their current North Yonge
                                                                                                                                        2015            2016            2017         Q2 2018
HQ when the 1.2-million-square-foot office tower is completed in Fall 2022.
Outlook
With the announcement of 160 Front St. W. and The Well reported to be in the                                                       Average asking net rents ($/s.f.)                     Class A
                                                                                                                                                                                         Class B
final stages of anchor negotiations, we currently track over 9 million s.f. of
                                                                                                                                   $40.00
committed construction, most of which will arrive in 2021/2022. That’s the
largest area under construction in almost three decades. It’s clear that the                                                       $30.00
market needs the supply but the question shifts to how tight the market                                                            $20.00
becomes in the lead-up to 2021. Is a 0.0 percent vacancy so unfeasible? At the
current momentum of demand, we’re 12 months or less from a 0.0 percent                                                             $10.00
vacancy rate. It’s a distinct possibility that’s getting closer and closer to reality.                                              $0.00
                                                                                                                                                 2015          2016         2017       Q2 2018

© 2018 Jones Lang LaSalle IP, Inc. All rights reserved. All information contained herein is from sources deemed reliable; however, no representation or warranty is made to the accuracy thereof.
Toronto West

Toronto West remains a tenants market as major
tenants continue to right size
                                                                                                                                   Fundamentals                                     Forecast
  • Toronto West vacancy edged up 40 basis points this quarter, reversing a
    downward trend since 2015                                                                                                      YTD net absorption                          106,445 s.f. ▲
  • Almost 300,000 square feet of new supply was completed this quarter                                                            Under construction                          637,976 s.f.     ▶
  • Despite high vacancy, average gross rental rate rose a modest 1.3                                                              Total vacancy                                      16.1%     ▶
    percent year over year                                                                                                         Average asking rent (gross) $30.06 p.s.f.                    ▶
A strong Toronto area economy and a Downtown vacancy rate at only 3.4                                                              Concessions                                        Stable    ▶
percent has so far failed to create a significant spillover of activity to the
Toronto West market leaving vacancy rates elevated. A major cause for this                                                         Supply and demand (s.f.)                      Net absorption
persistently high vacancy is that many of the largest tenants in the region have                                                                                                 Deliveries
                                                                                                                                   1,500,000
been rightsizing out of inefficient, underused and aging office space. This
                                                                                                                                   1,000,000
quarter, General Electric, signed a 75,000 square foot deal at 1919 Minnesota
Court. They will be reducing their footprint by over 160,000 square feet as they                                                     500,000
move out of their older, underused 242,000 square foot campus at 2300                                                                       0
Meadowvale Boulevard and into a near new, more efficient building. This
quarter RSA also completed their move out of over 200,000 square feet at 2225                                                       -500,000
                                                                                                                                                    2015         2016          2017     YTD 2018
Erin Mills Parkway into the brand new 2-8 Prologis Boulevard, reducing their
footprint by about 50,000 square feet in the process. The Sheridan Park area is
now 41.2 percent vacant due to RSA’s move and SNC Lavalin’s recent right
size into 2251 and 2285 Speakman Drive which caused a 136,000 square foot                                                           Total vacancy
reduction in their footprint. In addition to these right sizes, Microsoft’s recent                                                     17.2%
135,000 square foot deal at 81 Bay Street in downtown Toronto, makes the
                                                                                                                                                                                       16.1%
future of their current suburban office location uncertain.                                                                                             15.7%           15.6%

There has, however, been moderate leasing activity this quarter. In addition to
GE, Campbells took over 50,000 square feet at 2845 Matheson Boulevard East.
They are new to the office market as they will be moving out of their current                                                           2015            2016            2017          Q2 2018
Mimico industrial facility. Soti also continued to expand in the Heartland area,
taking the rest of the Revera sublease at 55 Standish Drive and Weight
Watchers took 22,000 square feet at the under construction 1415 Joshuas                                                            Average asking net rents ($/s.f.)                     Class A
                                                                                                                                                                                         Class B
Creek Drive.
                                                                                                                                   $20.00
Outlook
Vacancy in the Toronto West market is expected to remain stable in the
coming quarters. While 300,000 square feet of deliveries pulled vacancy                                                            $15.00
upwards this quarter, a slower overall construction pipeline should help
prevent continued upswings in vacancy. Rental rates are also expected to be
stable as persistently high vacancy will hamper rental rate increases.                                                             $10.00
                                                                                                                                                 2015           2016        2017        Q2 2018

© 2018 Jones Lang LaSalle IP, Inc. All rights reserved. All information contained herein is from sources deemed reliable; however, no representation or warranty is made to the accuracy thereof.
Toronto North &
East
Northeast office market sees a burst of activity in the
second quarter
Fundamentals Forecast
• Vacancy jumped 80 basis points this quarter due to a few large moves
and reductions this quarter YTD net absorption -161,555 s.f. ▶
• Leasing volume of major leases, over 20,000 square feet, increased three Under construction 336,820 s.f. ▶
fold over Q1 Total vacancy 11.2% ▶
• Average gross rental rates have increased 2.0 percent over Q2 2017 Average asking rent (gross) $32.03 p.s.f. ▲
It was a busy quarter in the Northeast Toronto market. Leasing volume for Concessions Stable ▶
major leases was up threefold over the first quarter of 2018 and the average
quarterly volume in 2017. North Yonge saw the bulk of this activity with OLG Supply and demand (s.f.) Net absorption
signing a renewal expansion for 144,000 square feet. Other new deals include Deliveries
1,000,000
Celestica for 57,000 square feet, Smith + Anderson for 56,000 square feet,
Eckler for 50,000 square feet, Duca Credit Union for 30,000 square feet and 500,000
Equifax who took an additional floor at 5700 Yonge Street. This leasing will
help shore up the rising vacancy in the North Yonge corridor and keep that 0
node in balanced market territory. Additionally, Parkway Place, in the
Consumers Road node also saw notable activity with Nordia and North York -500,000
2015 2016 2017 YTD 2018
General signing new deals for over 40,000 square feet while Shoppers Drug
Mart completed a renewal. In addition to leasing, the property owner also
changed hands as Agellan RIET sold the largely leased up complex to a
foreign investor, summing up an active quarter at the complex. Total vacancy
11.2%
11.0%
Vacancy did spike by 80 basis points in the overall Suburban Northeast 10.8%
market this quarter. However, this is due to only a few key moves. Sony 10.3%
completed their right size out of 140,000 square feet at 115 Gordon Baker for
40,000 square feet at the Atria complex, Harlequin (HarperCollins) vacated
110,000 sf at 225 Duncan Mill to consolidate downtown and IBM brought
170,000 square feet of their space at 3600 Steeles Avenue East to the market. 2015 2016 2017 Q2 2018
Still, with robust leasing activity in the region this is likely a one time spike
than a longer term trend.
Average asking net rents ($/s.f.) Class A
Class B
Outlook
$20.00
Vacancy is expected to remain near 11.0 percent in the coming quarters. While
tenants like SAP and Capitol One will be reducing their presence in the region,
expanding tenants such as OLG and Equifax along with new tenants like $15.00
Nordia should keep vacancy stable. With a relatively balanced market, rents
are expected to continue to increase near the rate of inflation.
$10.00
2015 2016 2017 Q2 2018
© 2018 Jones Lang LaSalle IP, Inc. All rights reserved. All information contained herein is from sources deemed reliable; however, no representation or warranty is made to the accuracy thereof.Ottawa
Ottawa is finding its footing amidst market-wide growth
and newly announced developments
• Unemployment fell to 4.4 percent this quarter Fundamentals Forecast
• Kanata, a submarket with a traditional vacancy percent in the mid to YTD net absorption -24,610 s.f. ▲
high teens, has posted a total vacancy of 9.8 percent this quarter ▲
Under construction 63,058 s.f.
• The city has approved three Albert Street residential developments,
including Trinity Group’s Trinity Centre at Bayview Station, which will Total vacancy 10.2% ▼
deliver 200,000 s.f. or more of office space in the coming years Average asking rent (gross) $33.29 p.s.f. ▶
Ottawa’s labor market has hit new heights this quarter with 11,800 net new Concessions Stable ▼
jobs added to office-using industries. Public administration has largely fueled
this growth, with 7,700 public sector jobs added but they weren’t the only Supply and demand (s.f.) Net absorption
ones. Professional, scientific, and technical services added 5,700 jobs while Deliveries
business, building, and other support services added 5,200 jobs. The result is 1,000,000
a significant drop in unemployment to 4.4 percent, the lowest unemployment
500,000
rate the market has seen since before 2001.
Accordingly, Ottawa, specifically Kanata, has seen exceptional demand this 0
quarter from diverse industries such as the autonomous vehicle sector, 5G
networks, SaaS, and the burgeoning cannabis industry. Ford Motor Company -500,000
has leased the last block of space at 700 Palladium Dr. in Kanata, totaling 2015 2016 2017 YTD 2018
60,000 s.f., and is reportedly in the market for more. Huawei expanded by
20,000 s.f. at 303 Terry Fox Dr., bringing their total footprint to over 100,000
square feet. This is only the tip of the iceberg. With several tenants over Total vacancy
100,000 s.f. in the market for space, we are seeing a level of growth in Ottawa
not seen for quite some time. 10.9%
10.6%
On the supply side, the Trinity Centre project at Bayview Station has been 10.1% 10.2%
approved by the city and has committed to deliver 200,000 s.f. or more in the
coming years. This will be the second development in the area after Dream
REIT’s Zibi delivers 245,000 s.f. over two phases from 2019 – 2021. In the long
term, the Department of National Defense has announced a plan to build 2015 2016 2017 Q2 2018
another HQ of 800,000 s.f. in close proximity to the new HQ on Carling Avenue.
As the market’s largest office occupier, accounting for nearly 50.0 percent of
occupied space in the national capital region, the federal government’s Average asking net rents ($/s.f.) Class A
Class B
growing activity, indicated by the recent increase in RFIs and RFPs, will be
critical to the state of the market going ahead.
Outlook $20.00
It’s been an eventful quarter for Ottawa and the future continues to grow
brighter. But the key factor moving ahead will be consistency in growth. $10.00
Demand will have to keep pace in order to truly cement a turnaround for the
market. $0.00
2015 2016 2017 Q2 2018
© 2018 Jones Lang LaSalle IP, Inc. All rights reserved. All information contained herein is from sources deemed reliable; however, no representation or warranty is made to the accuracy thereof.Montreal
Slow but steady transition into a Landlords’ Market
• Options for tenants decreasing in Downtown Market, vanishing in Mile- Fundamentals Forecast
End/Mile-Ex. YTD net absorption -242,908 s.f. ▲
• The Greater Montreal Area’s (GMA) unemployment rate was stable at 6.0 Under construction 2,447,154 s.f. ▼
percent in Q2. Total vacancy 13.5% ▼
• The GMA total vacancy rate slightly increased by 10 basis points quarter- Average asking rent (gross) $29.67 p.s.f. ▲
over-quarter to 13.5 percent. Concessions Stable ▼
The Greater Montreal Area’s office leasing market continues to heat up as close to
250,000 square feet of space was absorbed during the second quarter of 2018. Supply and demand (s.f.) Net absorption
Deliveries
2,000,000
In Downtown Montreal, the addition of new spaces for lease in the Downtown
South market was mostly compensated by the arrival of new tenants in Class C 1,000,000
buildings in Downtown East. As a result, the overall picture changed very little for 0
the Downtown market as a whole. However, ongoing deals are expected to
continue the current transition from tenants’ to landlords’ favourable market -1,000,000
conditions. -2,000,000
2015 2016 2017 YTD 2018
The Mile-End/Mile-Ex, once again, drove market activity in the Midtown market. In
Midtown North, a few new leases in the Mile-Ex area partially compensated for
new spaces being offered on the Metropolitan highway axis. In Midtown-East,
leasing transactions for some of the remaining, smaller available spaces in the Total vacancy
Mile-End added up to strong leasing activity in the Plateau and Angus areas.
12.6% 12.9% 12.8% 13.5%
Three large direct and sublet availabilities were added to the market in the
Technoparc, which pushed up the overall vacancy rate in the Saint-Laurent
submarket to 22.4 percent, a 140 basis point increase from the previous quarter.
These spaces are not expected to remain vacant for long; Technoparc, which was
already sought after by high-tech companies, will soon have its own station on
the REM light rail network currently under construction, and will be linked to 2015 2016 2017 Q2 2018
Downtown Montreal and other areas of the GMA by transit, which will be a game
changer for this node.
Average asking net rents ($/s.f.) Class A
Outlook Class B
Current trade conflicts with the United States are sources of uncertainty for $20.00
Canada’s export-oriented economy. Access to the US market is vital for many
important sectors such as automotive and commodities. But Montreal’s economy
is increasingly based on high-tech and creative industries, which are less likely to $10.00
be affected by trade disputes. Montreal is in no way immune to the damages that
a prolonged trade conflict would cause, but has strong industry and great clusters
to help navigate an upcoming storm. $0.00
2015 2016 2017 Q2 2018
© 2018 Jones Lang LaSalle IP, Inc. All rights reserved. All information contained herein is from sources deemed reliable; however, no representation or warranty is made to the accuracy thereof.Montréal
La transition vers un marché de propriétaires se
poursuit
Fondamentaux Prévisions
• Le options pour les locataires se raréfient au Centre-Ville, disparaissent dans le
Mile-End/Mile-Ex Absorption totale nette CDA -242 908 pi. ca ▲
• Le taux de chômage dans le Grand Montréal était stable à 6,0 % au T2.
En construction 2 447 154 pi.ca ▼
Taux d’inoccupation global 13,5% ▼
• Le taux d’inoccupation du Grand Montréal a augmenté de 10 points de base à
13,5 %
Moyenne des loyers bruts $29,67 / pi. ca. ▲
Allocation Stable ▶
Le marché de location de bureau du Grand Montréal a poursuivi sa lancée au
second trimestre de 2018, avec l’absorption de près de 250 000 pieds carrés L’offre et la demande (pi. ca) Absorption totale nette
Constructions complétées
d’espace. 2 000 000
Au Centre-Ville, la venue de nouveaux locataires au Centre-Ville Est compense en 1 000 000
grande partie pour l’arrivée sur le marché de nouveaux espaces au Centre-Ville Sud. 0
La situation du Centre-Ville dans son ensemble a, par conséquent, très peu changé.
Ceci étant, des transactions en cours contribuent à poursuivre la transition du -1 000 000
Centre-Ville d’un marché de locataires à un marché plus favorable aux propriétaires -2 000 000
d’immeubles. Le Mile-End/Mile-Ex a connu une forte activité, malgré la rareté de 2015 2016 2017 CUM 2018
grands espaces dans ce quartier. Dans le Centre-de-l’Île Nord, la signature de
nouveaux baux dans le Mile-Ex a permis de mitiger la venue sur le marché de
nouveaux espaces sur l’axe de l’Autoroute Métropolitaine. Dans le Centre-de-l’Île
Taux d’inoccupation global
Est, des transactions pour certains des espaces de plus petite taille dans le Mile-End
se sont ajoutées à une forte activité dans les secteurs Angus et du Plateau.
12,6% 12,9% 12,8% 13,4%
L’ajout sur le marché de trois espaces de grande taille dans le Technoparc a fait
monter le taux d’inoccupation du sous-marché de Saint-Laurent à 22,4 %, une
augmentation de 140 points de base au cours du trimestre. Ces locaux ne devraient
pas rester vacants très longtemps; le Technoparc, déjà prisé par les entreprises de
haute technologie, aura bientôt sa propre station du Réseau express métropolitain
2015 2016 2017 T2 2018
(REM) actuellement en construction, ce qui rendra ce secteur encore plus attrayant.
Perspectives
Les présents conflits commerciaux avec les États-Unis sont une source d’incertitude Moyenne des loyers nets ($/pi. ca) A B
pour l’économie canadienne, certains secteurs comme l’automobile et les
commodités étant particulièrement dépendants de l’accès au marché américain. 20,00$
20.00$
Dans le cas spécifique de Montréal, la croissance économique s’appuie de plus en
plus sur les industries créatives et de hautes technologies, qui sont moins
susceptibles d’être affectées par les disputes commerciales. Montréal n’est pas 10,00$
10.00$
immunisée contre les dommages que pourrait causer un conflit commercial
prolongé, mais ses nouvelles grappes industrielles l’aideront à traverser la tempête. 0,00$
0.00$
2015 2016 2017 T2 2018
© 2018 Jones Lang LaSalle IP, Inc. All rights reserved. All information contained herein is from sources deemed reliable; however, no representation or warranty is made to the accuracy thereof.Edmonton
Signs of recovery after a slow start to 2018
Fundamentals Forecast
• Demand is increasing as total vacancy in the city decreased by 190 basis YTD net absorption 26,375 s.f. ▶
points to 16.1 percent. Although, part of this increase is due to the Under construction 981,944 s.f. ▼
removal of a number of buildings from inventory. ▲
Total vacancy 16.1%
• Edmonton bounced back this quarter with positive net absorption of
102,139 square feet. Average asking rent (gross) $32.44 p.s.f. ▶
• Combined class A and AA Downtown average asking net rents averaged Concessions Stable ▶
$22.59 per square foot while Class B averaged $14.16 per square foot.
The Edmonton Office market improved this quarter following a slow start to 2018. Supply and demand (s.f.)
Net absorption
Deliveries
Amid higher leasing activity, the Downtown market recorded 44,052 square feet of 1,200,000
positive net absorption. In addition, downtown also experienced a welcome
contraction in inventory of 2.7 percent from the disposition of Enbridge Tower
and HSBC Bank Place in the Financial Core representing a total of 411,514 square 200,000
feet. This shift in inventory decreased the Financial Core’s vacancy rate by 240
basis points to 14.5 percent. While ownership groups look to repurpose older
buildings for residential or mixed use, some properties are planned for extensive -800,000
redevelopment in response to the continued flight to quality in the Edmonton 2015 2016 2017 YTD 2018
market.
Total vacancy
Edmonton has an appetite for high-quality Class A space. In the Financial Core,
16.4% 16.1%
Weir Bowen leased 15,135 square feet at Scotia Place, London Life took 11,198 15.2%
square feet at Bell Tower, and Crowe McKay will move into 14,611 square feet at 9.5%
Manulife Place. The merger of Jacobs Engineering and CH2M Hill resulted in
CH2M occupying two floors at First & Jasper and Trust Science took another floor
totaling 33,543 square feet. GEC Architecture committed to 10,115 square feet in
West Block, the new up-coming development in the 149 Street submarket.
2015 2016 2017 Q2 2018
Outlook
While Edmonton continues to diversify its economy and recover from post-energy
crisis lows, the market will remain tenant favourable for some time. However, the
Average asking net rents ($/s.f.) Class A
historically high inventory of sublease space has diminished. Large blocks of Class B
space in Manulife Place, First & Jasper, and TD Tower have been or will soon be $30.00
absorbed from inventory ushering in greater stability. New residential proposals
by an array of developers hope to build upon previous successes and capitalize $20.00
on the growing demand for downtown living. This demand is predicted to
alleviate office vacancy rates by reducing inventory levels as buildings are $10.00
disposed and repurposed for residential, hotel, or mixed use.
$0.00
2015 2016 2017 Q2 2018
© 2018 Jones Lang LaSalle IP, Inc. All rights reserved. All information contained herein is from sources deemed reliable; however, no representation or warranty is made to the accuracy thereof.Downtown
Calgary
Calgary’s slow economic recovery continues to affect
the downtown leasing market
Fundamentals Forecast
• Downtown vacancy remains elevated with over 10.4 million square feet
YTD net absorption -559,106s.f. ▲
of vacant office space
• Average asking net rent continues to decline, conveying the effects of the Under construction 428,599 s.f. ▶
Sublease market and low demand Total vacancy 23.8% ▶
• The flight-to-quality continues and is illustrated by the high vacancy rate Average asking rent (gross) $32.53 p.s.f. ▼
in downtown Class B (32.1%) and Class C (31.2%) properties Concessions Stable ▶
During the second quarter of 2018, downtown vacancy decreased by 10 basis Supply and demand (s.f.) Net absorption
Deliveries
points, resulting in more than 10.4 million square feet of vacant office space. 3,000,000
Of that vacancy, nearly a third is being offered by sub-landlords. Mirroring the
dominance of the energy industry in Calgary's core, the majority of available 1,000,000
sublease space is top tier, Class A, Centre Core space. Sub-landlords are
offering space at discounted rates, resulting in continued pressure on average -1,000,000
rents across the entire city. Downtown Calgary’s average gross rents have
-3,000,000
fallen to $32.53 from $34.61 per square foot in the previous quarter.
2015 2016 2017 YTD 2018
Calgary’s office tenants are still taking advantage of the abundance of Class A
space at discounted rates. Class B & C assets in Downtown saw the largest
increases in vacancy; an accurate representation of Calgary’s tenants flight- Total vacancy
to-quality. Calgary is the only major market in the country where downtown 23.1% 23.8%
21.1%
vacancy is higher and average net asking rents are lower than the suburban
market. With the current level of demand and the increasing levels of vacancy, 14.1%
it is expected that Downtown office rates will remain lower than Suburban
rates for the anticipated future.
Outlook 2015 2016 2017 Q2 2018
With Oil and Gas companies leaner from consolidation, many speculate the
downtown market has bottomed out. As a result, we can expect continued
leasing activity and low rental rates. Due to lower rental rates, and increased Average asking net rents ($/s.f.) Class A
Class B
leasing activity, a potential rebound in A/AA and Skyline property vacancy
$25.00
may occur, with companies taking advantage of tenant favourable deals. Two
$20.00
key factors that will impact the overall market and shape the economic future
in Calgary are the potential trade war looming with the US and the timing of $15.00
completion for the trans mountain pipeline. As a result, the recovery process $10.00
remains uncertain for Downtown Calgary. $5.00
$0.00
2015 2016 2017 Q2 2018
© 2018 Jones Lang LaSalle IP, Inc. All rights reserved. All information contained herein is from sources deemed reliable; however, no representation or warranty is made to the accuracy thereof.Suburban
Calgary
Calgary’s economy in recovery mode, while suburban
office leasing attempts to catch up
Fundamentals Forecast
• Suburban office vacancy is at 17.5 percent, an increase of 130 basis
YTD net absorption -382,475 s.f. ▼
points over last quarter
• Sublease availabilities are expiring, adding to existing head lease Under construction 425,071 s.f. ▼
vacancy rates Total vacancy 17.5% ▲
• Calgary is looking to energy innovation, and tech companies in order to Average asking rent (gross) $32.18 p.s.f. ▼
grow the economy through diversification Concessions Rising ▶
Calgary’s economy continues to show signs of growth, while the suburban Supply and demand (s.f.) Net absorption
Deliveries
office market endures large vacancy rates. Positive GDP growth
1,000,000
year-over-year, increased hiring by oil and gas companies, and Western Texas
Intermediate prices breaching the seventy dollar resistance for the first time
since November 2014 are all encouraging economic indicators in the first half 0
of 2018. These indicators, along with the purchase of the Trans Mountain
Pipeline by the Federal Government, leave Calgary’s economy poised for
sustained forward momentum. -1,000,000
2015 2016 2017 YTD 2018
While the economy appears to be recuperating, the suburban office market is
attempting to find balance. Both head lease and sublease vacancy has
increased from the first quarter of 2018 until present. The total suburban Total vacancy
office vacancy rate now sits at 17.5 percent, a 130 basis point increase over
20.5%
last quarter. Vacant sublease spaces from previous quarters are expiring, 16.5% 17.5%
adding to an already high head lease vacancy rate. Tenant incentive packages 14.3%
9.8%
continue to increase as landlords endeavor to maintain face rates and drive
leasing activity simultaneously. The suburban office market is in great
condition for start ups, small businesses, and established companies to take
advantage of a variety of space options and tenant favourable deals. 2014 2015 2016 2017 Q2 2018
Outlook
Calgary is looking to clean energy innovation and tech companies in order to Average asking net rents ($/s.f.) Class A
Class B
fill vacant office space and boost the economy. Even with rising oil prices and
$30.00
growing oil and gas employment over the past year, increased oil production
efficiency will limit available jobs below pre-recession levels. The success of
startups and the diversification of Calgary’s economy is vital to reducing office $20.00
vacancy rates. For now, tenants have control of the market, as landlords look
for creative solutions to lease vacant assets.
$10.00
2015 2016 2017 Q2 2018
© 2018 Jones Lang LaSalle IP, Inc. All rights reserved. All information contained herein is from sources deemed reliable; however, no representation or warranty is made to the accuracy thereof.Metro
Vancouver
Companies will need to be creative to allow growth in a
tightening market
Fundamentals Forecast
• Currently, only two ‘A’ Class buildings offer contiguous space of 15,000
YTD net absorption 690,964 s.f. ▲
square feet or more in the downtown core.
• Largest office lease in BC history was inked at the new Canada Post Under construction 2,189,510 s.f. ▲
office development by a prominent tech company. Total vacancy 8.0% ▼
• Downtown direct asking net rents have increased by 13.46 percent year Average asking rent (gross) $40.98 p.s.f. ▲
over year. Concessions Stable ▶
The downtown market continues its hot streak with a year to date absorption of Supply and demand (s.f.) Net absorption
Deliveries
548,029 square feet, which has already surpassed 2017’s total of 488,401 square
feet. The increased absorption has resulted in vacancy rates dropping rapidly, total 3,000,000
vacancy has dropped 210 basis points from 7.2 percent in Q4 2017 to 5.1 percent in
2,000,000
Q2 2018. Vacancy rates are predicted to drop further as a total of 500,000 square
feet of space is currently vacant and leased with occupancy dates for 2018.
1,000,000
As the downtown market vacancy rate continues to decline and rental rates
0
continue to rise as a result, companies will need to be flexible when it comes to 2015 2016 2017 YTD 2018
growth in the immediate future. Large blocks of space are limited in the downtown
market and those that are available are going for a premium. Rates for AAA quality
space now go for between $40-$45 direct asking net rent. We will see some relief in Total vacancy
2020 when a predicted 580,000 square feet of new space comes to market, but it
11.8%
will not be until late 2021 early 2022 that we will see significant amounts of new 10.5%
supply that will move downtown into a more balanced market. 8.3% 8.0%
In the meantime the suburban markets can offer large blocks of quality space to
companies willing to be flexible. Back office employees that are not required to be
downtown could be relocated to the suburban markets such as Burnaby,
Richmond and Surrey. That being said, the continued growth of a robust BC 2015 2016 2017 Q2 2018
economy means downtown companies will be competing with established
suburban companies also looking to expand.
Average asking net rents ($/s.f.) Class A
Class B
Outlook
$30.00
We anticipate continued strong demand for office space in the Metro Vancouver
market as many Canadian and U.S. companies continue to grow and relocate here.
2018 will see another year of strong absorption; however, we can expect to see $20.00
absorption begin to slow as the availability of space reaches historic lows. Until the
new supply arrives, tenants will be competing for spaces, particularly full floor $10.00
opportunities, likely resulting in increased rental rates and a flight to the suburbs.
$0.00
2015 2016 2017 Q2 2018
© 2018 Jones Lang LaSalle IP, Inc. All rights reserved. All information contained herein is from sources deemed reliable; however, no representation or warranty is made to the accuracy thereof.18 Office Outlook | Canada | 2018 Want more information? Thomas Forr Research Manager +1 416 304 6047 Thomas.Forr@am.jll.com
About JLL                                                                          About JLL Research

JLL (NYSE: JLL) is a leading professional services firm that                       JLL’s research team delivers intelligence, analysis and
specializes in real estate and investment management. A                            insight through market-leading reports and services that
Fortune 500 company, JLL helps real estate owners,                                 illuminate today’s commercial real estate dynamics and
occupiers and investors achieve their business ambitions.                          identify tomorrow’s challenges and opportunities. Our
In 2017, JLL had revenue of $7.9 billion; managed 4.6 billion                      more than 400 global research professionals track and
square feet, or 423 million square meters; and completed                           analyze economic and property trends and forecast future
investment sales, acquisitions and finance transactions of                         conditions in over 60 countries, producing unrivalled local
approximately $170 billion. At the end of 2017, JLL had                            and global perspectives. Our research and expertise, fueled
nearly 300 corporate offices, operations in over 80                                by real-time information and innovative thinking around
countries and a global workforce of 82,000. As of December                         the world, creates a competitive advantage for our clients
31, 2017, LaSalle had $58.1 billion of real estate assets                          and drives successful strategies and optimal real estate
under management. JLL is the brand name, and a                                     decisions.
registered trademark, of Jones Lang LaSalle Incorporated.
For further information, visit www.jll.com.

©2018 Jones Lang LaSalle IP, Inc. All rights reserved. No part of this publication may be reproduced by any means, whether graphically, electronically, mechanically
or otherwise howsoever, including without limitation photocopying and recording on magnetic tape, or included in any information store and/or retrieval system
without prior written permission of Jones Lang LaSalle. The information contained in this document has been compiled from sources believed to be reliable. Jones
Lang LaSalle or any of their affiliates accept no liability or responsibility for the accuracy or completeness of the information contained herein and no reliance
should be placed on the information contained in this document.
You can also read