ST RAT EGIC PERSPECT I V ES FOR EUROPEAN SOL AR PV MANUFACTURING 2021
←
→
Page content transcription
If your browser does not render page correctly, please read the page content below
ST RAT EGIC PERSPECT I VES FOR EUROPEAN
      SOL AR PV MANUFACTURING — 2021
               EUROPEAN SOLAR MANUFACTURING - EUROPEAN PV RENAISSANCE

The European Solar Manufacturing Council (ESMC) is the organisation representing the interests of
the European PV manufacturing industry. The Council relies on key industrial companies, organisations
and research centers active in the PV sector rooted in Europe. ESMC aims at promoting and supporting
the PV manufacturing industry and its value chain at the European level, speaking with one voice.

Contact: Dr. Johan Lindahl
ESMC’s Secretary General ad Interim
lindahl@esmc.solar

www.esmc.solar
Address: Energy Hub – 146 Rue Royale –
1000 Brussels, Belgium

                                                                                                    1
TABLE OF CONTENTS
     ............................................................................................................................................................. 1
1.      FOREWORD .................................................................................................................................... 3
2.      GLOBAL AND EUROPEAN PV MARKET DEVELOPMENT ......................................................... 4
3.      THE SEGMENTATION OF THE PV MARKET ................................................................................ 6
4.      PV MARKET FORECAST................................................................................................................ 7
5.      GLOBAL AND EUROPEAN INDUSTRY STATUS ......................................................................... 8
6.      PV, AN INDUSTRIAL ADDED VALUE FOR EUROPE .................................................................. 9
7.      ESMC’S STRATEGY ...................................................................................................................... 13
            SUPPORT PV MANUFACTURING IN EUROPE THROUGH APPROPRIATE POLICIES ...... 13
        SUPPORT PV MANUFACTURING IN EUROPE THROUGH APPROPRIATE MARKET
     DEVELOPMENT................................................................................................................................ 14
            ALLIANCE BUILDING .............................................................................................................. 15
            SUPPORT R&D FOR PV WITHIN THE ENERGY TRANSFORMATION .................................. 16

                                                                                                                                                                  2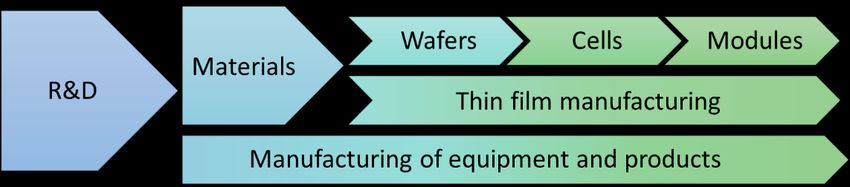
1.   FOREWORD

The European PV manufacturing industry has the last decade led a dwindling existence. However, the
European Solar Manufacturing Council ESMC sees an opportunity for a European solar renaissance
with great potential of creating strong and sustainable Intereuropean value chains. The European
Union was the second largest PV Market in 2020, after China, and holds great experience and technical
knowledge, as the large-scale global market development to a large extent originated from Europe.
The current and projected European PV capacity expansion is dependent on import of both materials
and components. At the same time, our European industry actors can deliver high-quality products
and provide jobs and economic growth in the European Union. ESMC recognizes a window of
opportunity, induced by a technological change, to shift the dependence on imported materials and
components to economic growth, jobs and a strengthened European manufacturing industry
positioning.

In Europe, as in the world, increasing the share of renewable energy capacity is a vital part of the
transformation to a climate-neutral energy system. At the same time, enormous economic and political
effort is focused around recovering the EU economy from the ongoing COVID-19 pandemic.
Strengthening the European PV manufacturing industry could be an effective tool for creating jobs and
values in the union, while at the same time increasing our energy security and regaining control of our
energy transition.

Therefore, 2021 will be marked by efforts to bring the European PV manufacturing industry's
perspective into the political discussions and respectively appropriate decisions for the competitive,
fast growing, and sustainable development of the European PV manufacturing industry. The goal will
be focused on including the European PV industry in the EU facilities and funds assigned for the Green
Deal, as well as creating favourable policies for the EU produced PV modules, cells, materials,
equipment, and peripherals, up to electrolysers for the production of the green hydrogen needed to
de-carbonize industry. ESMC proposes to build powerful alliances with associated sectors when
needed, utilising the many implementations of solar PV and including it into multiple layers of the
European energy transformation process.

As the Secretary General of ESMC, I am pleased to be able to present this strategy document, which
includes our core values, focus areas and background analyses with concrete forecasts and key
values, to emphasize the potential of the European PV manufacturing industry.

                                                                                 Dr. Johan Lindahl
                                                                      Secretary General ad Interim
                                                              European Solar Manufacturing Council

                                                                                                     3
2. GLOBAL AND EUROPEAN PV MARKET DEVELOPMENT
GLOBAL PV MARKET STATUS
Solar photovoltaics (PV) has developed fast during the recent decade. So fast that it has become a
mainstream source of newly installed electricity capacities, economically competitive in a rapidly
growing number of countries, substantially contributing to decarbonizing the power mix and
electrifying the world.
Looking back, the global PV market crossed the annual 100-Gigawatt (GW) mark in 2017 (103 GW). After
a year of stabilization in 2018 with approximately 104 GW installed, the PV market grew significantly
again in 2019 and 2020, adding 112 GW and 139 GW, respectively, of installations globally, and reaching
more than 760 GW of cumulative installed capacity today1. However, this global growth hides
differentiated market developments: the Chinese market, which remains the largest market by far,
substantially declined from 44.3 GW in 2018 to 30.1 GW in 2019 and grew back up to 48.2 GW in 2020.
On the contrary, the PV market outside of China experienced an important growth from 59 GW in 2018
to 79 GW in 2019 and 90 GW in 2020. After China, the European Union was the second global PV market
in 2020 with a preliminary addition of 19.6 GW, followed by the USA (19.2 GW).
With growth on all continents, PV reached new countries and expanded fast at the beginning of 2020.
Then, the COVID-19 pandemic spread over the world, but the growth trend of solar PV remained
unabated for the rest of the year. Indeed, after a first half year full of uncertainties, the market proved
its resilience in all regions. In conclusion, ESMC estimates that between 130 to 140 GW of solar PV were
connected last year worldwide.
160 800 EU-28 + CH, NO, UA 760
China
Cumulative Installed Capacity [GW]
139 USA
Annual Installed Capacity [GW]
140 700
Japan 623
112 600 India
120 Other
103 104 512
100 500
407
77
80 400
305
60 50 300
228
38 40 178
40 31 30 200 138
17 100
70
20 8 100
22 39
0 0
2009
2010
2018
2011
2012
2015
2013
2014
2017
2016
2019
2020e
2009
2010
2011
2012
2013
2014
2016
2017
2018
2019
2015
2020e
Figure 1. Evolution of the global annual and cumulative installed capacity with focus on main markets (Source: IEA PVPS).
SOLAR PV GROWING IN EUROPE
In 2019, the European Union became the second largest PV market after China for the first time in
years, with 16,0 GW installed, nearly doubling its annual additions from the 8,4 GW reported in 2018. In
2020, this encouraging figure was exceeded, as it is estimated that 19 GW were installed in the EU. The
1
See among others IEA PVPS Task 1 Trends in PV applications 2020 or Snapshot of Global PV
Markets 2021
4record value of 23,2 GW installed in 2011 (when the EU had about 80% of the global market share) has
however not been reached again.
The European PV market went down due to the decrease of financial incentives after 2011, and the
systemic opposition from incumbent actors of the electricity markets. With punitive measures in Spain,
Italy, Belgium, Romania and Czech Republic, with changes of policies in Germany, Greece and with
market limitations in France as well as in several of the countries previously mentioned, the annual
European PV market went down from 23 to 5-6 GW during several years. The transition from Feed-In
Tariffs (and similar schemes) to tenders, merchant PV and self-consumption schemes was chaotic
and lacked vision, ensuring a collapse of the PV market in several key markets. Of course, the growth
that drove the market in some countries was not sustainable, but a better managed transition would
have avoided transforming the leader of the global PV market into a laggard. The European Union has
not yet reached its market level of 2011 and will not reach it before 2021 at best.
However, the new dynamics are positive, and the regulations tend to stabilize, offering a better
perspective than a few years ago. The largest European market in 2020 was Germany (4.9 GW),
followed by Netherlands (3.0 GW), Spain (2.8 GW), Poland (2.6 GW), Ukraine (1.5 GW), France (1.2 GW)
and Belgium (1.0 GW). Other European countries are showing positive market developments, such as
Italy, Hungary, Greece and Sweden.
The following figure highlights the evolution of the European PV market and its slow recovery after
almost a lost decade. Imbalances between countries are still visible, with the Netherlands installing
significantly more per inhabitant than Spain or Germany.
25
Spain
20
Germany
Annual installed capacity [GW]
Netherlands
15 France
Poland
10 Italy
Hungary
Belgium
5
Remaining countries
EU-27 +UK +NO +CH
0
2009 2010 2011 2012 2013 2014 2015 2016 2017 2018 2019 2020e
Figure 2. Evolution of annual PV Installations in Europe (Source: IEA PVPS).
53. THE SEGMENTATION OF THE PV MARKET
The PV market consists of a combination of several segments with different characteristics and actors,
and increasingly, components. Historically, the PV market developed due to policy decisions, which
shaped the segments in one way or another in accordance with local constraints. This is clearly visible
in Spain that was dominated by ground-mounted PV applications, while Belgium focused on distributed
applications. Other countries made different choices but, overall, these are consistently levelling and
shifting towards PV deployment strategies based on key parameters linked to population density, solar
irradiation, electricity prices and socio-economic aspects.
Globally, in both 2019 and 2020, an accelerated development of distributed PV installations can be
observed. At a lower magnitude, floating PV (FPV) and agricultural PV (APV), also called agrivoltaics,
have grown as emerging market segments. In both cases, only a few GW have been developed so far,
but the interest is rising fast, and the cost gap of these solutions compared to conventional ones is
decreasing. Building integrated PV (BIPV) remains presently as a niche market of the distributed
segment, mainly concentrated in the residential sector, compared to rooftop solutions or Building-
Added PV (BAPV). The annual deployment of distributed PV applications remained constant for many
years, as growth was concentrated in the utility-scale segment, before it took off again in 2017, being
source to a large part of the PV market expansion witnessed that year. Since then, the global market
has been more balanced, as shown below.
ROOFTOP UTILITY SCALE
140
Annual installed capacity [GWp]
120
100
87
80 75
61 68
60
56
40
33
21 23
20 14 12 41 48
38 32
16 17 16 17 17 20
0
2011 2012 2013 2014 2015 2016 2017 2018 2019 2020e
Figure 3. Segmentation of global PV installations 2011 – 2020 (Source: IEA PVPS).
Market dynamics at segment level cannot be dissociated from the willingness to develop
manufacturing in Europe. The utility-scale segment clearly witnesses constraints different from those
in the distributed segment. In terms of cost for example, reaching the lowest capital expenditures is
often considered as the main, if not the only, metric of importance in the utility-scale segment. On the
other hand, in the distributed segment, PV system cost is less of a constraint, considering the higher
level of retail electricity prices and the support schemes that still exist in many locations. But other
constraints exist for rooftop installations. For example, available surface remains limited compared to
for ground-mounted installations, thereby favouring PV modules with the highest conversion efficiency
possible. Also, aesthetics is crucial for rooftop PV installation, in particular in the residential segment.
Homeowners often ask for PV modules with uniform colouring, i.e. requiring a back sheet and a frame
of the same dark colour as the PV cells, which can also in some cases be black. In addition,
6sustainability of the components can be an important factor for individuals or companies investing in
PV systems for their real estate property.
While reaching low cost levels for PV is essential, in some segments, the competitiveness of PV
systems is already granted and could sustain slightly higher prices. Hence, the choice of developing
some market segments rather than others is not politically neutral. European manufacturers could
benefit (and it is already partially the case) of more targeted development in some segments,
especially with regards to distributed PV.
25 ROOFTOP UTILITY SCALE
Annual installed capacity [GWp]
20
10
15 6 9
8
10
4
2
13 12 4
5 4 2 2 10
9
6 6
3 4 4 5
0
2011 2012 2013 2014 2015 2016 2017 2018 2019 2020e
Figure 4. Segmentation of PV installations in Europe 2011 – 2020 (Source: IEA PVPS).
4. PV MARKET FORECAST
The dynamics of the PV market globally are increasingly driven by the intrinsic competitiveness of PV
electricity on electricity markets, while more countries are putting regulations in place to support PV
development. Globally, the sector of renewables has been resilient with regards to the Covid-19 crisis
in 2020. In addition, the potential for growth and positive driving forces are still present and will
continue to stimulate the PV market. Therefore, the PV market in European countries in 2021 and 2022
should experience growth compared to its 2020 level. Nevertheless, the consequences of the Covid-
19 pandemic, especially in the financing sector, will continue to impact the market in 2021. The trends
will be strongly dependent on the importance that will be given to renewables and particularly PV in
the recovery plans set up by the different governments. This could accelerate the transition to
renewable energy, and moreover favour PV significantly over less competitive renewable sources.
Still, it is eventually foreseen that the PV capacity installed globally in 2021 should be at least equal to
2020’s figure. ESMC anticipates a slightly increasing market in Europe, at approximately 25 GW.
The European Union experiences a slightly different evolution compared to the rest of the world, since
PV has been developing here for more than 15 years. With approximately 151 GW of cumulative installed
PV capacity at the end of 2020, the EU covers roughly 6% of its electricity demand by PV. The electricity
demand has not grown since 2008 and the shift to electricity for transport and heating has not yet
materialized into a significant increase accordingly, thanks to counteracting energy efficiency
measures. In the EU, policy drivers remain essential to stimulate PV development. Promising
measures have been seen with 2030 decarbonization targets, but also for energy communities, support
for electric mobility and soon green hydrogen development.
7Much more remains to be done to achieve a level of market development significant enough to meet
the decarbonization objectives needed to avoid a catastrophic global climate change. By 2050, between
5 and 10 TW of cumulative solar PV could be needed in Europe to meet the objectives of the Paris
agreement2. Such levels of PV installations require that all options to develop PV are included, covering
PV with BAPV and BIPV, including industry and shopping-outlet roofs, using the existing ground space
for utility-scale plants, APV and FPV. Roads and infrastructures should not be forgotten and vehicle
integrated photovoltaics (VIPV) deserve an additional attention due to their demand side capabilities in
addition to electricity production and storage, as well as their ability to reduce charging needs.
5. GLOBAL AND EUROPEAN INDUSTRY STATUS
The PV value chain covers a wide range of technologies, incorporating material and equipment
providers, the production of PV modules (directly or through ingots, wafers and cells) and the balance
of system components (inverters, mounting structures etc.). The core of the value chain lies in the
ability to produce the central components of the PV modules, the cells themselves. A very large part
of the PV technology implies to produce cells, while producing PV modules, regardless of the
technology, rather consists of assembly.
While the PV industry started in Europe, Japan and the USA, it developed massively in Europe before
2010 and moved to Asia during the 2010–2020. Many of the innovations included in today’s Asian
products have been developed by European universities, R&D centres or by European PV equipment
suppliers. The European industry has the opportunity to respond to the growing market demand with
more advanced, reliable and sustainable technologies than those available on the market today.
The European industry covers the whole PV value chain. It includes a world-class polysilicon producer,
currently looking for ways to reduce its CO2 emissions. Wafer manufacturing is done at a 1 GW-scale
fabrication plant based on hydropower and with plans for expansion. Additionally, a breakthrough
kerfless wafer technology is currently under development and polysilicon from kerf recycling already
takes place in Europe – which has the lowest CO2 footprint of all production. Cell manufacturers are
small, but they are working with innovative technologies resulting in higher efficiencies compared to
mainstream technologies, thus with a higher energy output per unit area. Tandem structures, which
are being evaluated in R&D centres, show a rapid growth. This technology would greatly boost the
efficiency of the cells. Then, even if module manufacturers in the GW-scale are currently not on the
market, there are plenty of small to medium-size companies assembling modules. They employ
innovative technologies to reduce the cell-to-module losses, for example by using conductive back
sheets, smart-wire interconnection technology, or even manufacturing modules with the lowest CO2
emissions in the world. Some companies focus on specific products like back sheets, and glass
coatings to improve the reflective properties of the modules, trackers for bifacial applications,
inverters, cooling frames, solar glass, among others.
Finally, key equipment suppliers still exist, but the situation is fragile. Even with all these innovations,
the European share in the global PV value chain remains very limited. This is especially the case when
it comes to cell production, where Europe need local cell suppliers to reduce the dependency of the
European PV module producers from Asian products There is a strong will from different stakeholders
in the industry to build a 5GW+ factory using European technologies. Eventually, this will permit to
deliver advanced PV products that would be more sustainable, e.g. by requiring fewer resources than
2
LUT University (2020): 100% Renewable Europe: How To Make Europe’s Energy System Climate-
Neutral Before 2050
8conventional technologies or by guaranteeing ethic working conditions for all involved workers, while
staying cost-competitive at system level, supplying the local market, but also others.
Figure 5. Simplified representation of the PV Value Chain.
6. PV, AN INDUSTRIAL ADDED VALUE FOR EUROPE
For over two decades, Europe has been leading the technological development, state of the art
manufacturing, sustainability of production, quality, and efficiency of solar PV products. There is hardly
any other sector in the EU that received as much public dedication and thrilled more young people,
engineers, and scientists.
However, the European PV manufacturing industry has been suffering in the last years from fierce
competition with the rising giants from Asia, leading to an overall sharp decrease of competitiveness
of its incumbent players. This has led to the disappearance of several actors and has put the entire PV
value chain at risk. The core of that value chain, among others, the European cell manufacturers have
almost completely disappeared, which endangers the whole EU PV ecosystem.
Yet, the industry is not dead. With the support of a unique R&D landscape, it continues to innovate,
evolve, grow, and position itself in various segments of the value chain. Some actors have gained a
world-class expertise and leading positions, but they could suffer from the lack of commercial
opportunities at the industrial level in Europe. Appropriate and adequate policy measures should be
proposed and implemented to mitigate this competitive challenge already occurring in the EU.
Hence, Solar PV needs to be recognized now as a sector of strategic importance for the EU economy,
providing energy independence, industrial jobs, and economic growth. The European PV business will
generate hundreds of billions of euros in revenues, employ dozens of millions of people, in addition to
making a significant contribution to fighting climate change.
To demonstrate this added value of PV for the EU economy more factually, a study was performed by
the Becquerel Institute to quantify the estimated added value generated by the PV sector in the
European Economic Area3 both in terms of economic value and jobs created. In this study, three
situations were analysed:
1. The base case, i.e. the situation of the PV sector in 2020.
2. The projected situation in 2025 based on a business-as-usual scenario, where the market as
well as the industry evolve following existing trends, resulting in an annual installed PV
capacity of 25 GW.
3. The projected situation in 2025 based on a scenario with strong political engagement to
support the EU PV market and industry, resulting in an annual installed PV capacity of 35 GW.
3
EEA covers the EU-27 as well as the United Kingdom, Norway and Switzerland
9The annual PV market in the base case and projected situations are shown in Fel! Hittar inte
referenskälla..
Annual Market [GW]
35
25
19
2020 2025 2025
Business as Usual Political Engagement
Figure 6. Base case and projected annual market in the European Economic Area.
ECONOMIC VALUE CREATED AND CAPTURED IN EUROPE
Based on the annual European PV market (base case and projected), the economic value created by
PV installations was calculated for 2020 and 2025 considering average costs per watt-peak (Wp)
(current and projected) of all items of the cost structure of PV systems (such as the cost of
components, labour costs, planning and development costs, etc.). This allowed to evaluate both the
value created through the downstream activities (i.e. the installation as well as the operation and
maintenance of the system) and the value created through the upstream activities (the manufacturing
of the components of the system).
Moreover, this analysis was conducted considering the relative shares of the different segments and
sub-segments of the total PV market (centralised vs distributed; residential, commercial, industrial;
ground-mounted, floating, etc.). This is an important step, as these different types of installation are
associated with different level of costs.
Additionally, the share of the economic value created by the installed PV capacity in Europe that is
captured locally was estimated for all cost items. It was assumed that 100% of downstream value items
are captured locally, i.e. within the EU, while the share of upstream value items (i.e. materials and
components of the system) captured locally was quantified using as a proxy the estimated capacity
produced in the EU.
Assumptions were made for all 3 situations (2020, 2025 “BAU”, 2025 “Political Engagement”). For the
2025 “Political Engagement” scenario, an average 75% share of the PV capacity installed in the EU was
considered to be based on modules produced in the EU (16% in the “Business as Usual” scenario),
supposedly achieved thanks to the political support provided to the PV industry. Regarding the rest of
the components, it is assumed in the 2025 “Political Engagement” scenario that 66% of the balance of
system is manufactured in the EU, while this percentage only stands at 50% in the 2025 “Business-as-
usual” scenario.
Thus, the results in Figure 7 show the total economic value created thanks to the PV capacity installed
in Europe. This total value is split between the value captured locally in the EU and the “missed” value,
that is the economic value generated outside of the EU by the PV installations performed in the EU.
10The graph shows the increase of the total economic value created annually between 2020 and 2025,
and a higher increase of this value in the “Political Engagement” scenario compared to “Business-as-
usual”. This higher increase is linked to the augmented annual PV market favoured by appropriate
policies. In addition, the graph also highlights the missed value that can be regained from relocating
upstream industrial activities in the EU. In total, around 10 billion euros are additionally captured in the
EU in a single year through the “Political Engagement” scenario in 2025, compared to the “Business-
as-usual” scenario, i.e. a 75% increase of the captured value. At the same time, the missed economic
value is almost divided by a factor of two.
Annual Created Value [billion €]
Locally created and captured value
Locally created and missed value 3.7
6.1
6.8
22.7
11.5 13.0
2020 2025 2025
Business as Usual Political Engagement
Figure 7. Yearly economic value of PV installations in the European Economic Area
JOBS CREATED AND CAPTURED IN EUROPE
As for the created economic value, the number of jobs associated to the PV sector are estimated based
on two factors: the annual installed capacity and the share of this capacity produced locally. Specific
labour intensities are considered for the different parts of the value chain and regions. Again, for the
2025 “Political Engagement” scenario, an average 75% of the capacity installed in the EU is assumed to
be produced locally, supposedly achieved thanks to the political measures supporting the PV industry.
The results in Figure 8 show, on the left part of the figure, the number of total full-time jobs (i.e. direct
and indirect, downstream as well as upstream) that can be associated in Europe to PV installations on
an annual basis. It permits to quantify the impact of favouring a local production, through the
comparison of the 2025 “Political Engagement” scenario to the “Business-as-usual” scenario. Around
178 000 additional jobs would be created in Europe in case policies backing up the local PV value chain
would be enacted. Even more markedly, the right part of the figure specifically focuses on the upstream
sector, i.e. manufacturing and R&D, and shows an impressive 900% increase of the number of upstream
jobs in the 2025 “Political Engagement” scenario compared to the “Business as usual” scenario.
11Local total jobs [FTE] Local upstream jobs [FTE]
406 894
99 914
216 548 229 209
8 240 9 938
2020 2025 2025 2020 2025 2025
Business as Political Business as Political
Usual Engagement Usual Engagement
Figure 8. Yearly occupied total (left) and upstream (right) jobs in the PV sector in the European Economic Area.
Finally, it must be emphasized that the above results are estimated for quite conservative projections
of the PV annual installed capacity in 2025. The impact on the EU economy of relocating PV industry
within the Union will be tremendous when the PV market increased by the necessary 10-fold factor to
reach our climate goals. Furthermore, besides the numbers themselves, the qualitative aspects of the
created jobs need to be considered, as highly qualified industrial jobs will be created. One last element
to be noted is that this study only considers the EU PV market. Exportation of EU manufactured PV
products could increase the economic value generated in the EU thanks to solar PV even more.
127. ESMC’S STRATEGY
Considering the presented context and elements, the European Solar Manufacturing Council (ESMC)
has defined a strategy and course of action to achieve the renaissance of the European PV sector.
This strategy focuses on making PV a central element of the energy transformation process in Europe,
through a sustainable yet ambitious development of PV installations, in combination with a dynamic
and competitive manufacturing industry covering the entire PV value chain on European soil.
To achieve these goals, the ESMC envisions a set of policies and regulations aiming at developing the
PV market and the massive redevelopment of all segments of the PV value chain in Europe. This
industry will feed the expected massive development of PV installations in Europe and globally.
GENERAL STRUCTURE OF ESMC ACTIVITIES
SUPPORT PV MANUFACTURING IN EUROPE THROUGH APPROPRIATE POLICIES
The central point of ESMC’s activities aims at supporting PV manufacturing in Europe along the whole
value chain. This could be achieved by using smart instruments depending on the market and policy
evolutions. A general set of industrial policies will be required: ESMC favours a systemic approach to
EU-based production for the current and future energy system. It aims at creating a level playing field
with foreign (especially Asian and American) competitors. To reach this objective, a set of policy
instruments will be required:
1. PV in the post-Covid-19 environment: PV is a key enabling technology within the European
Green Deal and Recovery Packages, and a key pillar of the future European energy system
that will be based on renewable energy. Transfers from already existing R&D&I or
development framework is essential. PV must be advertised as a clear and powerful solution
to fight the economic downturn and mitigate climate change effects. In that respect, the
existing and new stimulus packages must comprise dedicated lines for PV development,
including manufacturing. As several countries have shown, the support for the energy
transformation depends on the public acceptance of the measures and developments. PV does
not escape this reality and well-paid jobs are part of the winning solution to public acceptance
of the energy transformation. This comprises installations, but also industrial- and R&D&I jobs.
2. Protect and expand strategically important value-chains locally: the COVID-19 crisis illustrates
the difficulties in several European countries to produce ad hoc equipment at a reasonable
price, when traditional global trade options are under heavy pressure. Medical systems are
only one of many value chains that must be preserved and reinforced in Europe in the coming
years. Energy, food, and military security are examples of fields of activity where such a
regional and local focus is crucial, while maintaining an open economy. One cannot
systematically rely on imports for key parts of the PV technology, as has been stated for a long
time by the European PV industry. As PV’s share of the electricity mix is increasing and PV is
becoming one of the most economic energy sources, it is of strategic importance to have the
EU regional and local PV value chain. One key element would consist of a fair tax system,
which would not disadvantage local actors.
3. Support technological evolution by setting up dedicated schemes to ease the depreciation, re-
usability and reconditioning of fast-changing equipment technologies.
134. Sustainability policies such as eco-design, green public procurement, ecolabel and energy
label, or “environmental (CO2 content including transportation, scarce and hazardous
materials etc.) and social footprint”: simple but honest and traceable regulation schemes must
be developed and applied to promote high environmental standards including carbon footprint.
In addition to sustainability, social and quality standards are core elements of manufacturing
in Europe. In this respect, the current work of the European Commission is an essential pillar
to be supported and incentivized.
5. Financing tools: Public (Local, regional, national, European) and private financing tools will
have to be fine-tuned to support local manufacturing. A special focus on the European
Investment Bank (EIB) activities and rules of engagement are needed, combined with a novel,
off-takers based approach, to de-risk the establishment of PV manufacturing. Credit
guarantees give access to low-interest bank credits with no cost for taxpayers for successful
enterprises. New investment schemes such as crowdfunding, crowdlending, Venture Capital,
business angels or pension funds could be favoured, depending on the business segment and
the technology novelty.
6. Export facilities: the EU PV market will be favoured by European manufacturers but should not
stop at the European borders. European PV systems will be attractive on the world market. In
addition to tuning existing export policies and networks, an internal expert network – by
invitation only or for members with special affiliation, should be formed. In addition, a database
of experts and structures (e.g. GIZ, SE4ALL) should contribute to support the industry with the
right tools.
SUPPORT PV MANUFACTURING IN EUROPE THROUGH APPROPRIATE MARKET
DEVELOPMENT
Market and industry developments can hardly be separated. A market development disconnected from
industrial development would result in a continuous insufficient acceptance from the public and
policymakers. As a result, market development should be developed in parallel and in symbiosis with
manufacturing options, to maximize European based added-value and the creation of high employment
possibilities.
Based on the following concepts, develop an appropriate solar PV market, as this technology is the
key electricity generation source of the 21st century:
1. Wide-spread distributed PV: self-consumption and energy communities, including novel
decentralized and collective self-consumption concepts and peer-to-peer trading should
expand further.
2. Competitive PV is there, shifting policies to accompany industrial PV development in Europe,
including tenders for utility-scale PV plants.
3. Integrated PV: A double concept: "PV everywhere" and “Dual Use-Territory (DUT)” including
integrated PV concepts such as:
a. BIPV: promoting BIPV in Europe and globally, including smart simplified BIPV regulations
and products will create a new market for PV development.
14b. VIPV: PV in the automotive sector, accelerating the energy revolution though PV integrated
in EVs with local PV-loading facilities. The use of PV embedded in EVs or to charge EVs
with green electricity will contribute decarbonizing the automotive sector faster.
c. All other integrated PV concepts and dual-use ones such as FPV, APV, PV noise barriers,
PV above roads, PV above parking lots, etc.
4. Connecting Information technology to Smart Grids, digitalizing the energy systems including
potential use of innovative technology to allow a seamless integration of high renewable
energy shares in energy networks.
5. Solar Fuels: Green Hydrogen and similar clean synthetic fuels from solar PV will allow fully
decarbonizing the energy sector, and the industry, at the lowest cost. Low-cost and reliable
PV electricity is key to produce competitive green hydrogen!
ALLIANCE BUILDING
PV must be seriously considered and requires massive support from all industries and sectors that it
will significantly reshape in the coming years. ESMC proposes to build powerful alliances, which will
increase the added value of these sectors and drive the acceleration of their adaptation to the energy
transformation.
1. The energy sector at large: energy companies should realize the opportunities that PV offers,
both in the power and general energy sectors.
2. Building sector: In addition to retrofitting solar panels on rooftops, the building code should
require PV on all suitable roofs of new buildings. Renovations are another part of the markets
to explore for PV to massively develop in Europe, offering new opportunities and joining forces
with the heating and cooling sectors, smart buildings, and energy communities. BIPV is only
one of the multiple aspects of the inclusion of PV in the building sector.
3. Transport sector: VIPV can revolutionize transport, from automotive and motorbikes to
aviation and the maritime transport sector. But it offers other possibilities to include PV as a
part of its energy perspectives, e.g. via the integration of PV into the transport infrastructure
such as roads, rail stations, sound barriers, EV charging stations and compensation areas.
4. Heavy industries: PV has a key role to play in decarbonizing heavy energy industries such as
steel and concrete, through replacing carbon by green hydrogen, and by direct use of clean
electricity. PV in sun-rich parts of Southern Europe will provide the lowest-cost Green
Hydrogen that will be needed in huge volumes.
5. Energy vectors and storage: this comprises the production and distribution of green hydrogen
and joined business models for PV, but not exclusively. There are both numerous and
promising connections with the transport and building sectors and an increasing use of
batteries and other storage systems in innovative business models will favour the PV
development. FPV on artificial lakes providing hydropower can double the power output of the
generators, by using PV power during daytime and hydropower in the night.
156. Telecommunications and ICT: while smart grid concepts emerge to allow integrating a higher
share of distributed variable renewables within the grids, the need for ad hoc communication
increases. This is also the case for tools to involve the existing ICT actors and to merge the
worlds of energy and communication. In addition, the rapidly growing power demand of
computing centers can be covered sustainably by local PV combined with battery storage.
SUPPORT R&D FOR PV WITHIN THE ENERGY TRANSFORMATION
There is no industrial success without R&D&I properly funded and linked to the manufacturing industry.
ESMC supports a massive plan for funding R&D towards new and innovative technologies and their
path to market development. This can include specific policies to favour pilot projects in the industry.
The key factors are as follows:
1. R&D activities focusing on cost reduction of PV, efficiency increase, reduced use of
unsustainable materials and scarce resources, eco-design of the products, re-usability, and
recycling of products.
2. A balanced focus on existing technologies and promising new ones.
3. The smart use of the new Horizon Europe program and other support scheme facilitation
4. Two-ways smart international cooperation
5. R&D Interaction with other new technologies such as green hydrogen generation,
ICT/digitalization, etc.
All the package of policies proposed, appropriate market developments supported, alliance building
measures and R&D support instruments should combine one integrated, clearly structured and PV
manufacturing industry renaissance oriented strategic vision and tactical actions to ensure the
appropriate priorities, timely implementation and result-oriented targets for the PV development,
deployment and PV manufacturing in the EU.
Contact: Dr. Johan Lindahl www.esmc.solar
ESMC’s Secretary General Address: Energy Hub – 146 Rue Royale
lindahl@esmc.solar 1000 Brussels, Belgium 16You can also read